The Client
A mid-market consumer electronics brand selling on Amazon US, Walmart, and Best Buy, with just over 200 priority SKUs and a small pricing team. Competitive product, capable analysts, and a growing sense that its pricing decisions were always arriving a few days too late.
Client details are anonymised. Figures are representative of the engagement.
The Problem: A Report That Was Stale Before It Was Read
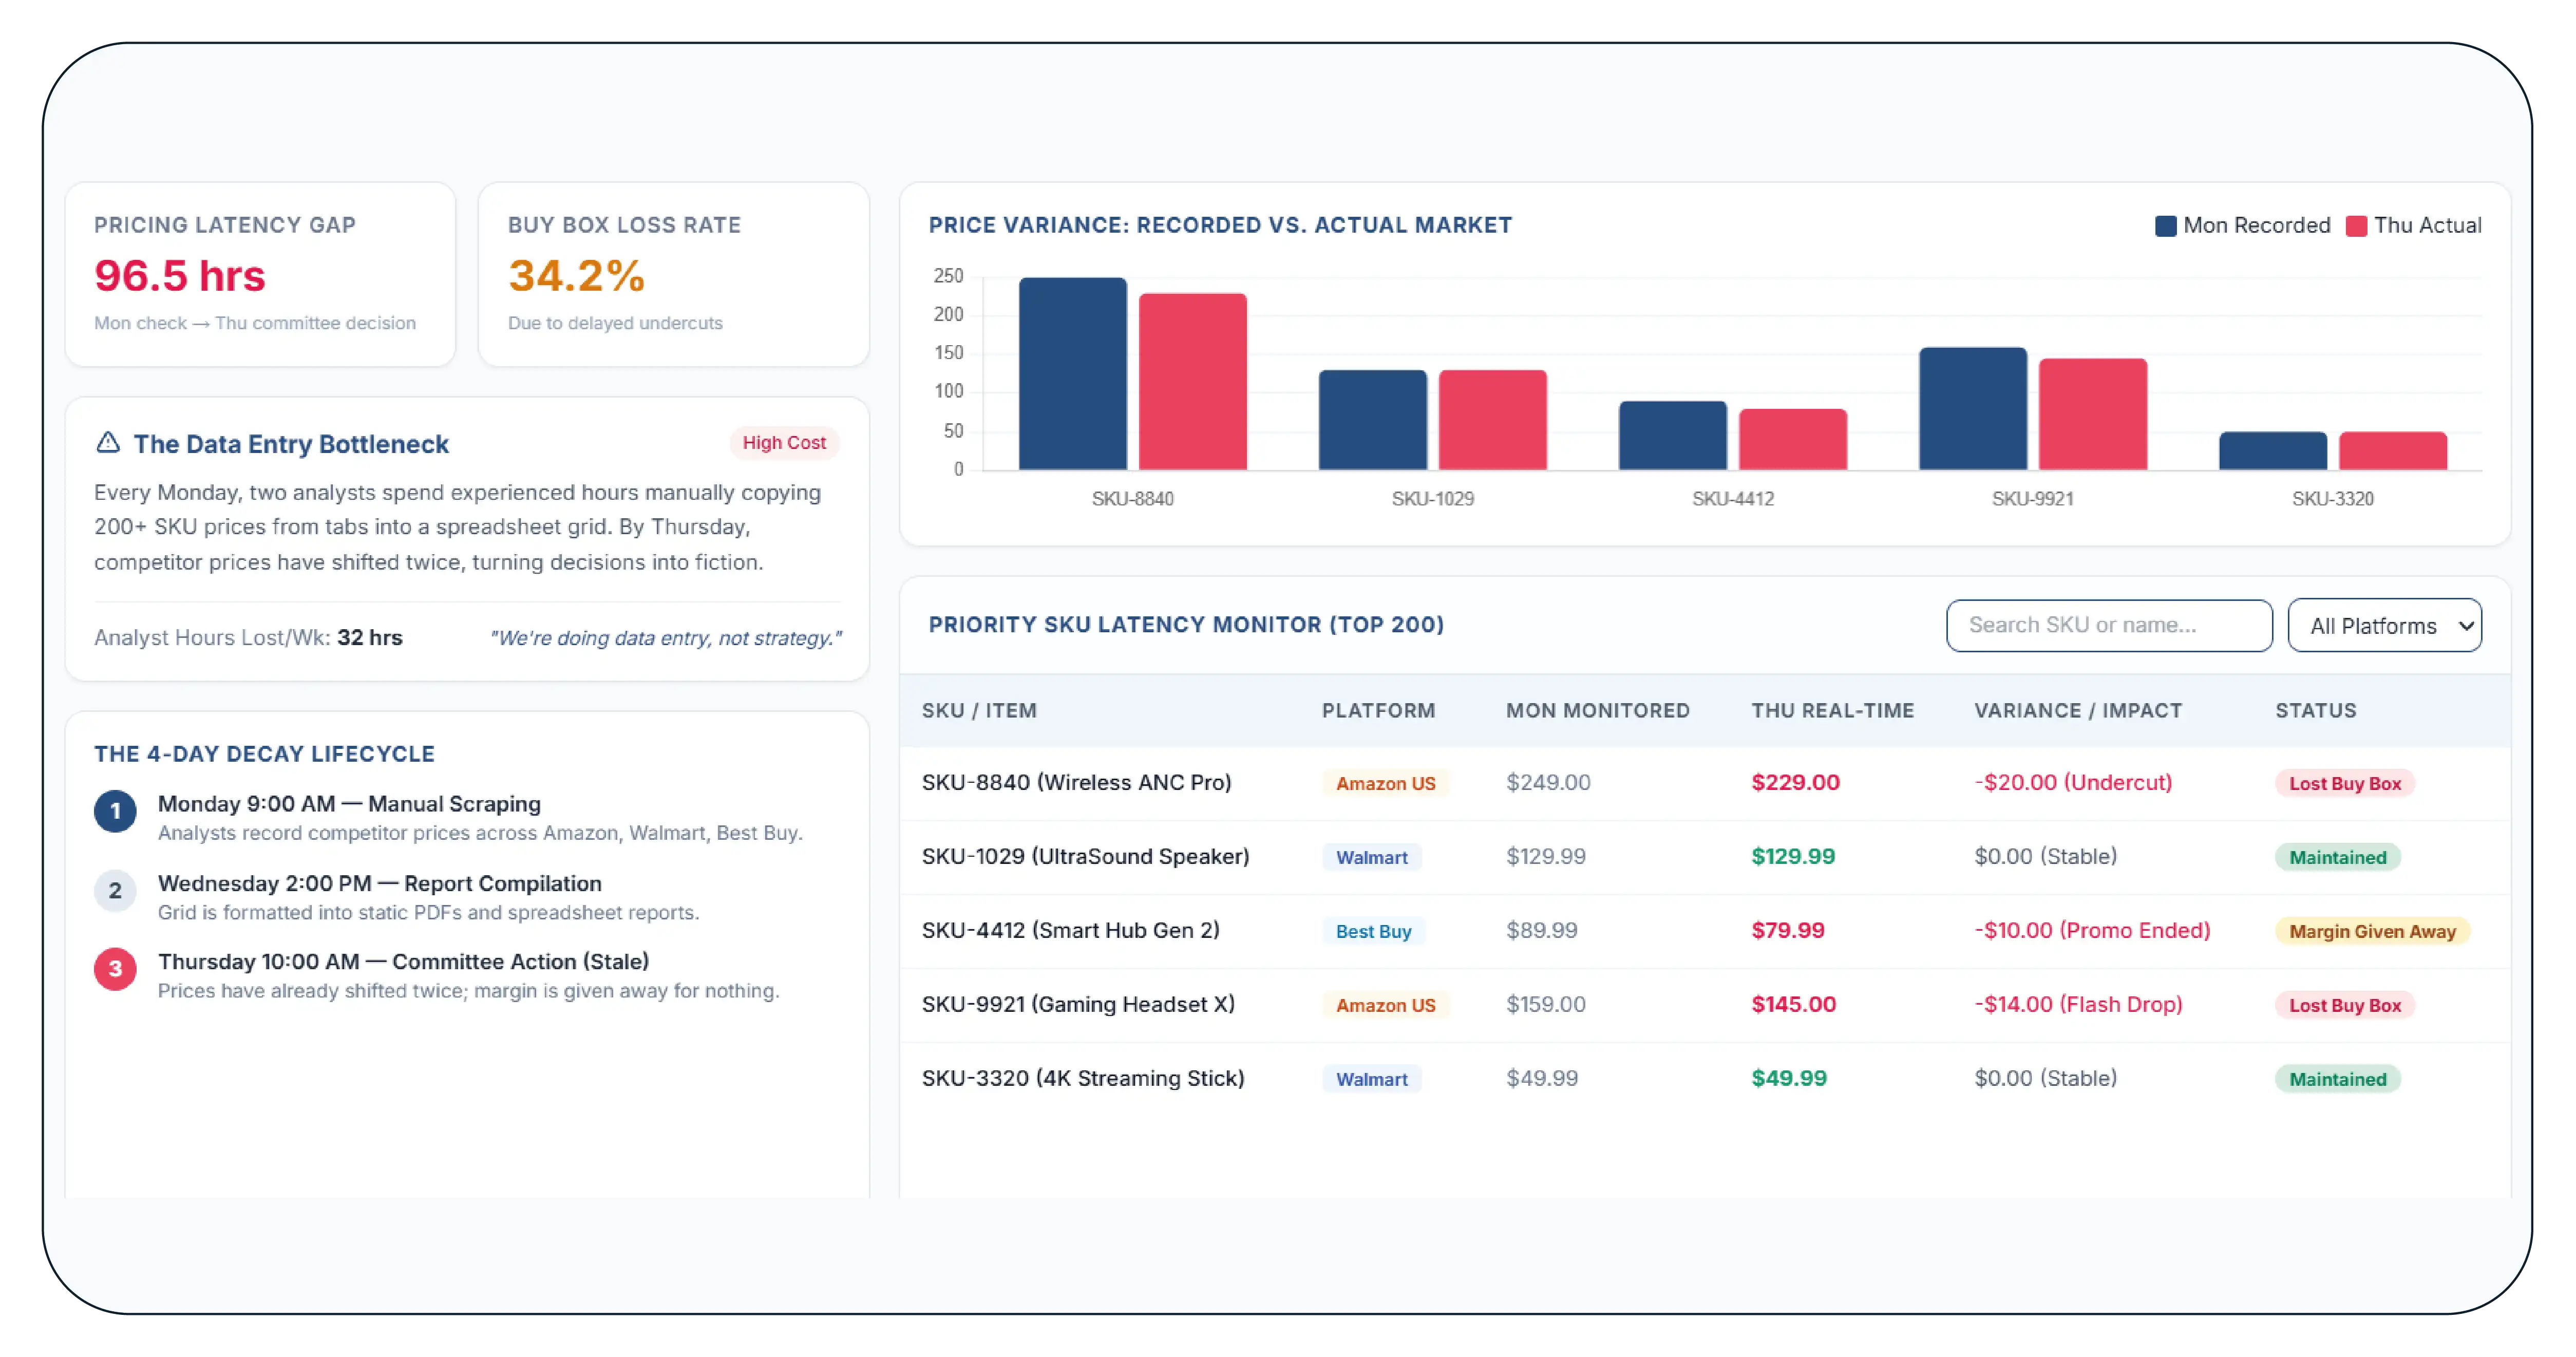
The brand did not have a pricing problem. It had a pricing latency problem — and the two look identical on a margin report until you measure the gap between when a competitor moves and when you find out.
Every Monday, two analysts opened three browser tabs and a spreadsheet. They checked the prices of 200+ priority SKUs across Amazon US, Walmart, and Best Buy — the brand's own listings and the closest competitor equivalents — and typed what they found into a grid. By Wednesday the grid became a report. By Thursday it reached the pricing committee.
By then it was fiction. Competitor prices on these marketplaces move continuously; a price recorded on Monday morning had, in many cases, already changed twice before the committee saw it on Thursday. The team was steering by a rear-view mirror that showed the road four to five days back.
The costs were concrete. The brand held prices too high while a competitor had quietly undercut, losing the Buy Box and the sale. It cut prices to match a competitor discount that had already ended, giving up margin for nothing. And the two analysts spent the most experienced hours of their week copying numbers instead of deciding what to do about them.
The pricing lead's summary: we're not debating strategy on Mondays, we're doing data entry — and by the time anyone can act on it, it's wrong.
Why the Manual Process Could Not Scale
The obvious fix — check more often — was impossible by hand. Three structural walls blocked it.
Volume. 200+ SKUs across three marketplaces, each with its own listing, competitor set, and Buy Box, is a wall of data a person can survey once a week and never daily. Frequency and thoroughness were mutually exclusive at the team's headcount.
Matching. The same product carries different titles and identifiers on Amazon, Walmart, and Best Buy. Deciding "this is the competitor equivalent of our SKU" by eye is slow and inconsistent, and it was quietly introducing errors into the grid that no one had time to audit.
Effective price. The number that matters is not the listed price but the price after promotions, and on marketplaces those move fastest of all. Capturing them by hand was the first thing to get dropped under time pressure — so the brand was frequently benchmarking on the layer that moved least.
Adding a third analyst would have bought a marginally fresher report at a materially higher cost, and still left the committee debating numbers instead of strategy.
The Solution: Automated Competitor Price Monitoring
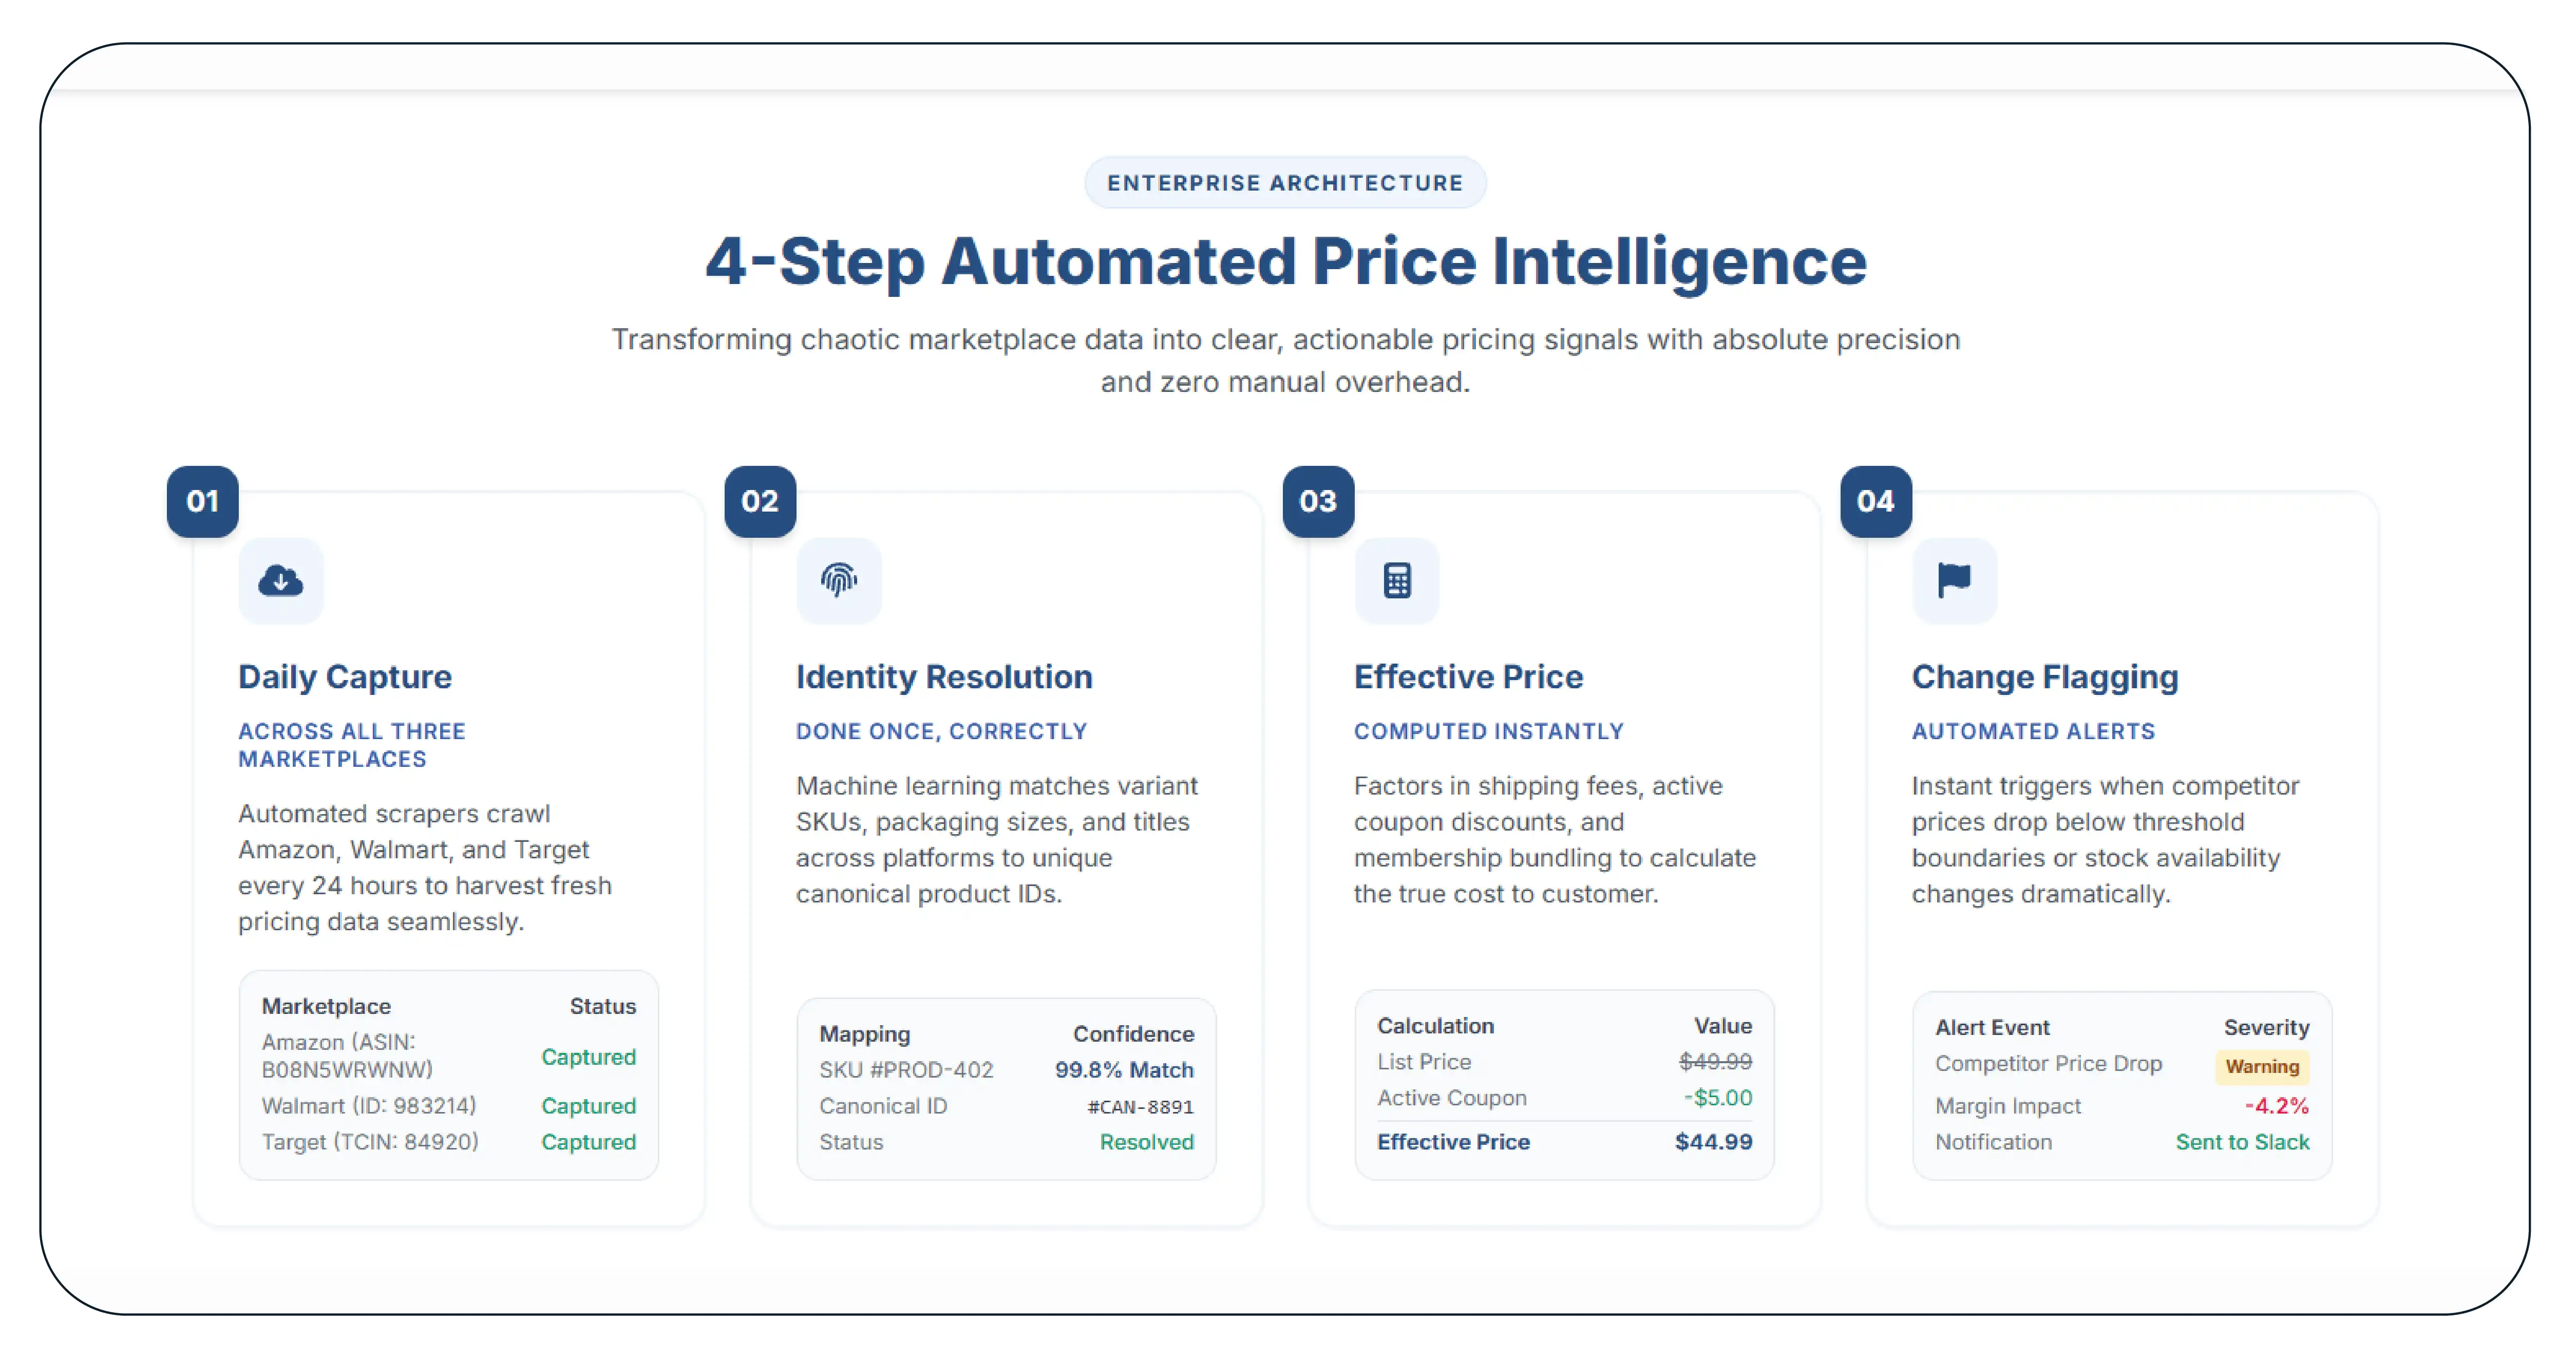
Product Data Scrape replaced the Monday spreadsheet with a daily automated feed built around the three things the manual process could not do reliably.
Daily capture across all three marketplaces. The brand's SKUs and their matched competitor set were captured every morning across Amazon US, Walmart, and Best Buy — listed price, promotional price, Buy Box status, seller, and availability — delivered before the working day began.
Identity resolution done once, correctly. Products were matched across the three marketplaces on structured identifiers rather than by eye, so "our SKU versus its equivalents" was consistent, auditable, and no longer an analyst's Monday guess.
Effective price, computed. Promotions were resolved into an effective price on every record, so the brand benchmarked what a customer actually pays, not the listed number that moves least.
Change flagging. The feed did not just report prices; it flagged what had changed since yesterday — competitor drops, Buy Box losses, new undercuts — so the team read exceptions, not the whole grid.
Delivered as a structured feed into the brand's own tools, the output arrived every morning as a short, pre-matched, pre-flagged summary — the daily "Monday-morning email," now landing every day.
Sample Data: What Landed Every Morning
An illustrative slice of one day's flagged feed for a single priority SKU and its matched competitors.
| Line |
Listed |
Effective Buy Box |
vs Yesterday |
Flag |
| Our SKU — Amazon US |
$179 |
$179 |
Won |
No change — |
| Competitor A — Amazon US |
$185 |
$169 |
↓ $16 (promo) |
Undercut |
| Our SKU — Walmart |
$179 |
$179 |
Lost |
Buy Box lost |
| Competitor B — Walmart |
$176 |
$176 |
Won |
New leader |
| Our SKU — Best Buy |
$179 |
$179 |
n/a |
No change — |
| Competitor A — Best Buy |
$189 |
$189 |
n/a |
Priced above us |
Illustrative figures.
The structured record:
{
  "our_sku": "ELEC-SKU-4471",
  "marketplace": "amazon_us",
  "captured_at": "2026-08-11T06:30:00-05:00",
  "our_effective_price": 179,
  "our_buy_box": "won",
  "matched_competitor": {
    "seller": "Competitor A",
    "listed_price": 185,
    "effective_price": 169,
    "promo_active": true
  },
  "delta_vs_yesterday": -16,
  "flag": "competitor_undercut",
  "match_method": "identifier_exact"
}
The team no longer read every row. They read the flags: an Amazon competitor now $10 below the brand's effective price via a promotion, and a lost Walmart Buy Box to a new leader. Two decisions, surfaced in seconds, that the old Monday grid would have shown on Thursday — if it caught them at all. And the match_method field recorded the identity resolution the manual process had done by eye, now consistent and auditable on every record.
What the Brand Did
Read exceptions, not grids. The daily flagged summary replaced the weekly full-grid review, so the pricing team spent its attention on the handful of SKUs that had actually moved rather than re-checking hundreds that hadn't.
Responded within the day. With competitor undercuts and Buy Box losses surfaced each morning, the brand adjusted inside the same day rather than four to five days later — closing the two specific losses of holding high while undercut and cutting to match expired promotions.
Benchmarked on effective price. The team stopped reacting to listed-price moves that were not effective-price moves, and started responding to the number the customer actually sees.
Freed the analysts. The two analysts moved off data entry and onto pricing rules and committee briefings — the work the brand had actually hired them to do.
The Results (90 Days)
| Metric |
Before |
After 90 Days |
| Manual pricing-check time |
~2 analyst-days/week |
~15 minutes/day (−92%) |
| SKUs monitored daily |
0 (weekly only) |
200+ across 3 marketplaces |
| Time from competitor move to brand awareness |
4–5 days |
Same day |
| Margin retention on monitored SKUs vs control |
baseline |
+3.1 points |
| Analyst time on strategy vs data entry |
Mostly data entry |
Mostly strategy |
Figures are representative of the engagement outcome.
The Director of Pricing's summary, quoted with permission: we went from two analysts spending Mondays in spreadsheets to a Monday-morning email with everything already matched and flagged. Now the pricing committee debates the response, not the numbers.
The Lesson
Manual competitor price monitoring does not fail because the analysts are slow. It fails because a person can be either thorough or frequent, never both, across hundreds of SKUs on multiple marketplaces. The brand had been paying its two most capable pricing people to be a data pipeline — one that ran once a week, made matching errors, and skipped the effective-price step under pressure.
Automating the capture did not replace the analysts. It gave them back their Mondays, and it gave the pricing committee a fresh, matched, flagged picture every morning instead of a stale one every Thursday. In fast-moving marketplace pricing, that latency — the days between a competitor's move and your knowledge of it — is the margin you keep or lose.
Work With Product Data Scrape
Product Data Scrape delivers competitor price monitoring across Amazon, Walmart, Best Buy, and 500+ marketplaces: daily multi-marketplace capture, identifier-based product matching, computed effective price, Buy Box status, and change flagging — as JSON, CSV, API, or dashboard-ready feeds into your own tools.
Ask us for a sample competitor-price feed on your priority SKUs — we will show you what your team is finding out four days too late.
Product Data Scrape — turning marketplace complexity into decision-ready data.


 Singapore
 EMAIL
EMAIL
 PHONE
PHONE















.webp)






