Introduction
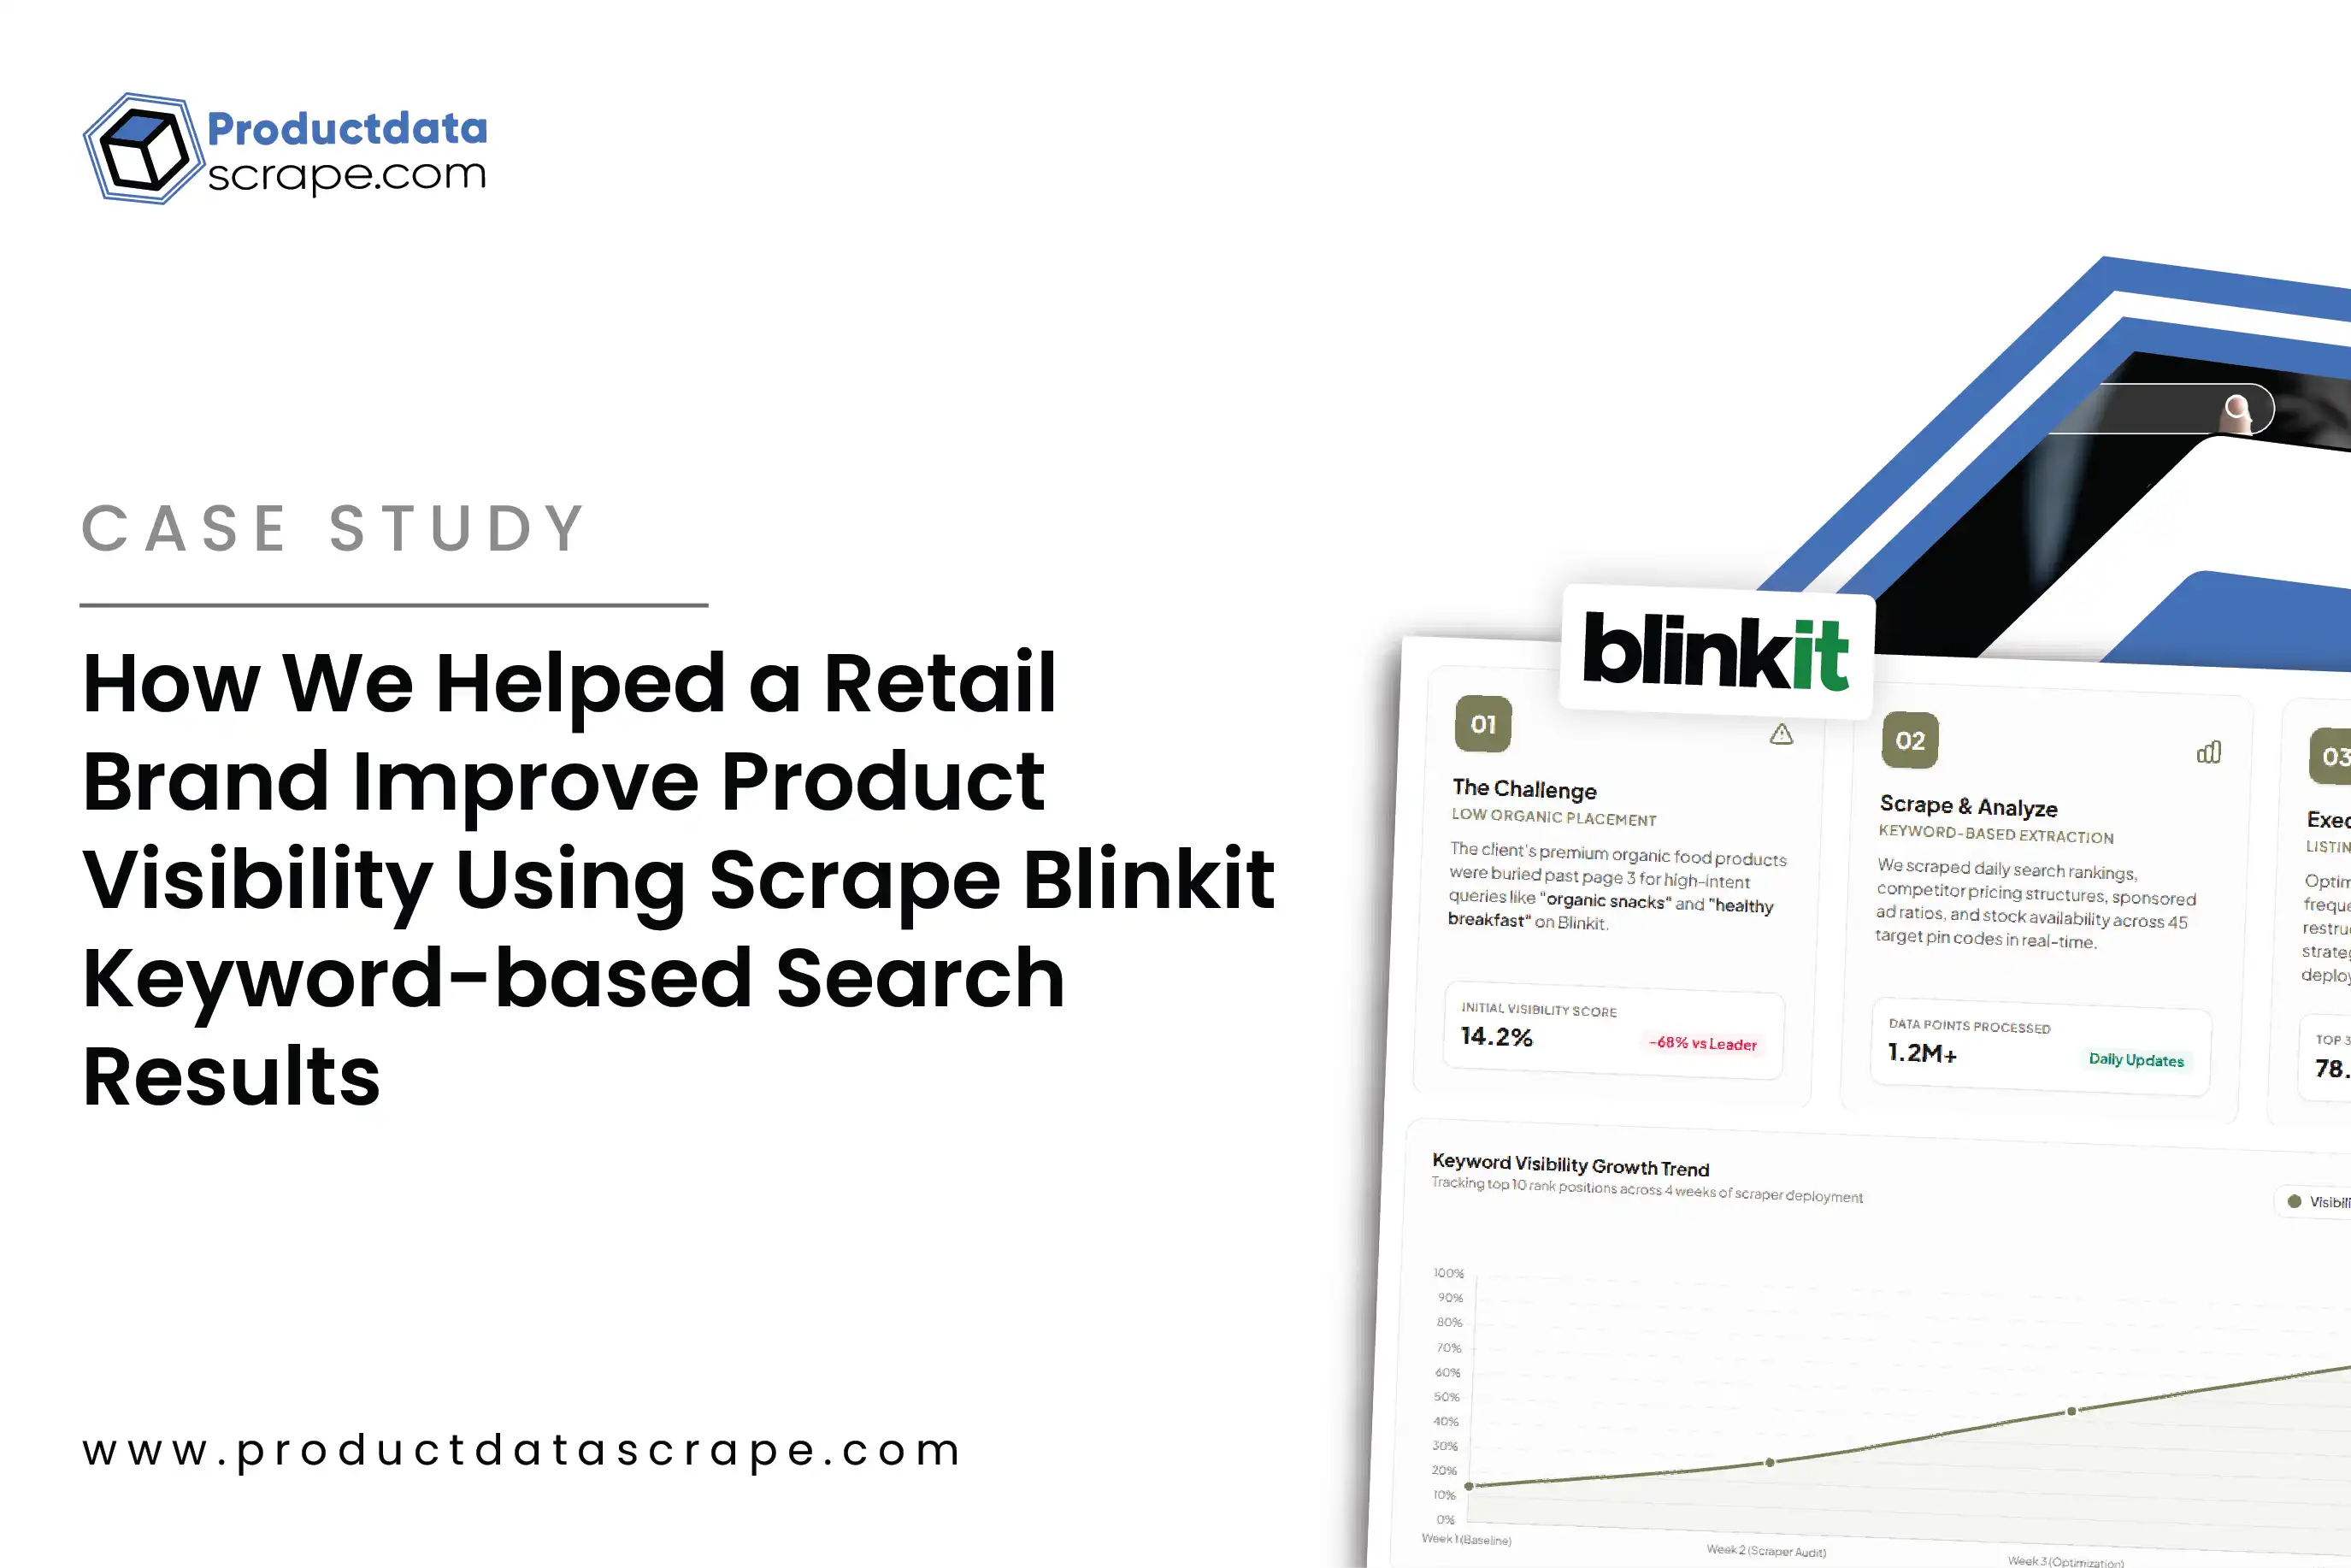
Organic grocery brands need more than product availability to compete on quick-commerce platforms. They also need visibility into search rankings, product placement, dark-store availability, pricing, and competitor activity. Blinkit Keyword and Dark Store Search Rank Data provides structured marketplace information that can help brands understand how organic grocery products appear across search results and local fulfillment locations.
Search visibility can change based on keyword relevance, inventory, location, competition, promotions, and marketplace algorithms. A product that ranks well in one location may rank differently in another. This makes continuous monitoring important.
For organic grocery brands, Product content audits can identify missing attributes, weak descriptions, inconsistent product information, and content gaps that may affect product discoverability.
A structured monitoring program can track:
- Keyword search positions.
- Product ranking changes.
- Dark-store availability.
- Product page information.
- Competitor visibility.
- Category placement.
- Ratings and reviews.
- Price and promotional changes.
The figures below are illustrative benchmarks showing how a monitoring program can scale from 2020 to 2026.
Illustrative Monitoring Scale (2020–2026)
| Year |
Illustrative Keywords Tracked |
Products Monitored |
Dark Stores |
| 2020 |
100 |
500 |
20 |
| 2021 |
180 |
800 |
35 |
| 2022 |
300 |
1,200 |
60 |
| 2023 |
500 |
2,000 |
100 |
| 2024 |
800 |
3,000 |
150 |
| 2025 |
1,200 |
5,000 |
250 |
| 2026 |
1,800+ |
7,500+ |
350+ |
These figures are illustrative rather than audited market statistics. The actual monitoring scale depends on the brand, category, geography, product coverage, and required collection frequency.
How Can Brands Monitor Search Rankings and Local Availability?
Organic grocery search performance can vary by location. A consumer searching for "organic atta" in one area may see a different product order than a consumer searching in another area. Local inventory can influence what appears and how products are positioned.
A Blinkit organic search ranking API can support structured collection of relevant search-result information for monitored keywords. Brands can use this data to record product positions, ranking changes, availability, and other visible attributes.
Dark stores add another layer of complexity. A product can have strong search visibility but remain unavailable at a specific fulfillment location. Dark-store inventory tracking helps connect search performance with local availability.
A useful dataset can connect:
Keyword → Location → Dark Store → Product → Rank → Availability → Timestamp
This structure creates a historical record of search visibility.
Illustrative Search & Inventory Monitoring Scale (2020–2026)
| Year |
Keywords |
Illustrative Rank Checks/Month |
Dark Stores Monitored |
| 2020 |
100 |
1,000 |
20 |
| 2021 |
180 |
2,000 |
35 |
| 2022 |
300 |
5,000 |
60 |
| 2023 |
500 |
10,000 |
100 |
| 2024 |
800 |
20,000 |
150 |
| 2025 |
1,200 |
40,000 |
250 |
| 2026 |
1,800+ |
75,000+ |
350+ |
These numbers demonstrate an illustrative monitoring model.
Brands can use the resulting data to answer important questions.
- Which keywords produce the highest visibility?
- Which products frequently enter the top positions?
- Which locations show lower availability?
- Which competitors consistently appear ahead?
The data can also reveal the relationship between inventory and rankings. A product that disappears from a local inventory pool may lose visibility for that area.
This makes search and inventory monitoring complementary.
For organic grocery brands, location-level monitoring can support assortment decisions. Teams can identify products that perform well in certain areas and evaluate whether availability matches customer demand.
Historical rank data also makes performance measurement easier. Instead of looking at a single search position, businesses can measure ranking movement over days, weeks, and months.
This creates a stronger foundation for marketplace optimization.
How Does Product Listing Data Improve Marketplace Visibility?
Product listing pages contain important information that can influence how customers understand and compare products. Titles, descriptions, images, pack sizes, brands, categories, prices, and other attributes contribute to the digital shelf experience.
Blinkit PLP data scraping can help businesses collect structured information from product listing pages for analysis. The resulting dataset can be used to compare product placement, assortment, pricing, and competitor visibility.
A product listing analysis can identify:
- Missing product attributes.
- Inconsistent naming.
- Different pack-size formats.
- Category placement.
- Price differences.
- Discount information.
- Availability status.
- Competitor product positioning.
Illustrative PLP Monitoring Scale (2020–2026)
| Year |
Illustrative PLP Records |
Fields Monitored |
Primary Objective |
| 2020 |
5,000 |
8 |
Basic listing analysis |
| 2021 |
8,000 |
10 |
Product comparison |
| 2022 |
15,000 |
12 |
Content monitoring |
| 2023 |
25,000 |
14 |
Competitor benchmarking |
| 2024 |
40,000 |
16 |
Digital shelf analysis |
| 2025 |
65,000 |
18 |
Automated monitoring |
| 2026 |
100,000+ |
20+ |
Continuous intelligence |
These figures are illustrative.
Content quality matters because consumers often make quick decisions on quick-commerce platforms. A product title that clearly communicates brand, variant, and pack size can be easier to understand.
Businesses can compare their product content with competitors. They can identify whether competitors provide more complete information or use different naming patterns.
PLP monitoring also helps category teams understand assortment. A competitor may introduce a new organic product without a major announcement. Regular listing monitoring can detect the new product.
The same approach can identify products that disappear from listings.
Price and discount data provide another dimension. A product may appear prominently while carrying a higher price than competitors. Another product may gain attention through a promotional discount.
By combining content, pricing, availability, and position data, brands can evaluate their complete marketplace presence.
This turns basic product listing collection into a practical optimization tool.
How Can Brands Monitor Search Results Over Time?
Search rankings are dynamic. A product can move from the first page to a lower position as competitors enter the category or inventory changes.
Blinkit search results monitoring provides recurring observations that help brands understand these movements.
A structured Blinkit grocery dataset can contain search terms, product names, brands, ranking positions, prices, availability, ratings, timestamps, and other relevant fields.
This allows businesses to compare current results with previous observations.
Illustrative Search Monitoring Scale (2020–2026)
| Year |
Illustrative Search Terms |
Monthly Search Checks |
Historical Records |
| 2020 |
100 |
1,000 |
12,000 |
| 2021 |
180 |
2,000 |
24,000 |
| 2022 |
300 |
5,000 |
60,000 |
| 2023 |
500 |
10,000 |
120,000 |
| 2024 |
800 |
20,000 |
240,000 |
| 2025 |
1,200 |
40,000 |
480,000 |
| 2026 |
1,800+ |
75,000+ |
900,000+ |
These figures are illustrative monitoring benchmarks.
Historical records can answer questions that a single snapshot cannot.
For example:
- Did a product gain or lose ranking?
- Which competitor entered the top results?
- Did a price change coincide with a ranking movement?
- Did availability changes affect visibility?
- Which keywords consistently generate strong positions?
Brands can group keywords by intent. Some may be generic terms such as "organic rice." Others may include specific brands, product types, or attributes.
This allows teams to measure visibility across different search groups.
Rank averages can also be calculated. A brand appearing in position 2 for several important keywords may have stronger search visibility than a brand appearing in position 10.
However, rank should not be analyzed alone. Availability, pricing, promotions, ratings, and product content provide useful context.
This is why a broader dataset is valuable.
A historical search dataset can also help identify seasonal changes. Organic grocery searches may change during health-focused campaigns, festivals, or promotional periods.
The resulting intelligence can support marketplace planning and competitive analysis.
How Can Quick-Commerce Search Data Support Competitive Strategy?
Quick commerce creates a highly competitive digital shelf. Customers can compare products quickly and switch between brands with little effort.
Quick commerce search intelligence helps brands understand how products perform within this environment.
Search intelligence combines ranking data with product, pricing, availability, and competitor signals. It can reveal which brands dominate specific search terms and which products struggle to gain visibility.
A business can create a keyword-level competitor matrix.
Illustrative Competitive Intelligence Scale (2020–2026)
| Year |
Illustrative Keywords |
Brands Compared |
Main Intelligence |
| 2020 |
100 |
5 |
Basic rankings |
| 2021 |
180 |
7 |
Visibility comparison |
| 2022 |
300 |
10 |
Competitor monitoring |
| 2023 |
500 |
15 |
Category intelligence |
| 2024 |
800 |
20 |
Search-share analysis |
| 2025 |
1,200 |
25 |
Multi-location intelligence |
| 2026 |
1,800+ |
30+ |
Automated competitive analysis |
These figures are illustrative.
The data can help answer practical business questions.
A brand may want to know whether its organic products appear consistently for high-value keywords. It may also want to know which competitors appear most frequently in top positions.
Another useful metric is ranking share. A brand can calculate the percentage of tracked keywords where it appears within a defined top-ranking range.
Location adds another dimension.
A product may rank strongly in one city but poorly in another. This could result from inventory, local competition, or assortment differences.
Search intelligence can therefore support local strategy.
Businesses can also compare ranking movements with promotions. If a competitor launches a discount and gains visibility, the event becomes a useful competitive signal.
Historical monitoring makes these relationships easier to study.
The result is a more complete view of marketplace performance.
Instead of asking only "What is my current rank?", teams can ask "Why did my rank change, where did it change, and which competitor moved ahead?"
That shift makes search data more useful for business decisions.
How Can Automated Search Collection Reduce Manual Monitoring?
Manual search monitoring requires analysts to repeatedly enter keywords, record product positions, capture product information, and compare results. This process becomes difficult as keyword and product coverage expands.
Web scraping Blinkit search results can automate recurring collection workflows for relevant publicly visible marketplace information. The collected records can then be structured for analysis.
At the same time, Grocery data scraping can provide broader product-level information across grocery categories.
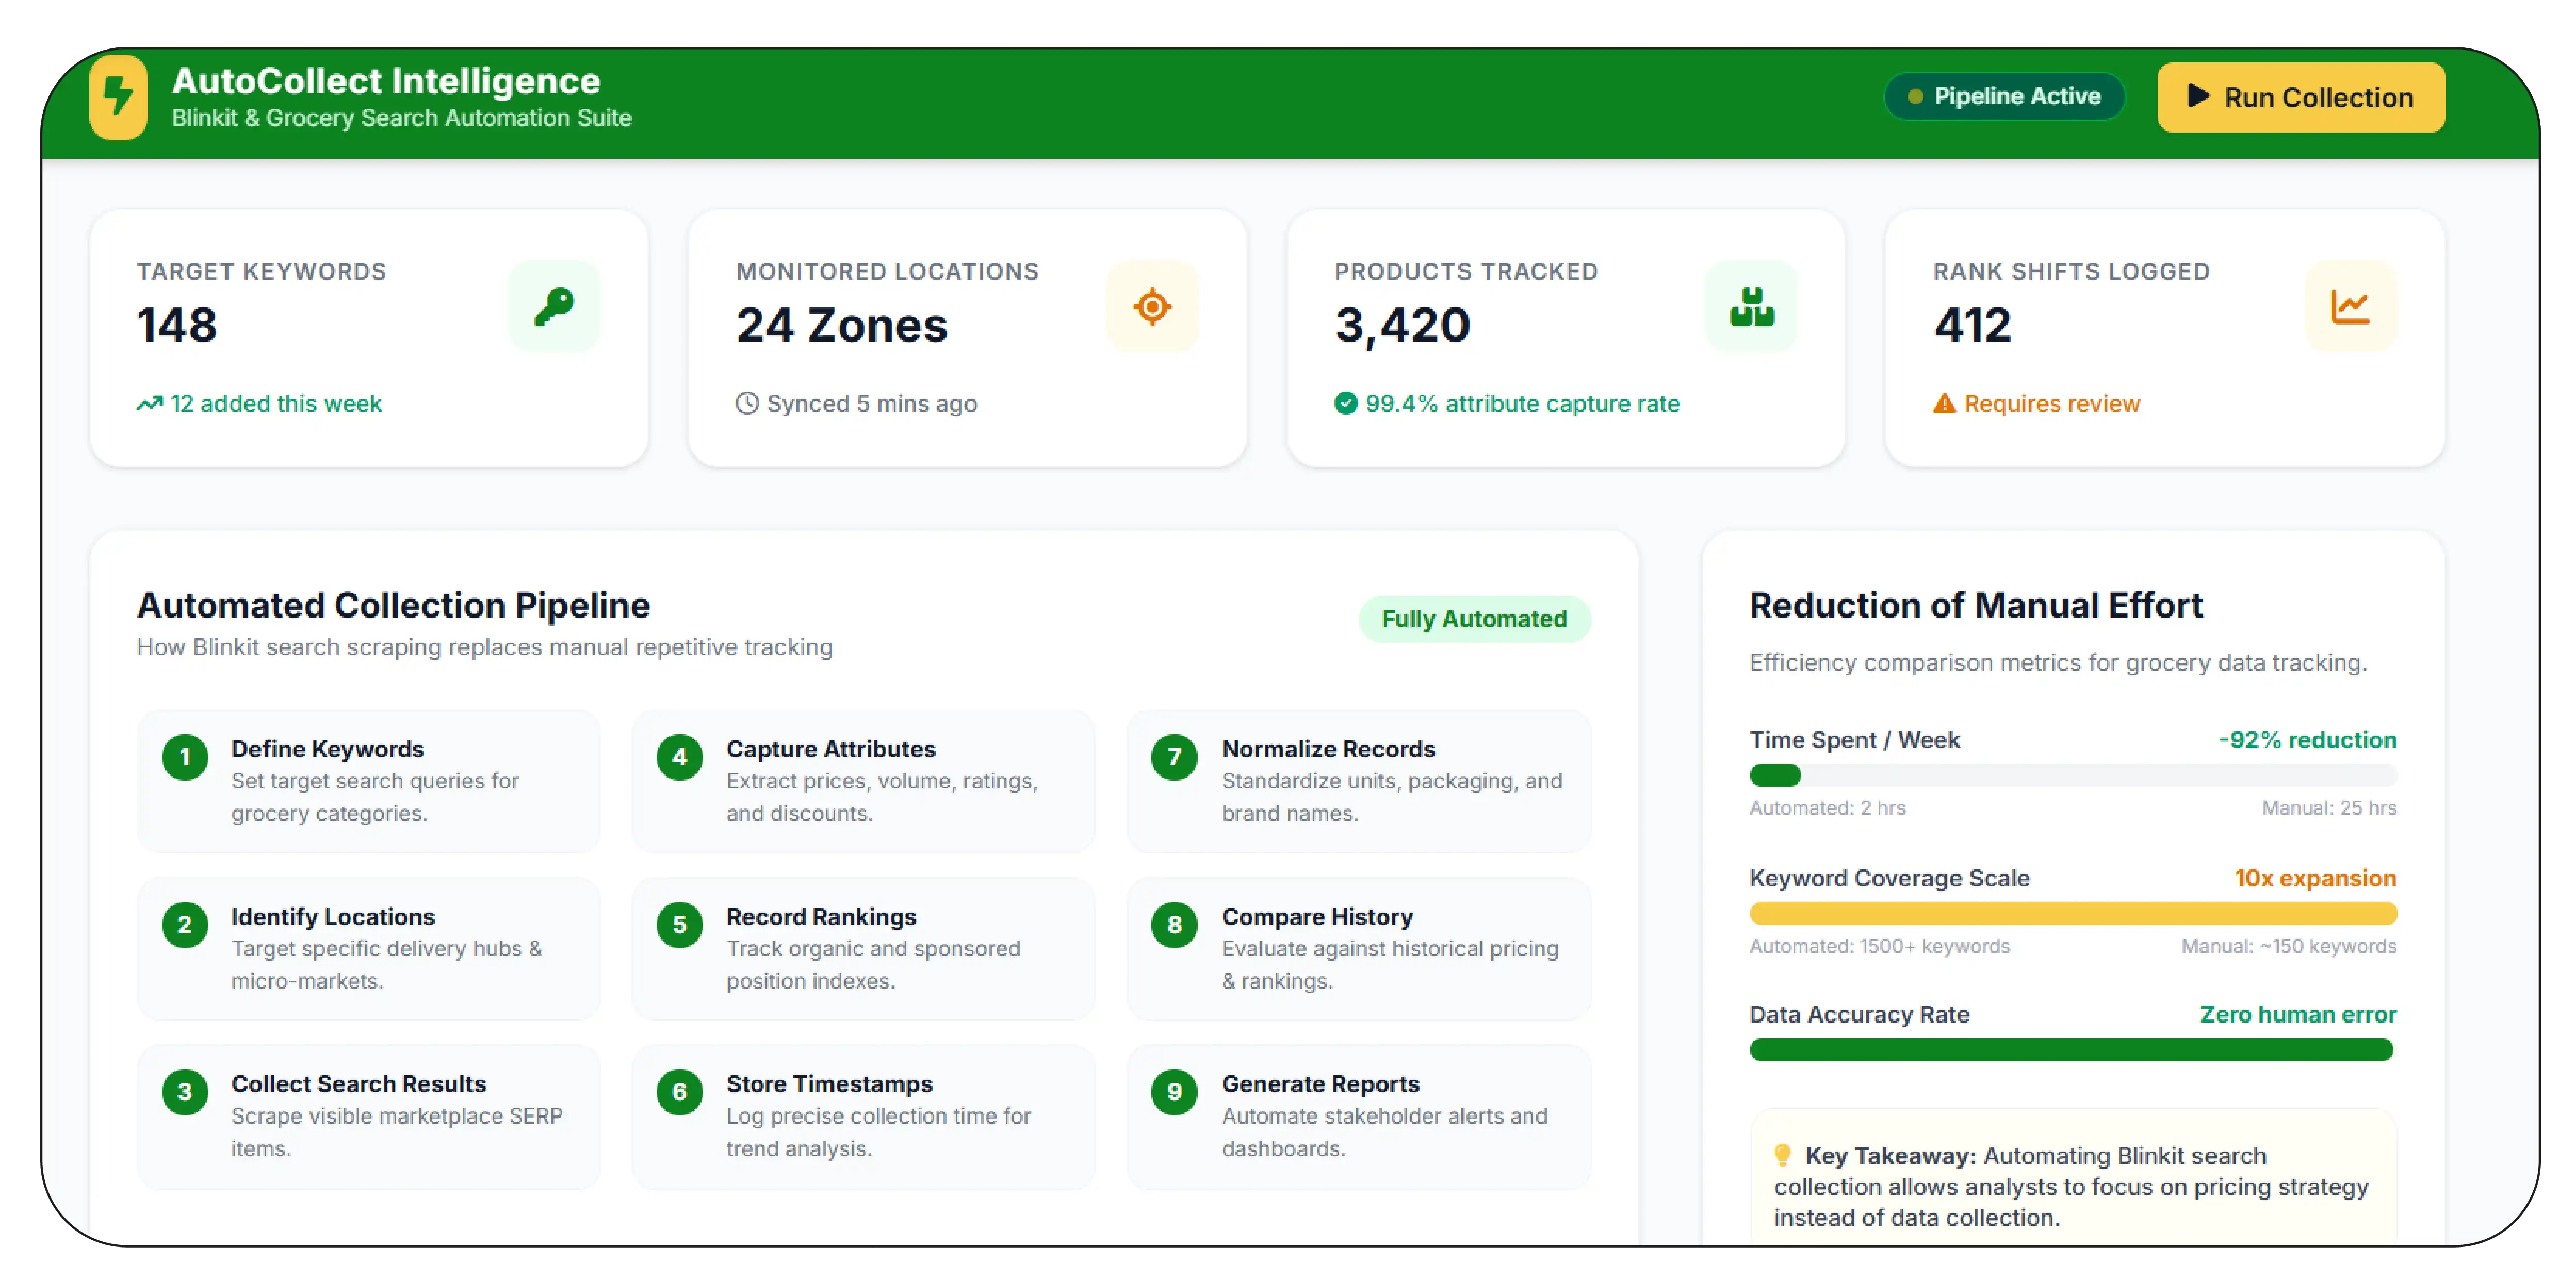
An automated workflow can follow several steps:
- Define target keywords.
- Identify monitored locations.
- Collect search-result information.
- Capture product attributes.
- Record ranking positions.
- Store timestamps.
- Normalize product records.
- Compare new results with historical data.
- Generate alerts or reports.
Illustrative Automation Scale (2020–2026)
| Year |
Illustrative Keywords |
Automated Checks/Month |
Manual Hours Potentially Replaced* |
| 2020 |
100 |
1,000 |
30 |
| 2021 |
180 |
2,000 |
60 |
| 2022 |
300 |
5,000 |
120 |
| 2023 |
500 |
10,000 |
250 |
| 2024 |
800 |
20,000 |
500 |
| 2025 |
1,200 |
40,000 |
900 |
| 2026 |
1,800+ |
75,000+ |
1,500+ |
*Illustrative estimates only. Actual savings depend on workflow design and manual processes.
Automation provides consistency. Every collection cycle can follow the same schema.
It also creates timestamps. This is important because search rankings can change quickly.
A monitoring system can flag significant changes. For example, a product moving from position 3 to position 15 could trigger an alert.
The same system can flag availability changes or new competitor products.
Data validation should also be part of the workflow. Duplicate products, incomplete records, and inconsistent product names can reduce analytical accuracy.
Normalization helps create cleaner comparisons.
The biggest advantage is scale. A team can monitor hundreds or thousands of keywords without manually checking each search result.
This allows analysts to focus on interpreting the data rather than collecting it.
How Can Brands Measure Their Digital Shelf Performance?
Digital shelf performance extends beyond search rank. It includes product visibility, content quality, availability, pricing, promotions, ratings, and competitive positioning.
Blinkit digital shelf data extraction can help businesses build a structured view of these elements.
A digital shelf dataset can connect product content with search and marketplace performance.
For example:
Brand → Product → Keyword → Rank → Price → Discount → Availability → Rating → Location → Timestamp
This structure supports deeper analysis.
Illustrative Digital Shelf Monitoring Scale (2020–2026)
| Year |
Illustrative Products |
Attributes Tracked |
Monitoring Scope |
| 2020 |
500 |
8 |
Product basics |
| 2021 |
800 |
10 |
Content and pricing |
| 2022 |
1,200 |
12 |
Availability |
| 2023 |
2,000 |
14 |
Search visibility |
| 2024 |
3,000 |
16 |
Competitive analysis |
| 2025 |
5,000 |
18 |
Digital shelf intelligence |
| 2026 |
7,500+ |
20+ |
End-to-end monitoring |
These are illustrative figures.
Digital shelf analysis can identify content gaps. A product may have incomplete descriptions, inconsistent pack-size information, or missing attributes.
It can also identify assortment gaps. A competitor may offer multiple organic variants while another brand offers only one.
Price positioning can be measured alongside rank. This helps teams understand whether higher visibility is associated with competitive pricing or strong product content.
Availability remains critical.
A product cannot convert demand if it is frequently unavailable. Location-level monitoring can help brands identify areas where products need stronger inventory support.
Ratings and reviews can add customer context. A highly ranked product with weak ratings may require a different strategy from a highly ranked product with strong customer feedback.
The digital shelf approach therefore combines several signals into one framework.
For organic grocery brands, this can help identify which products need better content, stronger availability, competitive pricing, or greater search visibility.
The result is a more complete view of online marketplace performance.
Why Should Businesses Choose a Specialized Data Partner?
Marketplace data needs consistency, scale, and reliable processing. A specialized data partner can automate collection and structure the resulting information for business analysis.
Share of search tracking helps brands understand how frequently their products appear within monitored search results compared with competitors.
A centralized Blinkit Keyword and Dark Store Search Rank Data solution can connect keyword rankings with product, location, and dark-store signals.
Key advantages include:
- Scalable monitoring: Track large keyword and SKU sets.
- Location-level analysis: Compare visibility across monitored areas.
- Historical records: Measure ranking changes over time.
- Structured datasets: Standardize product and search information.
- Automated collection: Reduce repetitive manual research.
- Competitive insights: Identify competitor ranking movements.
- Custom reporting: Prepare datasets for dashboards and analytics.
The approach can start with organic grocery keywords and later expand to snacks, beverages, personal care, household products, and other FMCG categories.
Businesses can also customize monitoring around selected cities, product groups, keywords, and dark stores.
This flexibility helps teams create a monitoring framework aligned with their marketplace strategy.
Conclusion
Organic grocery brands need visibility into more than product prices. Search position, product content, inventory, ratings, promotions, and local availability all influence digital shelf performance.
Quick Commerce intelligence brings these signals together and helps businesses understand how products perform across search and fulfillment environments.
A structured Blinkit Keyword and Dark Store Search Rank Data solution can reveal ranking movements, competitor visibility, location-level differences, and product availability patterns.
Historical monitoring makes these insights more useful. Teams can measure improvements, identify ranking losses, detect inventory gaps, and evaluate competitor movements.
The result is a stronger data foundation for marketplace optimization.
Partner with Product Data Scrape to build a customized Blinkit search-rank and dark-store data solution for keyword tracking, organic grocery visibility, competitive analysis, and digital shelf intelligence!
FAQs
1. What is Blinkit keyword rank data?
Blinkit keyword rank data records product positions for selected search terms. Brands can use it to measure visibility, compare competitors, and identify ranking changes across monitored searches.
2. Why is dark-store data important for grocery brands?
Dark-store data connects product visibility with local availability. It helps brands identify locations where products rank well, remain unavailable, or show different marketplace performance.
3. Can search rankings be tracked historically?
Yes. Recurring data collection can store keyword positions with timestamps. Brands can then compare ranking movements across days, weeks, months, locations, and product categories.
4. What products can be monitored on Blinkit?
Businesses can monitor organic groceries, packaged foods, beverages, personal care products, household goods, snacks, and other publicly listed categories based on their specific requirements.
5. Can Product Data Scrape create custom Blinkit datasets?
Yes. Product Data Scrape can create custom datasets covering keywords, product rankings, dark-store availability, prices, product attributes, locations, competitors, and collection schedules.


 Singapore
 EMAIL
EMAIL
 PHONE
PHONE















.webp)






