Introduction
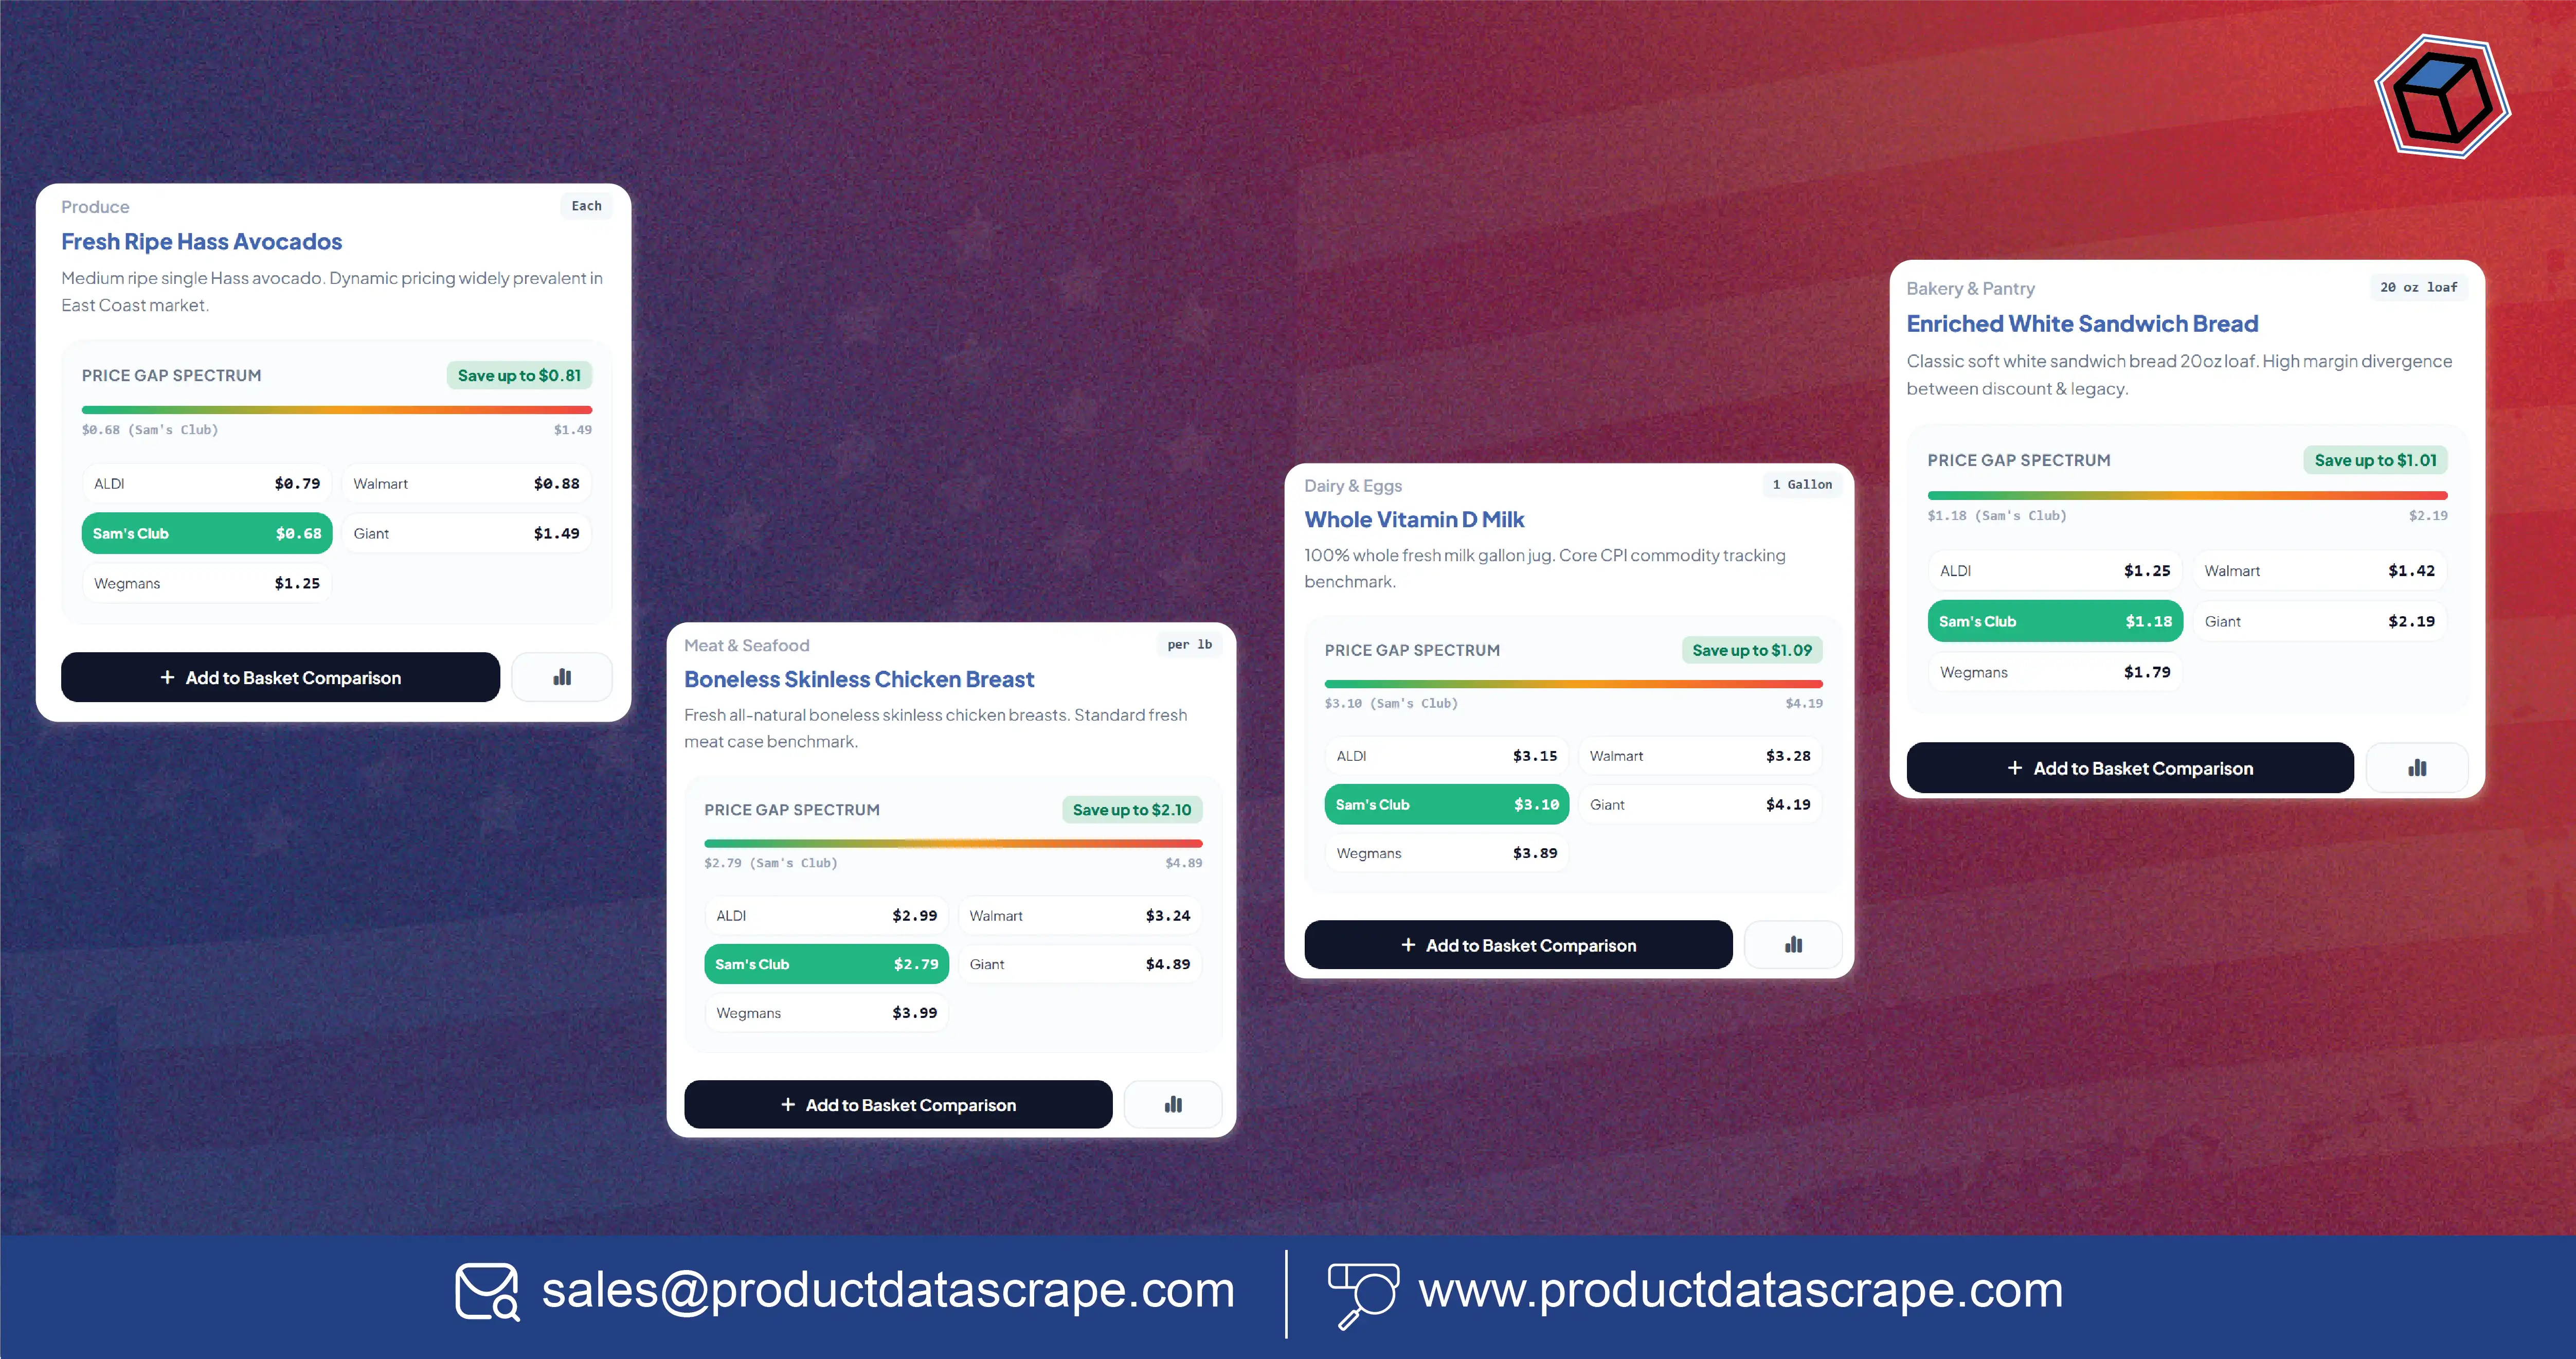
US Grocery Price Intelligence 2026 helps retailers, FMCG brands, pricing teams, and e-commerce analysts monitor price changes, discounts, assortment, and competitive movements across major grocery retailers. For businesses comparing Wegmans, Walmart, Giant, ALDI & Sam's Club, structured product-level data can reveal where prices differ, how promotions change, and which categories require closer monitoring.
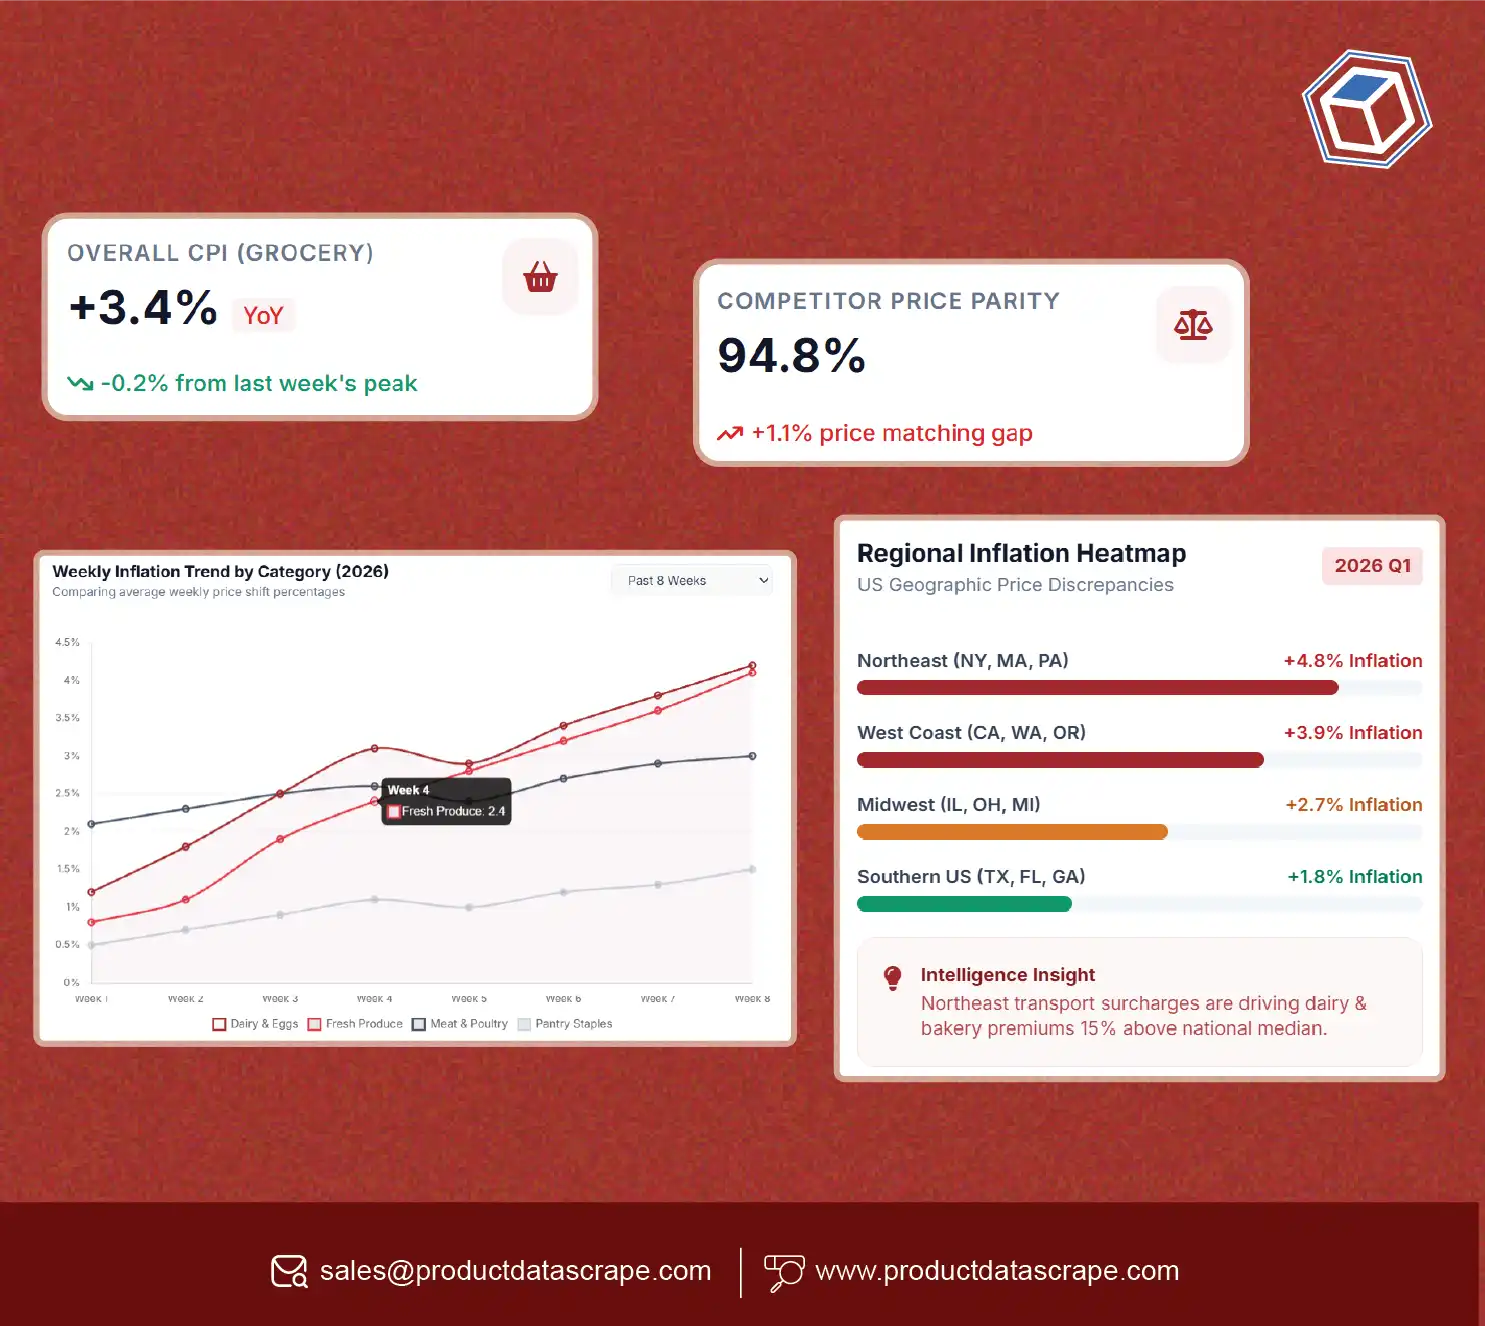
The core problem is simple: grocery prices do not move uniformly. USDA data shows U.S. food-at-home prices increased 2.3% in 2025, while individual categories moved very differently. Eggs increased 21.9%, beef and veal rose 11.6%, while fats and oils and fresh vegetables declined. (Economic Research Service)
A Grocery Price Comparison App can make these changes easier to visualize, but the quality of its insights depends on the underlying data. A reliable dataset should capture product names, SKUs, brands, pack sizes, prices, promotions, availability, categories, and timestamps.
This report explains how recurring grocery data collection can help businesses create comparable pricing benchmarks, identify price gaps, monitor promotional activity, and understand retail pricing changes from 2020 through 2026.
How Can Retailers Compare Grocery Prices Across Major Chains?
Wegmans Walmart Giant ALDI Grocery Price Comparison requires standardized product data because retailers use different product names, package sizes, private labels, promotions, and merchandising structures.
A meaningful comparison should normalize products before calculating price differences. For example, comparing a 12-ounce branded product with a 16-ounce private-label alternative using only the shelf price can produce a misleading result. Unit price, package size, brand, product type, and promotional status should be considered together.
Wegmans operates 114 stores across nine states and Washington, D.C., according to its 2025 Impact Report. Giant Food's store directory currently lists locations across Washington, D.C., Delaware, Maryland, and Virginia. (Wegmans)
Grocery Pricing Benchmark
| Data Point |
Why It Matters |
| Product name |
Identifies the item |
| Brand |
Enables brand-level comparison |
| SKU/product ID |
Supports product matching |
| Pack size |
Enables unit-price normalization |
| Current price |
Establishes price benchmark |
| Promotional price |
Measures discount impact |
| Regular price |
Provides baseline |
| Availability |
Adds stock context |
| Store/location |
Supports geographic analysis |
| Timestamp |
Enables historical tracking |
The comparison becomes more valuable when collected repeatedly. A one-time price snapshot tells a business what a product costs today. A six-month dataset can show whether a retailer regularly discounts the product, whether the price moves seasonally, and whether competitors respond to those changes.
2020–2026 Market Development
The 2020–2026 period provides a useful pricing benchmark because grocery inflation experienced unusually large movements. USDA reported that food-at-home prices were already 4.6% higher in August 2020 than a year earlier, reflecting pandemic-related supply-chain disruption. (Economic Research Service)
Food-at-home inflation then accelerated substantially. USDA reports that food-at-home prices increased 11.4% in 2022, followed by 5.0% in 2023, 1.2% in 2024, and 2.3% in 2025. (Economic Research Service)
For pricing teams, this historical movement demonstrates why current prices need context. A product appearing expensive in 2026 may simply reflect category-wide inflation, while another product may have increased substantially more than its category benchmark.
A recurring retailer dataset can therefore support normalized comparisons across brands, pack sizes, stores, and periods.
How Can Businesses Monitor Club and Discount Grocery Pricing?
Businesses can Scrape Sam's Club Grocery Prices to monitor grocery prices across club-format assortments, while Extract ALDI US Data workflows can capture product-level information from a retailer with a strong value-oriented positioning.
Sam's Club is particularly relevant because grocery represents a substantial component of its U.S. business. Walmart's fiscal 2026 annual report shows Sam's Club U.S. grocery sales of $64.706 billion, compared with $61.253 billion in fiscal 2025 and $57.565 billion in fiscal 2024. (Walmart Inc.)
This makes grocery price monitoring across club retailers useful for brands that sell large-format products, multipacks, private-label alternatives, and household consumables.
ALDI is also expanding its U.S. footprint. In February 2025, ALDI announced plans to open more than 225 new stores during 2025 and said its U.S. store count had surpassed 2,400 after nearly 120 openings in 2024. (ALDI)
What Should Be Collected?
| Field |
Example Purpose |
| Product title |
Product identification |
| Brand |
Brand benchmarking |
| Pack configuration |
Apples-to-apples comparison |
| Regular price |
Baseline |
| Sale price |
Promotion measurement |
| Unit price |
Normalized comparison |
| Availability |
Stock monitoring |
| Category |
Category benchmarking |
| Product URL |
Source traceability |
| Collection time |
Historical analysis |
A useful dataset should also preserve historical observations rather than overwrite previous prices. This allows analysts to calculate price changes, promotional frequency, average selling price, and competitor price gaps.
2020–2026 Market Development
The period following 2020 saw consumers become more attentive to grocery prices as inflation affected household budgets. USDA data shows food-at-home inflation reached 11.4% in 2022, the highest annual rate in the period covered by its current Food Price Outlook summary. (Economic Research Service)
As inflation moderated in 2023–2025, the need for price comparison did not disappear. Instead, the analytical question shifted from broad inflation toward retailer-level differences.
Club retailers also provide a different comparison framework because package sizes and multipacks can make headline prices appear higher even when unit economics are competitive. ALDI's expanding footprint adds another important benchmark for value-oriented grocery pricing.
For brands, the solution is to compare normalized product data rather than simply collecting displayed prices. Price-per-ounce, price-per-unit, package count, promotion status, and product equivalence can make the resulting analysis substantially more useful.
What Does Real-Time Grocery Pricing Intelligence Reveal?
US ALDI Grocery Pricing Intelligence can help businesses monitor changes in product prices, discounts, availability, and assortment at a retailer and category level.
The objective is not merely to collect more prices. The objective is to identify meaningful changes quickly enough for pricing, merchandising, and competitive-intelligence teams to respond appropriately.
Real-time price tracking can be designed around different collection frequencies. High-volatility categories may require more frequent monitoring, while stable categories can be checked less frequently.
Pricing Monitoring Model
| Monitoring Level |
Typical Use |
| Daily |
Promotional and volatile categories |
| Several times weekly |
Active competitive monitoring |
| Weekly |
Standard grocery benchmarking |
| Monthly |
Market research and historical analysis |
| Campaign-based |
Holiday and promotional events |
USDA's Food-at-Home Monthly Area Prices dataset illustrates why geographic granularity matters. The dataset provides monthly food-price information for 90 food-at-home categories across 15 U.S. geographic areas. (Economic Research Service)
Retail-level intelligence can complement this broader market information by showing how individual retailers price comparable products.
2020–2026 Market Development
U.S. grocery prices experienced significant volatility between 2020 and 2023. USDA attributes the 2022 food-price surge to factors including supply-chain pressures, animal disease, energy costs, and broader inflationary conditions. (Economic Research Service)
By 2024 and 2025, annual food-price growth had moderated considerably. Food-at-home prices increased 1.2% in 2024 and 2.3% in 2025. (Economic Research Service)
The 2026 environment remains category-specific. USDA's August 2026 outlook forecasts food-at-home prices to rise 2.5% for the year. Its July 2026 data showed food-at-home prices 2.7% above July 2025. (Economic Research Service)
This variation makes real-time monitoring valuable. A retailer may experience a category-specific increase even while overall grocery inflation remains moderate. Continuous data can isolate those movements and provide a more detailed competitive picture.
How Can Historical Grocery Data Improve Pricing Decisions?
Wegmans Grocery Pricing Intelligence can help brands analyze a regional retailer's product pricing, promotions, assortment, and geographic patterns. This becomes particularly useful when combined with Grocery Datasets covering multiple retailers and historical periods.
Wegmans' current footprint spans nine states and Washington, D.C., with 114 stores reported in its 2025 Impact Report. The company also works with approximately 400 family farms and local suppliers, highlighting the regional dimensions that can influence assortment. (Wegmans)
Historical Dataset Structure
| Dimension |
Historical Question |
| Price |
How much has the product changed? |
| Discount |
How frequently is it promoted? |
| Assortment |
Is the product consistently listed? |
| Availability |
Are stock gaps recurring? |
| Location |
Do prices vary geographically? |
| Category |
Which categories move most? |
| Brand |
How does positioning change? |
Historical data enables businesses to distinguish one-time anomalies from recurring patterns.
2020–2026 Market Development
USDA's historical food-price data demonstrates the importance of long-term benchmarking. Food-at-home prices increased 3.5% in 2020, accelerated to 11.4% in 2022, then slowed to 5.0% in 2023, 1.2% in 2024, and 2.3% in 2025. (Economic Research Service)
A six-year retailer dataset can put individual product movements into that broader context. For example, if a cereal product increases 8% while the broader cereal and bakery category rises only 1%, the product-level movement warrants closer examination.
USDA reported that cereal and bakery prices increased 1.0% in 2025, while beef and veal rose 11.6%. (Economic Research Service) This illustrates why category-level averages should not replace SKU-level monitoring.
Historical grocery datasets can also help businesses identify seasonal pricing cycles, promotional calendars, private-label competition, geographic differences, and assortment changes.
How Can SKU-Level Monitoring Improve Competitive Visibility?
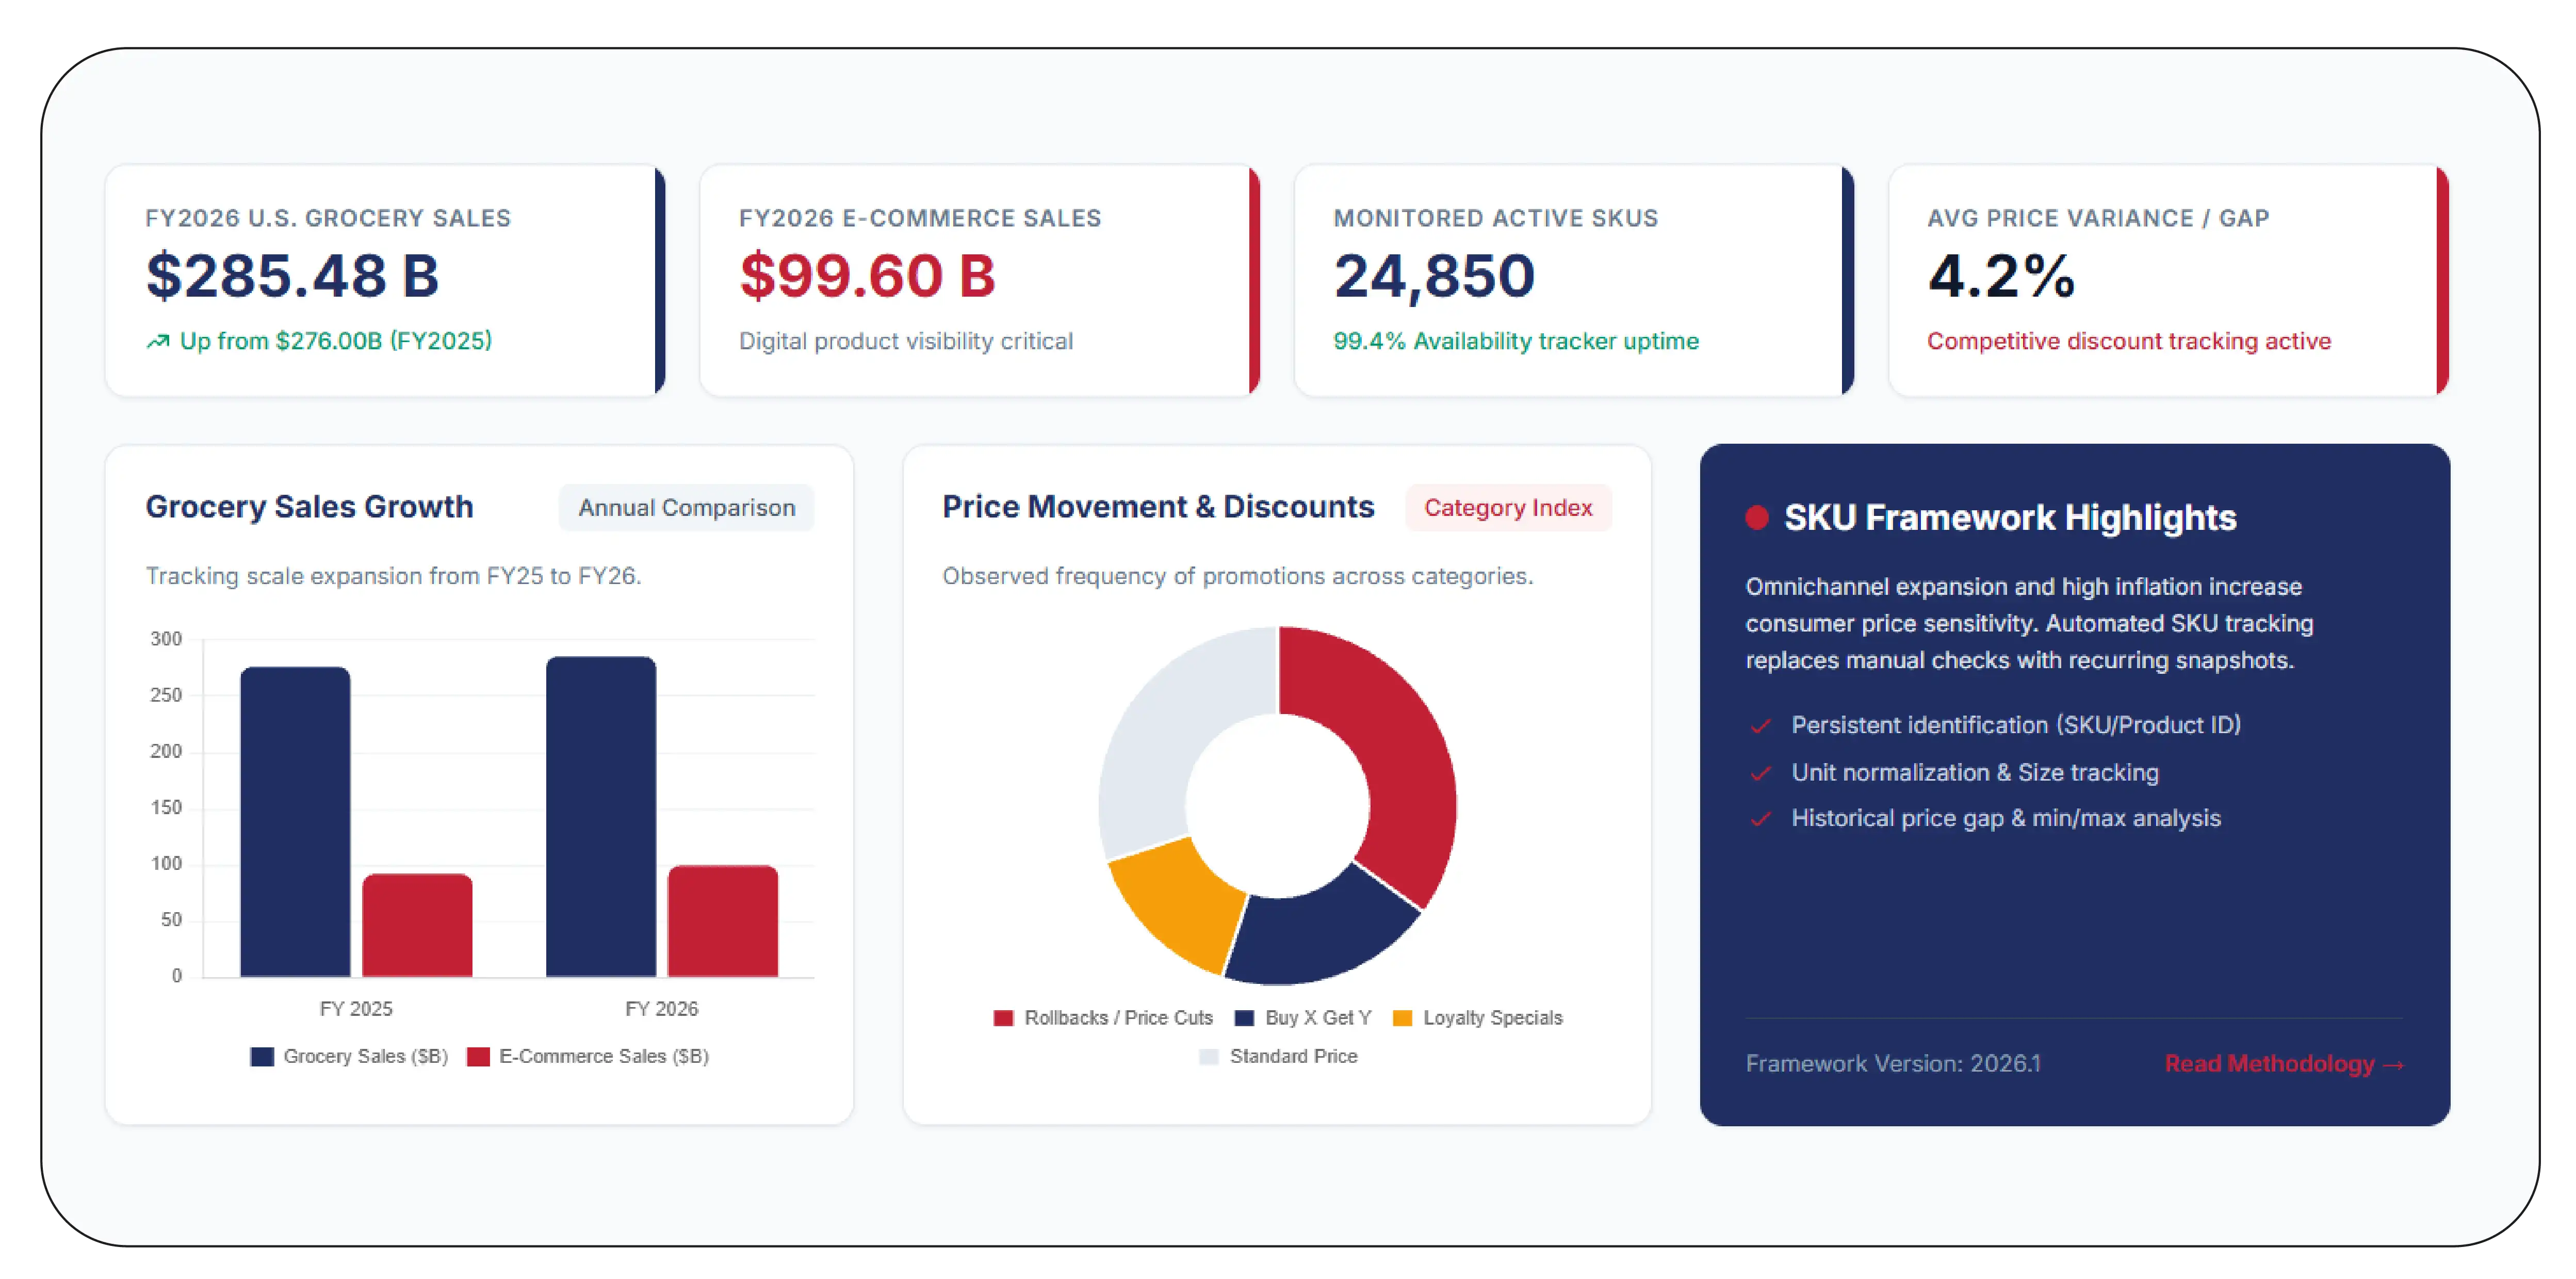
Walmart SKU Grocery Price Data Tracking provides a way to monitor product-level pricing at scale. Walmart is particularly important for grocery intelligence because its U.S. grocery business is substantial: Walmart U.S. reported $285.482 billion in grocery sales for fiscal 2026, up from $276.003 billion in fiscal 2025. (Walmart Inc.)
Walmart U.S. also reported approximately $99.6 billion in e-commerce sales for fiscal 2026, demonstrating the importance of digital product visibility within its overall U.S. retail business. (Walmart Inc.)
SKU Tracking Framework
| SKU Attribute |
Monitoring Objective |
| SKU/Product ID |
Persistent identification |
| Product name |
Listing changes |
| Brand |
Competitive positioning |
| Size |
Unit normalization |
| Price |
Price movement |
| Discount |
Promotion tracking |
| Availability |
Stock visibility |
| Category |
Market segmentation |
| Timestamp |
Historical comparison |
2020–2026 Market Development
SKU-level grocery monitoring became increasingly relevant as retailers expanded omnichannel capabilities. The shift toward online grocery made product information more visible and more comparable, while inflation increased consumer sensitivity to price.
Walmart's fiscal 2026 results show the scale of its grocery category and digital business. Grocery sales reached $285.5 billion in Walmart U.S., while e-commerce sales reached approximately $99.6 billion. (Walmart Inc.)
This scale creates a large volume of products and price observations. Manual monitoring of thousands of SKUs can quickly become inefficient, especially when businesses need historical comparisons across multiple retailers.
A structured SKU-monitoring workflow can instead create recurring snapshots. Analysts can calculate minimum and maximum observed prices, average prices, discount frequency, price gaps, and category-level changes.
The same approach can be extended across other retailers, creating a consistent competitive dataset that supports pricing teams, category managers, marketplace teams, and consumer brands.
How Can Businesses Benchmark Prices Across the U.S.?
Grocery Price Comparison Across US Retailers requires more than putting retailer prices into a spreadsheet. Product equivalence, pack size, geographic availability, promotions, membership requirements, and private-label differences must be addressed before the data can support reliable comparisons.
USDA's Food-at-Home Monthly Area Prices data provides a useful macro-level benchmark because it covers 90 food-at-home categories across 15 geographic areas. (Economic Research Service) Retailer-level datasets can then provide a more granular layer for individual products and stores.
Cross-Retailer Benchmarking
| Benchmark |
Business Question |
| Average price |
What is the market-level price? |
| Lowest price |
Where is the lowest observed price? |
| Price spread |
How large is the competitive gap? |
| Unit price |
Which offer is cheaper after normalization? |
| Discount rate |
Which retailer promotes more frequently? |
| Availability |
Is the price consistently actionable? |
| Geographic variation |
Does price differ by market? |
2020–2026 Market Development
The 2020–2026 period demonstrates why cross-retailer comparisons need historical context. Food-at-home inflation accelerated during the pandemic period and peaked at 11.4% in 2022 before moderating. (Economic Research Service)
By 2025, food-at-home prices were 2.3% higher than in 2024, below the 20-year historical average annual increase of 2.6%. However, category movements remained uneven. Eggs rose 21.9%, beef and veal 11.6%, while fresh vegetables declined 0.4%. (Economic Research Service)
For retailers and brands, this means a single national inflation figure is not sufficient for competitive pricing decisions. Category, product, geography, and retailer all matter.
A cross-retailer dataset can help identify where prices diverge and whether those differences are persistent. It can also reveal when a retailer's discount brings its effective price below competitors or when a promotional price merely matches the prevailing market range.
Why Choose Product Data Scrape?
A reliable grocery intelligence program needs consistent collection, product matching, normalization, validation, and historical storage. Product-level data can be structured around SKU, brand, category, pack size, price, promotion, availability, and retailer location.
Wegmans NY Grocery Product Data Intelligence can support regional benchmarking, while multi-retailer datasets can provide broader competitive context. Walmart's scale, Wegmans' regional footprint, Sam's Club's membership model, ALDI's expanding store network, and Giant's regional presence create different pricing environments that benefit from standardized monitoring. (Walmart Inc.)
For pricing teams, the practical value comes from turning repeated observations into usable metrics: price indices, price gaps, promotional frequency, unit-price comparisons, and historical trends.
The workflow can include source mapping, automated collection, product matching, data validation, duplicate removal, historical snapshots, and structured delivery for dashboards or analytics systems.
Conclusion
Walmart E-commerce Product Dataset information can provide an important component of broader grocery pricing analysis because Walmart operates at substantial scale across physical and digital retail. Its fiscal 2026 filing reported $285.5 billion in Walmart U.S. grocery sales and approximately $99.6 billion in U.S. e-commerce sales. (Walmart Inc.)
The broader US Grocery Price Intelligence 2026 landscape requires continuous monitoring because inflation, promotions, assortment, geography, and retailer strategy can all influence observed prices. USDA's 2026 outlook forecasts food-at-home prices to rise 2.5% for the year, while July 2026 food-at-home prices were 2.7% above July 2025. (Economic Research Service)
For brands, retailers, and pricing teams, the goal is to convert fragmented grocery listings into structured competitive intelligence.
Partner with Product Data Scrape to build scalable grocery price datasets, monitor retailer movements, and turn SKU-level market data into actionable pricing intelligence!
FAQs
1. What is grocery price intelligence?
Grocery price intelligence is the structured collection and analysis of retailer prices, discounts, assortment, availability, pack sizes, and historical changes to understand competitive pricing across markets and categories.
2. Why compare multiple grocery retailers?
Comparing multiple retailers helps businesses identify price gaps, promotional patterns, assortment differences, geographic variation, and changing competitive positions across comparable grocery products and categories.
3. How often should grocery prices be monitored?
Monitoring frequency depends on category volatility and business requirements. Daily or weekly collection works for active pricing intelligence, while monthly collection suits broader market research.
4. Can Product Data Scrape provide customized grocery datasets?
Yes. Product Data Scrape can support customized datasets structured around retailers, categories, brands, SKUs, prices, promotions, availability, locations, and other publicly accessible product attributes.
5. What can businesses do with historical grocery pricing?
Historical pricing can help businesses identify inflation effects, seasonal patterns, promotional cycles, competitor price gaps, assortment changes, and product-level pricing movements over extended periods.


 Singapore
 EMAIL
EMAIL
 PHONE
PHONE


.webp "thumb")













.webp)






