Introduction
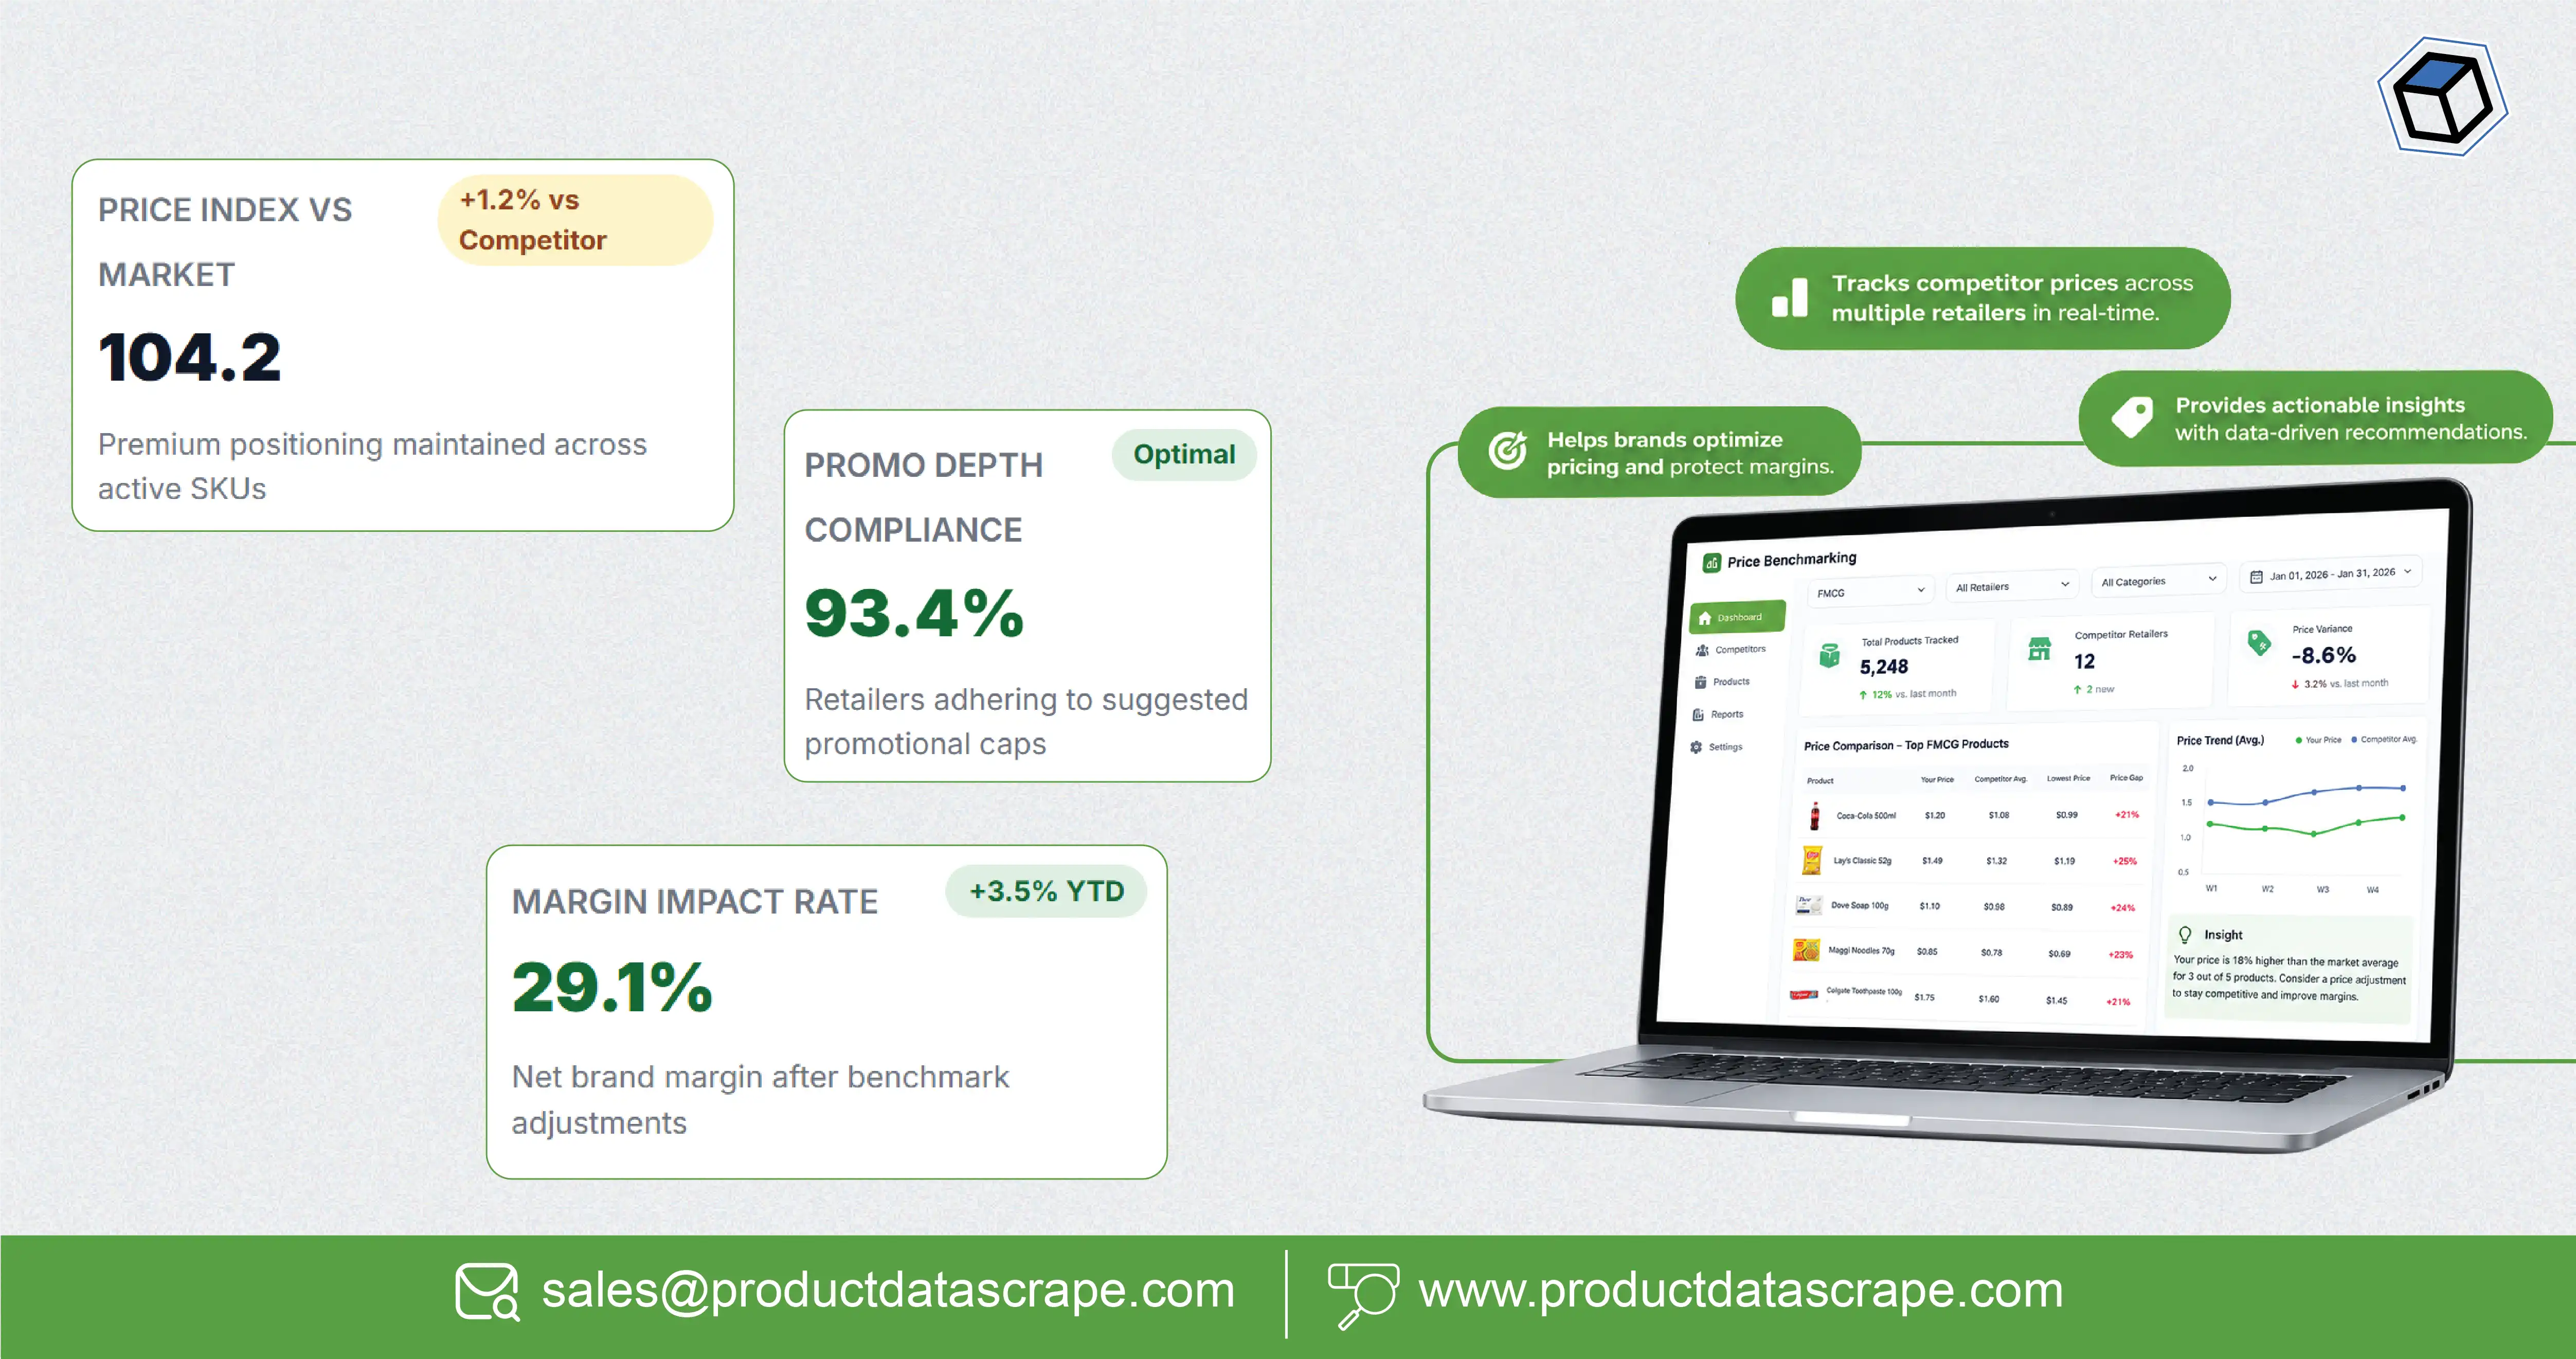
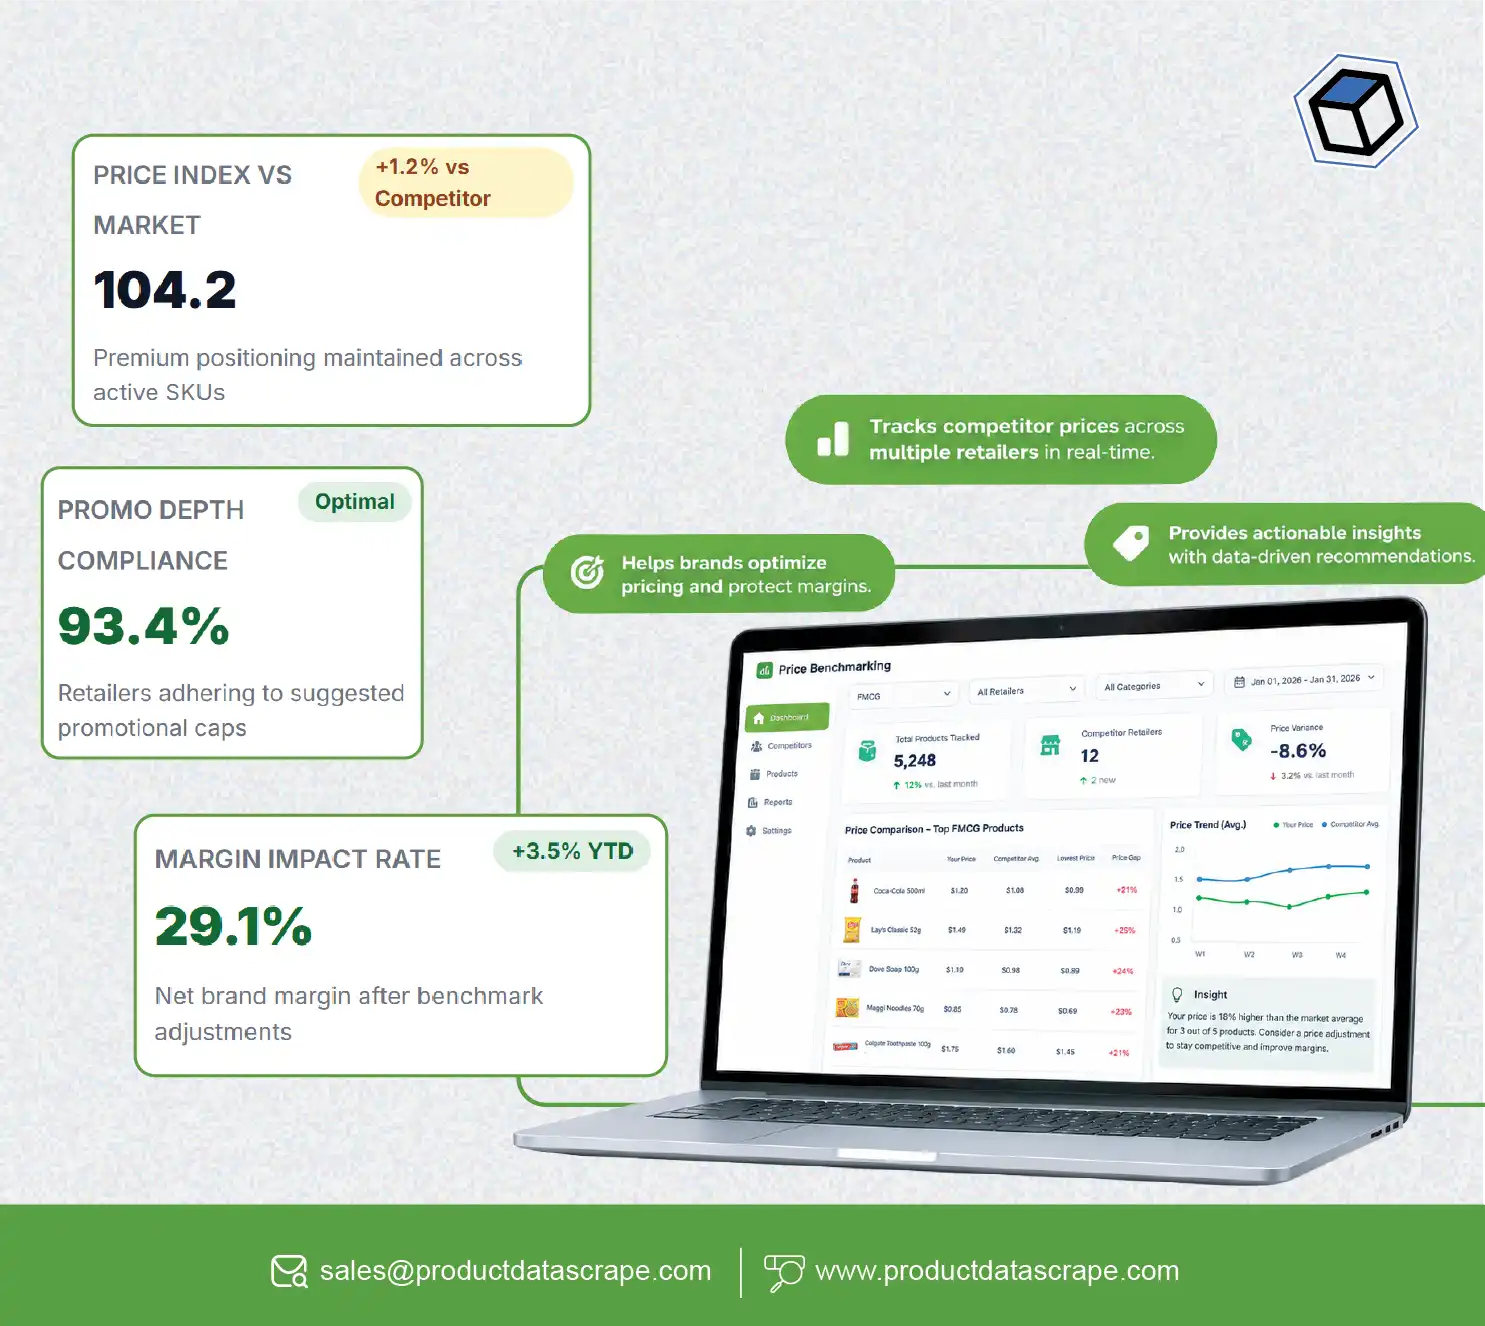
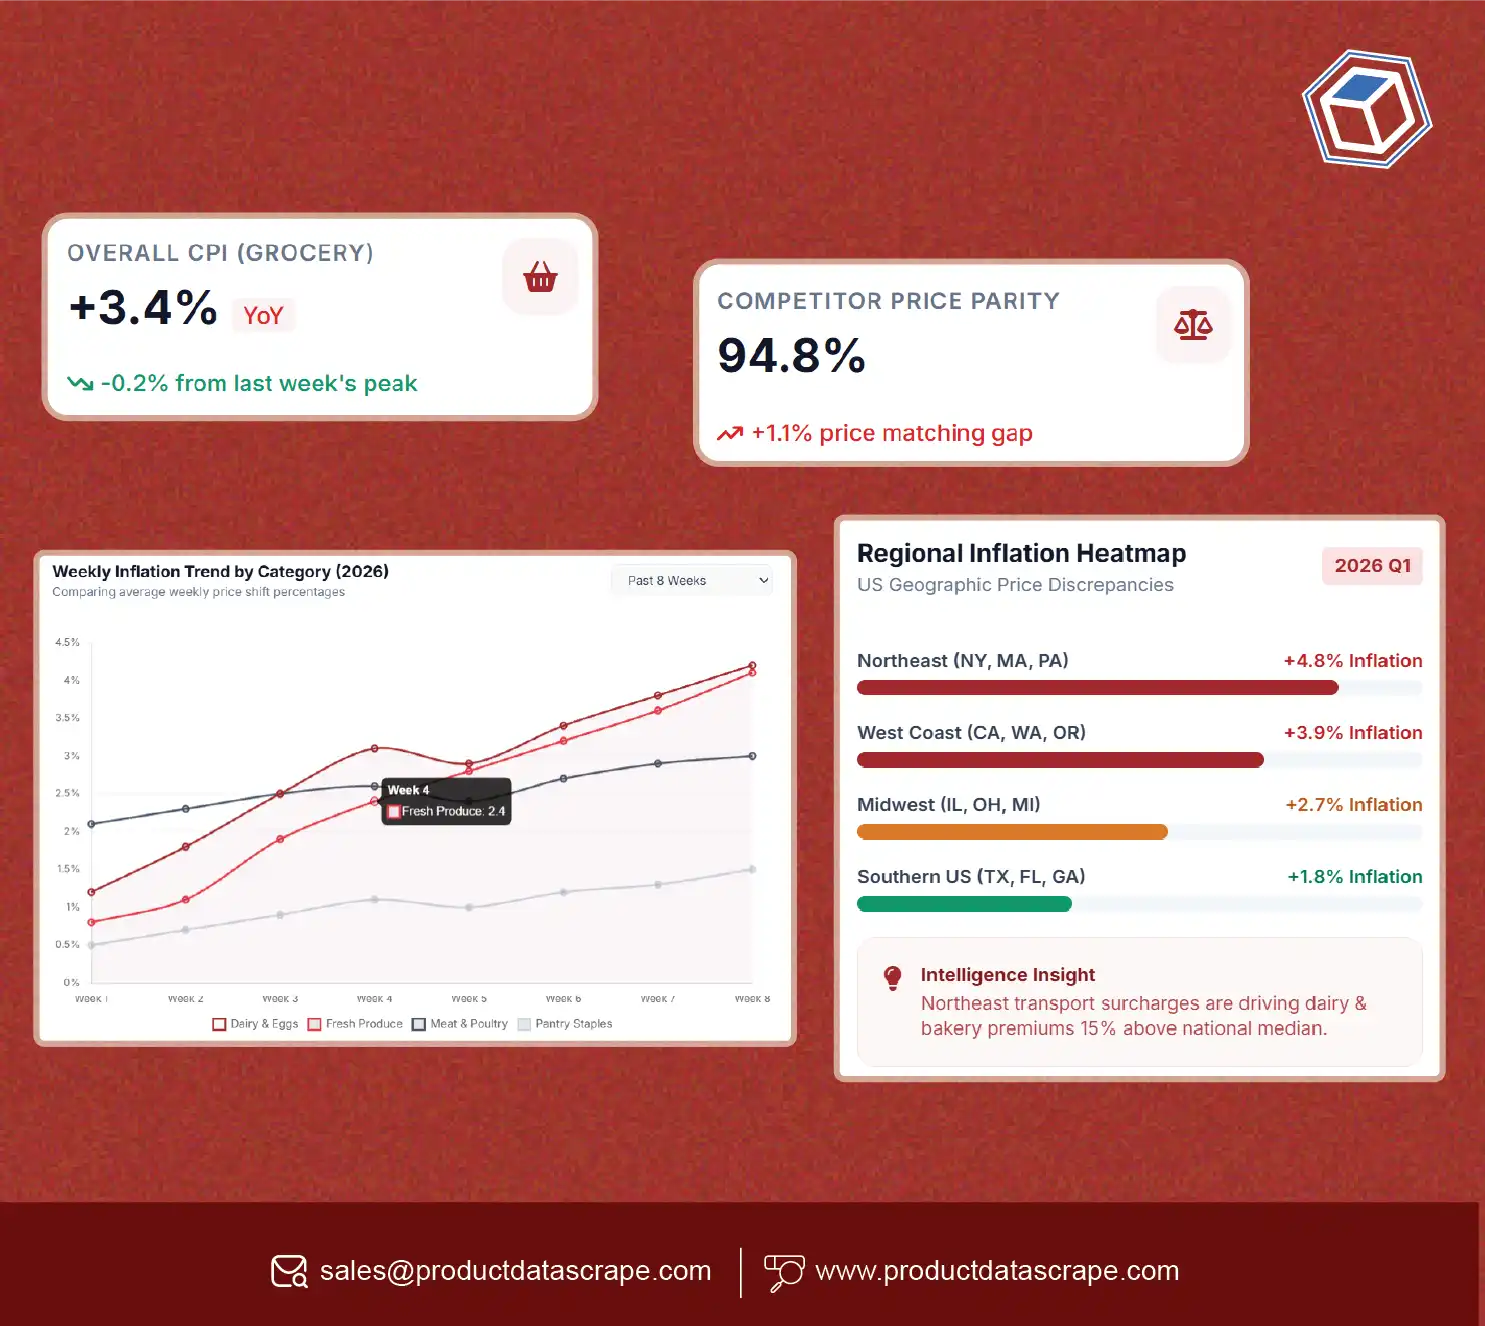
FMCG brands can improve pricing decisions by continuously comparing competitor prices, promotions, pack sizes, availability, and retailer-level differences instead of relying on occasional manual checks. A Price benchmarking tool custom retail fmcg 2026 turns fragmented retail data into structured intelligence that pricing, category, sales, and revenue teams can use to respond faster.
The need has become more important as grocery and consumer-goods shopping has moved across supermarkets, marketplaces, quick-commerce platforms, and direct-to-consumer channels. McKinsey reported that US grocery e-commerce penetration increased from 3.4% in 2019 to 5.5% in 2020 and 7.2% in 2023. (McKinsey & Company)
For FMCG companies, the challenge is no longer simply knowing whether a competitor is cheaper. Teams need to understand where, when, by how much, and against which comparable SKU a price difference occurs.
A modern benchmarking workflow can collect product-level information, normalize SKUs, identify comparable products, and track price movements across Quick commerce & FMCG data sources to produce retailer- or category-specific comparisons. This helps businesses detect pricing gaps, evaluate promotional intensity, protect margins, and support more informed pricing decisions.
How can brands make price comparisons more consistent across retailers?
Retail prices can change frequently because of promotions, regional strategies, inventory conditions, retailer positioning, and competitive activity. A structured monitoring system creates a consistent methodology for comparing these movements.
2020–2026 market progression
| Year |
Retail pricing and digital-commerce development |
Business implication |
| 2020 |
Grocery e-commerce accelerated sharply during the pandemic. |
Digital price visibility became more important. |
| 2021 |
Online grocery remained elevated as consumers continued using digital channels. |
Brands needed broader channel monitoring. |
| 2022 |
E-commerce became a more established part of grocery shopping. |
Omnichannel price comparison gained importance. |
| 2023 |
US online grocery spending reached a forecast 7.2% of grocery spending. (McKinsey & Company) |
Digital shelf data became increasingly useful. |
| 2024 |
Retailers continued balancing value, promotions, assortment, and profitability. |
Pricing teams needed faster competitive signals. |
| 2025 |
Delivery, marketplaces, and omnichannel shopping continued shaping grocery economics. |
Cross-channel comparisons became more complex. |
| 2026 |
Pricing teams increasingly require structured, automated, SKU-level intelligence. |
Custom benchmarking supports scalable monitoring. |
Build a consistent comparison framework
Retail Price Monitoring and Benchmarking works best when every product is evaluated using comparable attributes. These can include SKU, brand, product name, pack size, unit price, list price, promotional price, discount percentage, availability, retailer, geography, timestamp, and product URL.
For example, comparing a 500 ml branded beverage with a 750 ml competitor product using only headline prices can produce a misleading conclusion. A normalized dataset can calculate price per unit and create a more meaningful comparison.
Competitor price monitoring also becomes more actionable when historical observations are retained. A single price snapshot shows the current market. A time series shows whether a competitor consistently prices below the market, temporarily discounts a product, or changes its pricing around promotions.
This distinction matters for FMCG teams because promotional pricing should not automatically be treated as the competitor's everyday price. Historical observations allow analysts to separate baseline pricing from temporary events.
What should a customized pricing intelligence system capture?
A useful pricing system should be designed around the decisions the business needs to make rather than simply collecting the maximum amount of retail information.
2020–2026 development of pricing intelligence
| Period |
Data requirement |
Increasing business need |
| 2020 |
Basic product and price information |
Digital shelf visibility |
| 2021 |
Price plus promotions and availability |
Competitive response |
| 2022 |
Multi-retailer product comparisons |
Omnichannel analysis |
| 2023 |
Historical price tracking |
Trend identification |
| 2024 |
SKU normalization and unit-price comparison |
Better benchmarking |
| 2025 |
Geographic and channel segmentation |
Localized pricing decisions |
| 2026 |
Automated, scalable intelligence workflows |
Faster pricing actions |
Design the system around business questions
A Custom FMCG Price Intelligence Tool can be configured around specific categories, retailers, geographies, brands, and product attributes.
For an FMCG manufacturer, the system might monitor:
- Product and SKU identifiers
- Brand and sub-brand
- Category and subcategory
- Pack size and unit quantity
- Regular price
- Promotional price
- Discount percentage
- Price per unit
- Stock or availability status
- Retailer
- Store or geographic market
- Product URL
- Collection timestamp
- Promotion type, where available
The system can then transform raw observations into business metrics such as price index, average competitor price, minimum and maximum observed price, price gap, discount frequency, and retailer-level positioning.
The architecture should also support historical storage. This enables teams to answer questions such as: Did the competitor permanently lower its price? Was the reduction limited to one retailer? Did the price change coincide with a promotion? Is our price gap widening?
McKinsey research has highlighted the growing importance of e-commerce, product comparison, assortment, and personalized promotions in consumer shopping behavior. (McKinsey & Company)
A customized system therefore provides more value when it connects collection with normalization, historical analysis, and business reporting rather than functioning as a simple price feed.
How does product-level data improve competitive pricing decisions?
Price comparisons become substantially more useful when product information is collected alongside the price itself. This creates context around every pricing observation.
2020–2026 shift toward granular retail data
| Year |
Data maturity |
Pricing application |
| 2020 |
Product-page and price capture |
Basic digital monitoring |
| 2021 |
Product attributes added |
Better SKU matching |
| 2022 |
Multi-channel collection |
Channel comparison |
| 2023 |
Historical datasets |
Trend analysis |
| 2024 |
More structured attributes |
Product-level benchmarking |
| 2025 |
Greater segmentation |
Market-specific pricing |
| 2026 |
Automated enrichment and validation |
Scalable pricing intelligence |
Connect product identity with price movement
Retail Pricing Data for Competitor Analysis gives pricing teams the product-level context required to interpret market movements accurately.
Consider two toothpaste products priced at $4.99 and $5.49. Without pack size, formulation, brand tier, and promotional information, the difference may appear straightforward. Once those attributes are included, the comparison may show that the $5.49 product contains substantially more product or belongs to a premium segment.
This is where Product Data Scraping for Price Benchmarking becomes valuable. Structured collection can bring together product names, brands, variants, sizes, prices, discounts, ratings, availability, and other accessible attributes from selected retail sources.
The resulting dataset can support:
- SKU matching
- Brand-versus-brand comparisons
- Pack-size normalization
- Price-per-unit analysis
- Retailer price-gap calculations
- Promotion monitoring
- Category-level price indices
- Historical price-change analysis
- Assortment comparisons
Data validation is equally important for Assortment & SKU listing tracking. Duplicate products, changed URLs, missing prices, inconsistent units, and discontinued SKUs can distort analysis. A reliable workflow should therefore include normalization rules, validation checks, timestamping, and exception handling.
This approach allows commercial teams to move from "What is the competitor charging?" to "How does this comparable product's price position differ across retailers, locations, and time?"
How can FMCG brands compare their own prices against the market?
Brand-level benchmarking requires a different perspective from simple retailer comparison. The objective is to understand whether a brand's pricing position is consistent across comparable products and channels.
2020–2026 evolution of brand benchmarking
| Year |
Emerging requirement |
Example use |
| 2020 |
Brand price visibility |
Monitor online competitors |
| 2021 |
SKU-level comparisons |
Compare equivalent products |
| 2022 |
Promotional tracking |
Measure discount activity |
| 2023 |
Historical benchmarking |
Detect persistent gaps |
| 2024 |
Category segmentation |
Compare premium/value tiers |
| 2025 |
Geographic analysis |
Identify local differences |
| 2026 |
Automated benchmarking |
Support recurring commercial decisions |
Move from isolated prices to market position
A Brand-Level FMCG Price Benchmarking tool can calculate a brand's position against selected competitors without treating every product as directly comparable.
For example, a business could define peer groups based on brand, category, pack size, product format, and market positioning. It could then calculate a price index:
Price Index = Brand Price ÷ Comparable Market Average × 100
An index of 100 represents the selected market benchmark. Values above or below 100 indicate relative price positioning against that defined comparison group. The metric itself does not determine whether a position is appropriate; that depends on brand strategy, costs, category dynamics, and commercial objectives.
Historical data makes this more useful. A brand may discover that its price index changes significantly during promotions, while another competitor maintains a relatively stable position. These patterns can inform pricing reviews and promotional planning.
The same dataset can support retailer-specific views. A brand might have one price position on a supermarket website and another on a quick-commerce platform. Looking at both channels together provides a more complete picture of digital shelf positioning.
This is particularly relevant as online grocery has matured. McKinsey found that online grocery spending in the US remained above pre-pandemic levels in 2023, with e-commerce accounting for 7.2% of grocery spending. (McKinsey & Company)
Why does continuous monitoring matter for FMCG pricing?
Periodic research can identify broad market conditions, but recurring monitoring reveals the actual sequence of competitive price changes.
2020–2026 progression
| Period |
Monitoring approach |
Limitation addressed |
| 2020 |
Manual checks |
Slow data collection |
| 2021 |
Scheduled digital checks |
Greater frequency |
| 2022 |
Multi-retailer monitoring |
Channel fragmentation |
| 2023 |
Historical databases |
Lack of trend visibility |
| 2024 |
Automated alerts |
Delayed response |
| 2025 |
More granular segmentation |
Complex market structures |
| 2026 |
Continuous intelligence workflows |
Faster commercial analysis |
Turn recurring observations into actionable intelligence
Retail Price Intelligence for FMCG Brands can help teams identify recurring market patterns rather than isolated price points.
Useful alerts can include:
- Competitor price decreases above a defined threshold
- Competitor price increases
- New promotional prices
- Products becoming unavailable
- Major price gaps between retailers
- New competing SKUs
- Significant changes in pack size
- Changes in assortment
- Repeated promotional activity
For example, if three competitors reduce the price of comparable products within a short period, a dashboard can flag the movement for review. The pricing team can then investigate whether the change reflects a promotion, seasonal campaign, inventory event, or broader category movement.
This approach is especially relevant in value-sensitive markets. McKinsey reported in its 2022 North American grocery research that 45% of surveyed consumers planned to explore more ways to save money, while 90% of surveyed grocery CEOs expected pricing pressure from consumers to continue. (McKinsey & Company)
Continuous data also supports exception-based workflows. Instead of asking analysts to review thousands of unchanged products, the system can highlight only significant movements.
That reduces repetitive analysis and directs attention toward changes that may require commercial investigation.
How can retailers and brands compare prices across different channels?
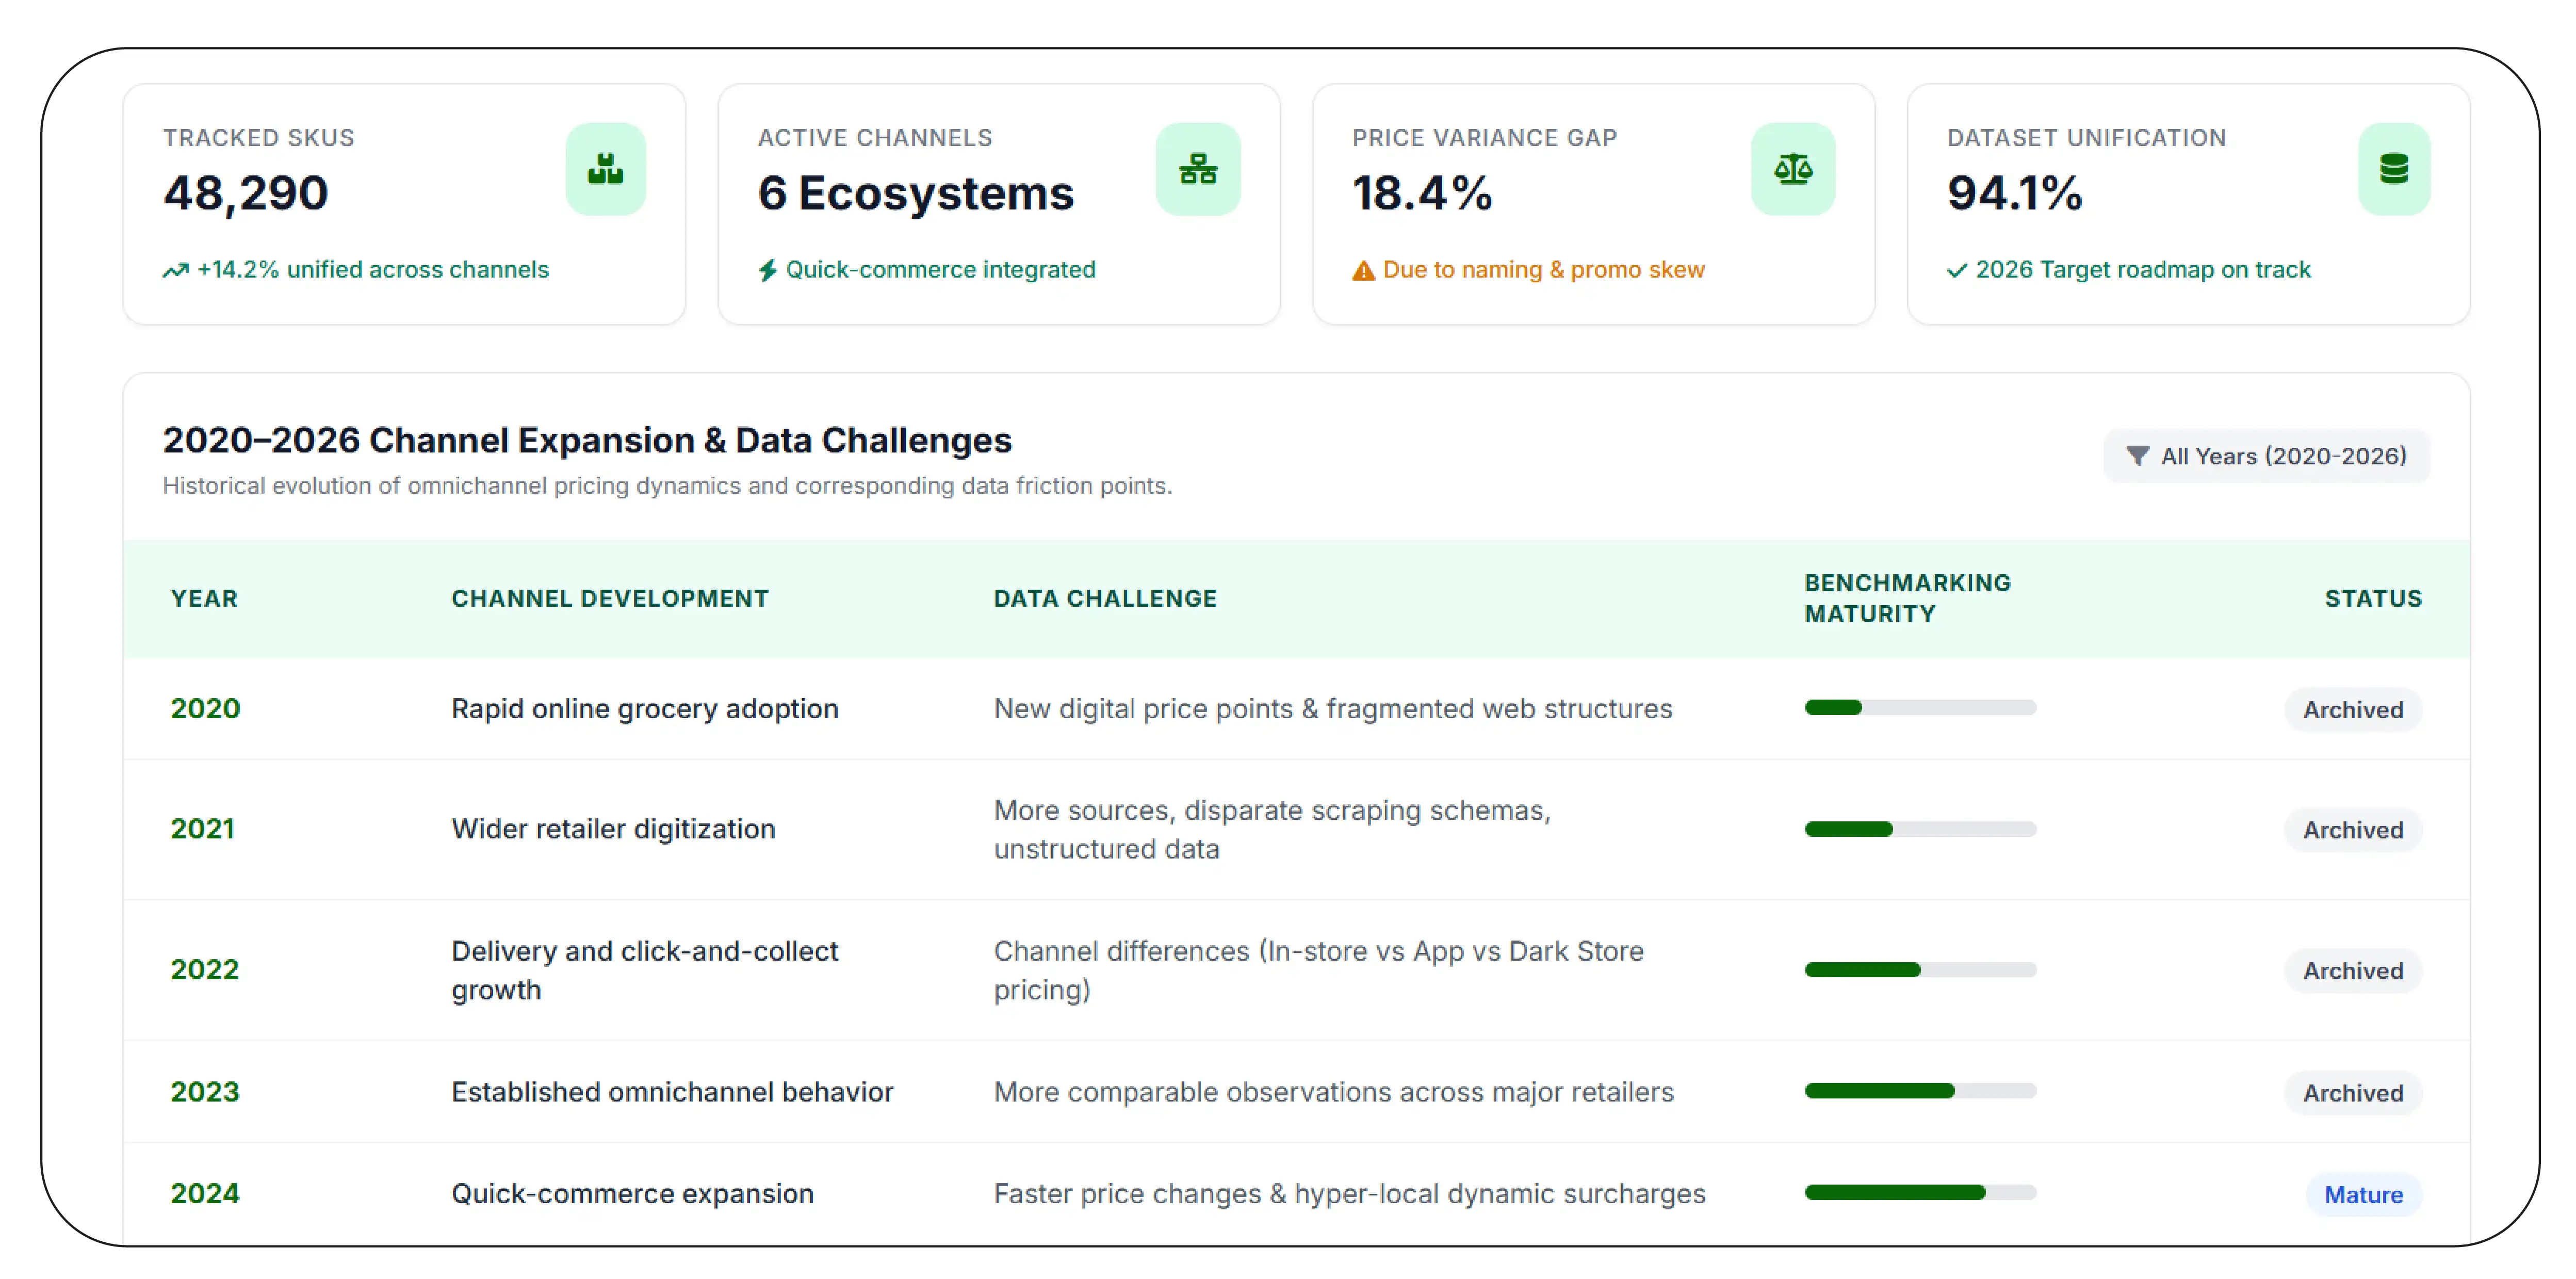
Cross-retailer benchmarking becomes difficult when every retailer uses different product naming, promotional structures, pack formats, and assortment strategies.
2020–2026 channel expansion
| Year |
Channel development |
Data challenge |
| 2020 |
Rapid online grocery adoption |
New digital price points |
| 2021 |
Wider retailer digitization |
More sources |
| 2022 |
Delivery and click-and-collect growth |
Channel differences |
| 2023 |
Established omnichannel behavior |
More comparable observations |
| 2024 |
Quick-commerce expansion |
Faster price changes |
| 2025 |
Broader marketplace participation |
Greater fragmentation |
| 2026 |
Multi-channel pricing ecosystems |
Need for unified datasets |
Create a unified view of market pricing
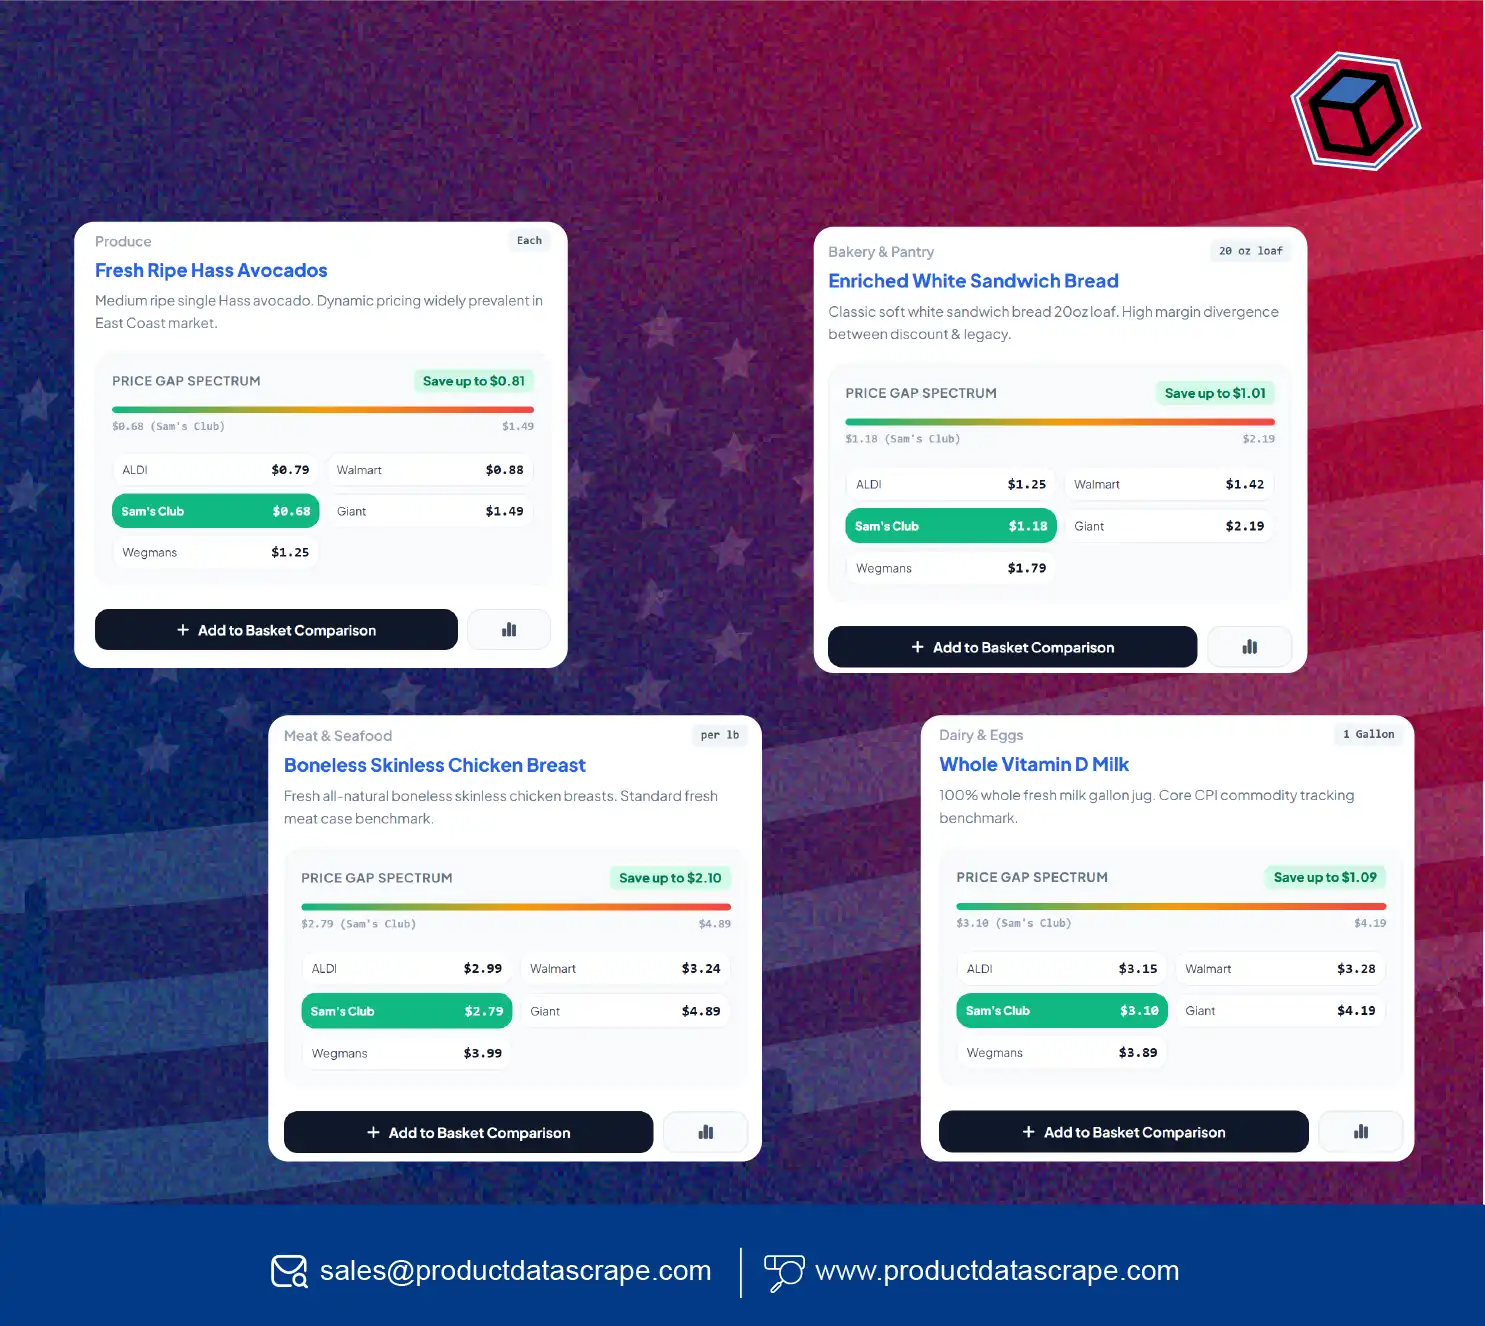
Cross-Retailer FMCG Price Benchmarking helps businesses compare equivalent products across supermarkets, marketplaces, grocery platforms, and other relevant retail channels.
The critical step is normalization. A dataset should distinguish:
- Identical SKUs sold by multiple retailers
- Similar products with different pack sizes
- Multipacks versus individual units
- Regular prices versus promotions
- Different currencies or regional pricing
- Out-of-stock products
- Retailer-specific bundles
- Private-label alternatives
A normalized price-per-unit metric can make cross-retailer comparisons more meaningful. For example, a six-pack and a single unit should not be compared only by their displayed total prices.
The system can also preserve the original displayed price alongside the normalized metric. This is useful because commercial teams often need both the shopper-facing price and the analytical benchmark.
Cross-retailer analysis can reveal whether a pricing gap is widespread or isolated. It can also help identify retailers where a product is consistently promoted or where assortment differences make direct comparisons difficult.
The broader market context supports this need. McKinsey has reported that omnichannel grocery shoppers can allocate a larger share of their grocery spending to a retailer than shoppers using only in-store channels, illustrating why businesses increasingly need visibility across digital and physical shopping journeys. (McKinsey & Company)
Why Choose Product Data Scrape?
Product Data Scrape can support FMCG businesses that need structured, recurring retail data for pricing and competitive analysis. A practical workflow can combine product discovery, data collection, SKU normalization, validation, historical storage, and analytics-ready delivery. The approach can be configured around selected retailers, categories, brands, markets, and attributes rather than forcing every business into the same monitoring model.
For commercial teams, the output can support Share-of-Search & Category Pricing for FMCG, competitor price comparisons, promotion analysis, assortment monitoring, and category-level reporting. The objective is to turn fragmented product information into a consistent dataset that pricing and category teams can use in recurring decision processes.
What should an FMCG pricing workflow look like in 2026?
A scalable workflow should connect collection, validation, analysis, and reporting rather than treating them as separate activities.
Recommended operating model
- Define the competitive universe. Select retailers, brands, categories, markets, and comparable SKUs.
- Collect product information. Capture accessible product attributes, pricing, availability, promotions, and URLs.
- Normalize the data. Standardize product names, pack sizes, units, brands, categories, and pricing fields.
- Match comparable products. Use SKU identifiers and product attributes to create appropriate comparison groups.
- Calculate benchmarks. Generate price gaps, averages, price indices, promotional frequency, and retailer comparisons.
- Track historical changes. Store timestamped observations to distinguish temporary changes from longer-term movements.
- Create alerts and dashboards. Surface meaningful changes instead of requiring teams to manually inspect every product.
- Feed commercial workflows. Deliver structured datasets or reports for pricing, category management, revenue management, sales, and e-commerce teams.
This workflow supports more than simple price tracking. It creates a repeatable information layer for decisions involving pricing, promotions, assortment, and competitive positioning.
Conclusion
FMCG pricing has become increasingly complex as brands compete across supermarkets, e-commerce, marketplaces, and quick-commerce channels. A Price benchmarking tool custom retail fmcg 2026 can help businesses organize this complexity by combining SKU-level collection, price normalization, competitor comparisons, historical tracking, and retailer-specific analysis.
The strongest results come from treating pricing data as a continuous intelligence workflow rather than a one-time research exercise. Teams can monitor comparable products, identify meaningful price gaps, evaluate promotional movements, and investigate channel-level differences using consistent datasets.
Product Data Scrape can help businesses structure this process around their target retailers, categories, markets, and analytical requirements.
Build a customized FMCG pricing intelligence workflow with Product Data Scrape to turn retail product and price data into actionable competitive insights!
FAQs
1. What is an FMCG price benchmarking tool?
It compares product prices across selected retailers and competitors, normalizes product attributes, tracks historical changes, and provides structured data for pricing and category analysis.
2. Which FMCG data can be monitored?
Businesses can monitor product names, SKUs, brands, pack sizes, prices, discounts, availability, retailers, categories, URLs, timestamps, and other accessible product attributes.
3. How does price benchmarking support margin decisions?
Benchmarking shows where a brand's prices differ from comparable market prices. Teams can use these gaps alongside costs, promotions, positioning, and commercial goals when reviewing pricing.
4. Can Product Data Scrape support customized retail monitoring?
Yes. Product Data Scrape can support customized collection workflows based on selected retailers, categories, products, locations, attributes, schedules, and output requirements.
5. How often should FMCG prices be tracked?
The appropriate frequency depends on category volatility and business needs. Fast-changing or promotional categories may require more frequent monitoring than stable product segments.


 Singapore
 EMAIL
EMAIL
 PHONE
PHONE


.webp "thumb")













.webp)






