Quick Overview
A leading beverage intelligence brand partnered with Product Data Scrape to transform restaurant wine information into structured, decision-ready data. The project focused on collecting wine names, prices, alcohol details, restaurant information, ratings, and menu attributes from Tabelog. Using Extract Wine Alcohol and Liquor Price Data, the client established a scalable monitoring system for competitive research and pricing intelligence. The engagement covered automated collection, data normalization, validation, and recurring delivery. Within the initial implementation, data processing speed improved by 70%, validation accuracy reached 97%, and manual research effort was reduced by 65%, giving the client a faster way to understand Japan's restaurant wine market.
Client Name / Industry: Leading Beverage Intelligence Brand / Wine & Beverage Analytics
Service / Duration: Restaurant Wine Data Scraping & Market Intelligence / 6 Months
Key Impact Metrics: 70% faster data processing | 97% validation accuracy | 65% reduction in manual research
The Client
The client was a beverage intelligence company serving wine retailers, distributors, hospitality businesses, and consumer brands across Japan. Its business depended on understanding how wines were positioned across restaurants, including differences in pricing, bottle sizes, alcohol content, availability, and menu presentation.
Japan's restaurant and hospitality sector is highly diverse, with premium dining establishments, casual restaurants, izakayas, wine bars, hotel restaurants, and specialty venues offering different wine selections. This created a challenging environment for brands attempting to compare market positioning at scale.
Before partnering with Product Data Scrape, the client relied heavily on manual research and fragmented spreadsheets. Researchers had to visit individual restaurant pages, identify relevant wine listings, capture pricing information, and organize the results before analysis. The process was slow and difficult to repeat consistently.
The growing requirement for a Tabelog restaurant beverage dataset made transformation essential. The client needed a structured source that could support restaurant-level comparisons without requiring researchers to repeatedly collect information manually.
At the same time, the lack of standardized Competitive pricing data made it difficult to identify pricing patterns across restaurants and wine categories. Product Data Scrape introduced an automated data pipeline that converted publicly available restaurant menu information into structured records suitable for analytics, benchmarking, and recurring market monitoring.
Goals & Objectives
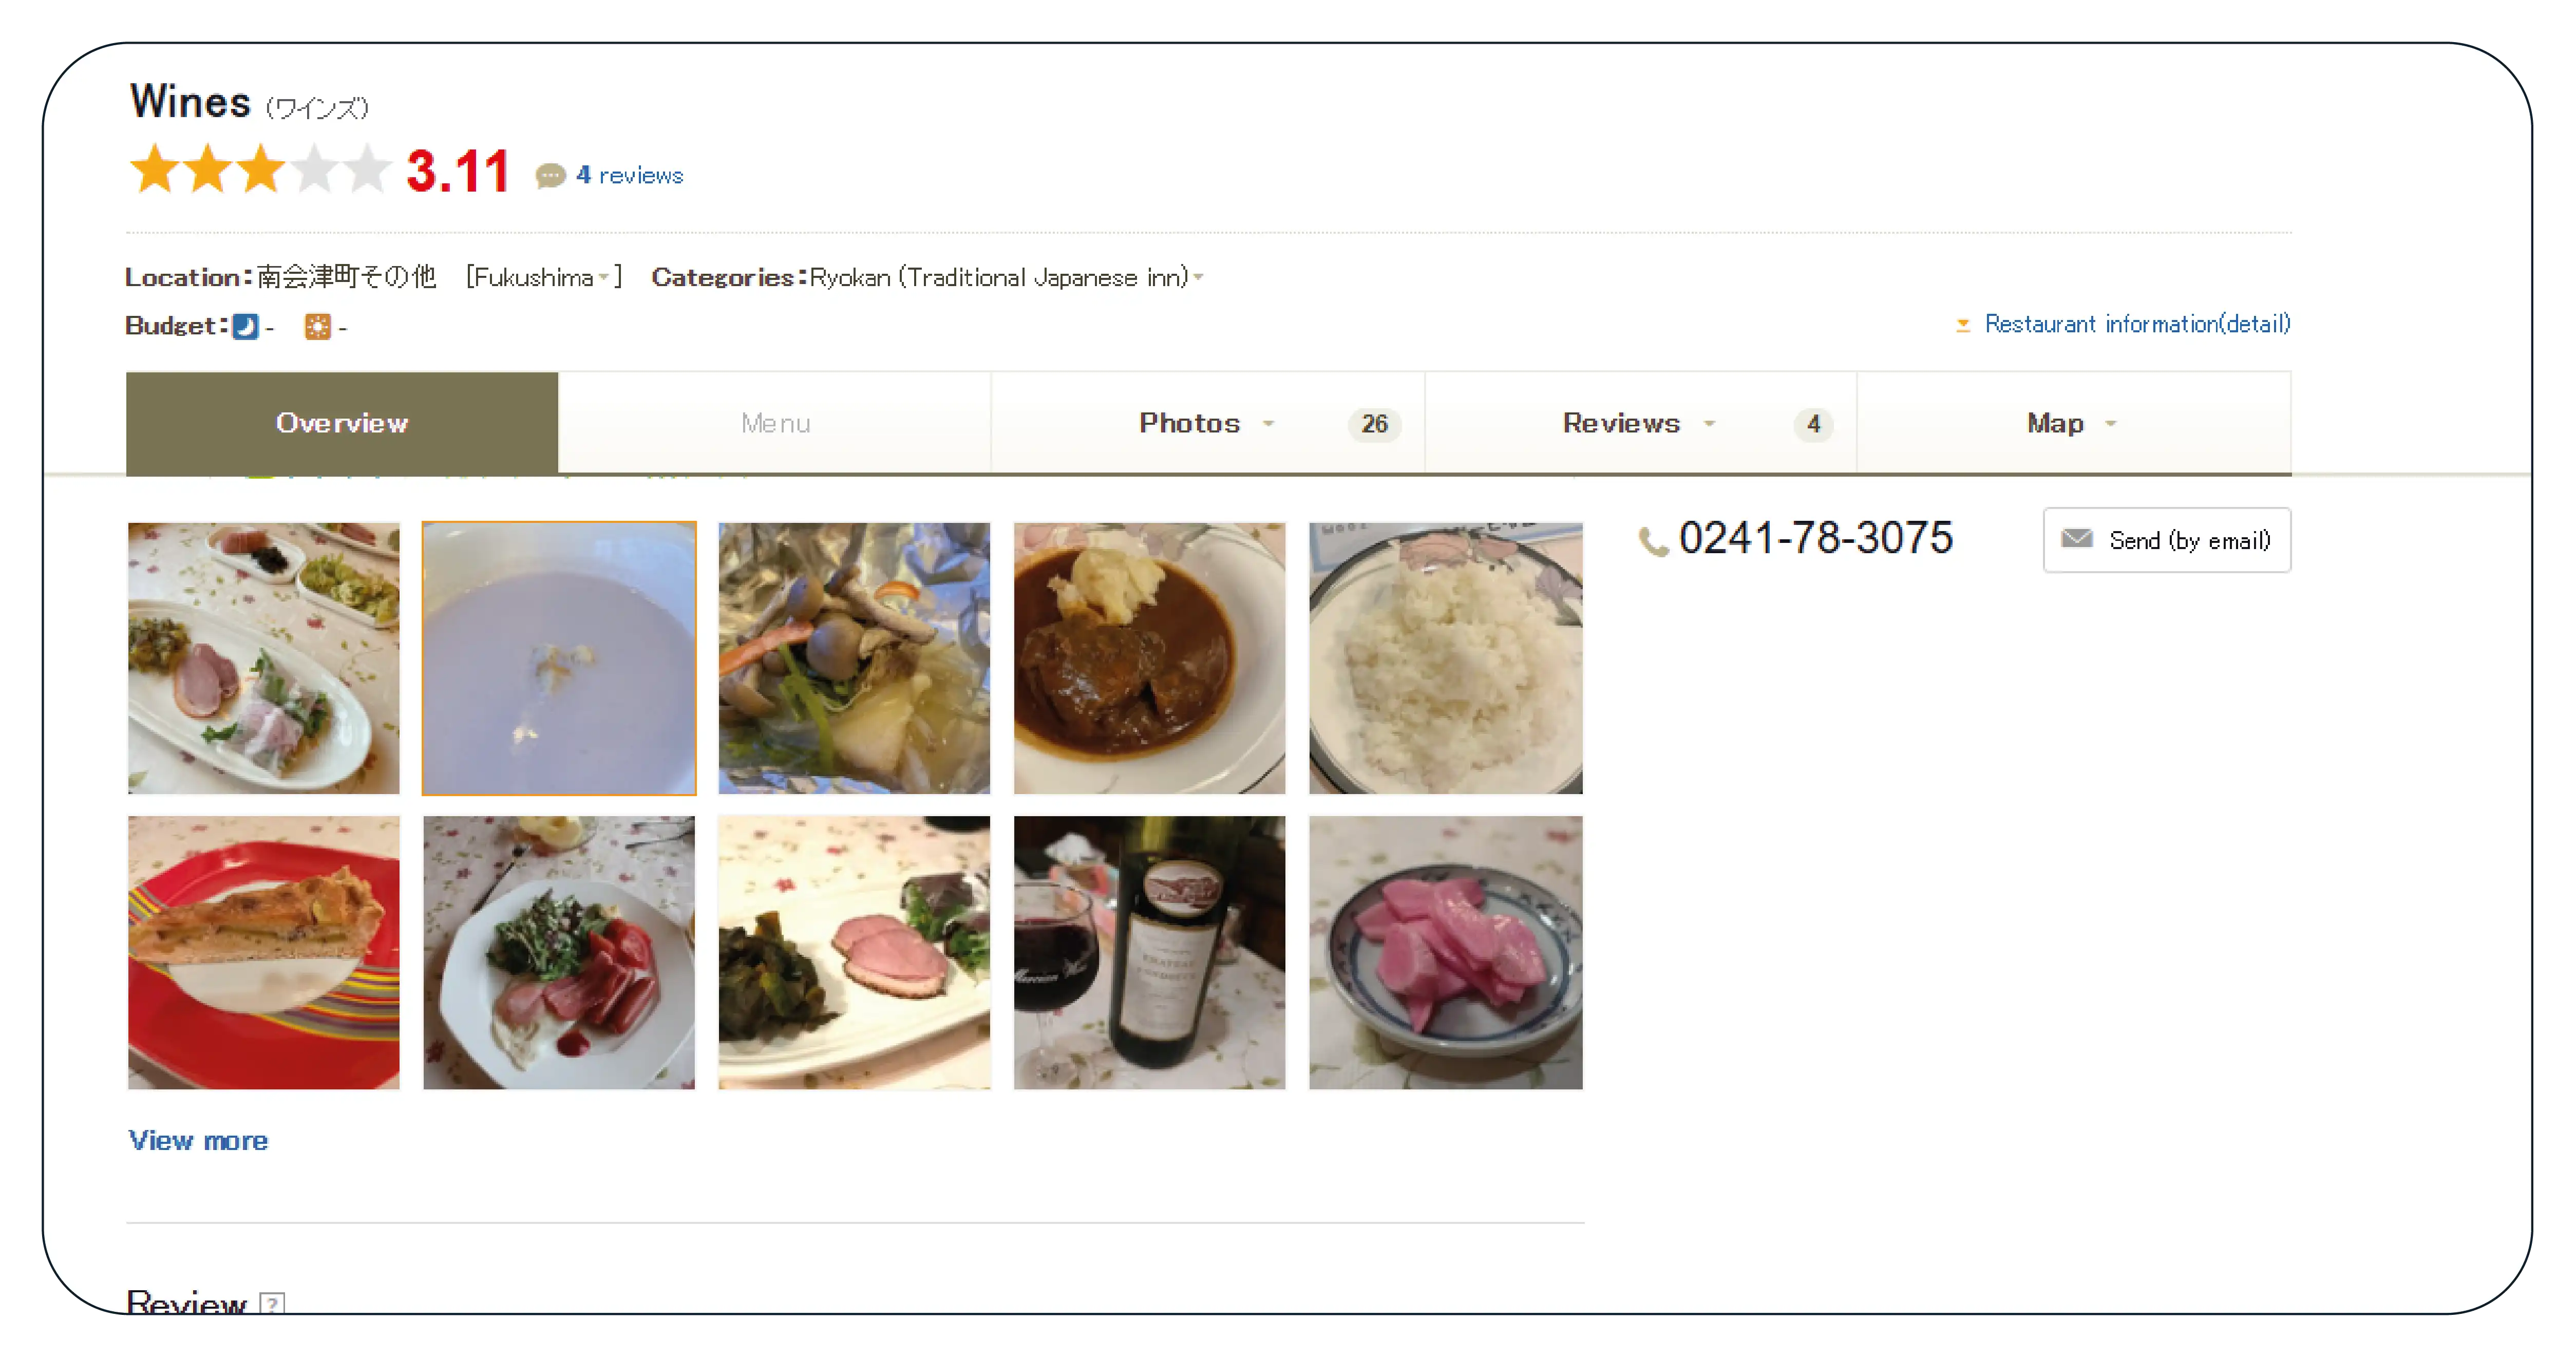
The client wanted to create a scalable wine intelligence workflow capable of handling thousands of restaurant and product records without continuously increasing manual research requirements.
Scale wine and restaurant data collection across multiple locations.
Improve the speed of market data availability.
Increase consistency and accuracy across collected records.
Reduce repetitive manual research and spreadsheet management.
Create a reliable foundation for pricing and assortment comparisons.
The technical implementation focused on creating an automated and analytics-ready workflow.
Automate restaurant and wine listing collection.
Normalize wine names, prices, alcohol percentages, restaurant names, and locations.
Integrate validation rules into the processing pipeline.
Enable recurring data collection for trend monitoring.
Prepare structured outputs for dashboards and analytical systems.
Support a Japanese restaurant wine intelligence report through standardized datasets.
70% improvement in data processing speed.
97% data validation accuracy across sampled records.
65% reduction in manual research effort.
90%+ structured-field completeness across priority wine attributes.
Recurring datasets delivered according to the agreed monitoring schedule.
The Core Challenge
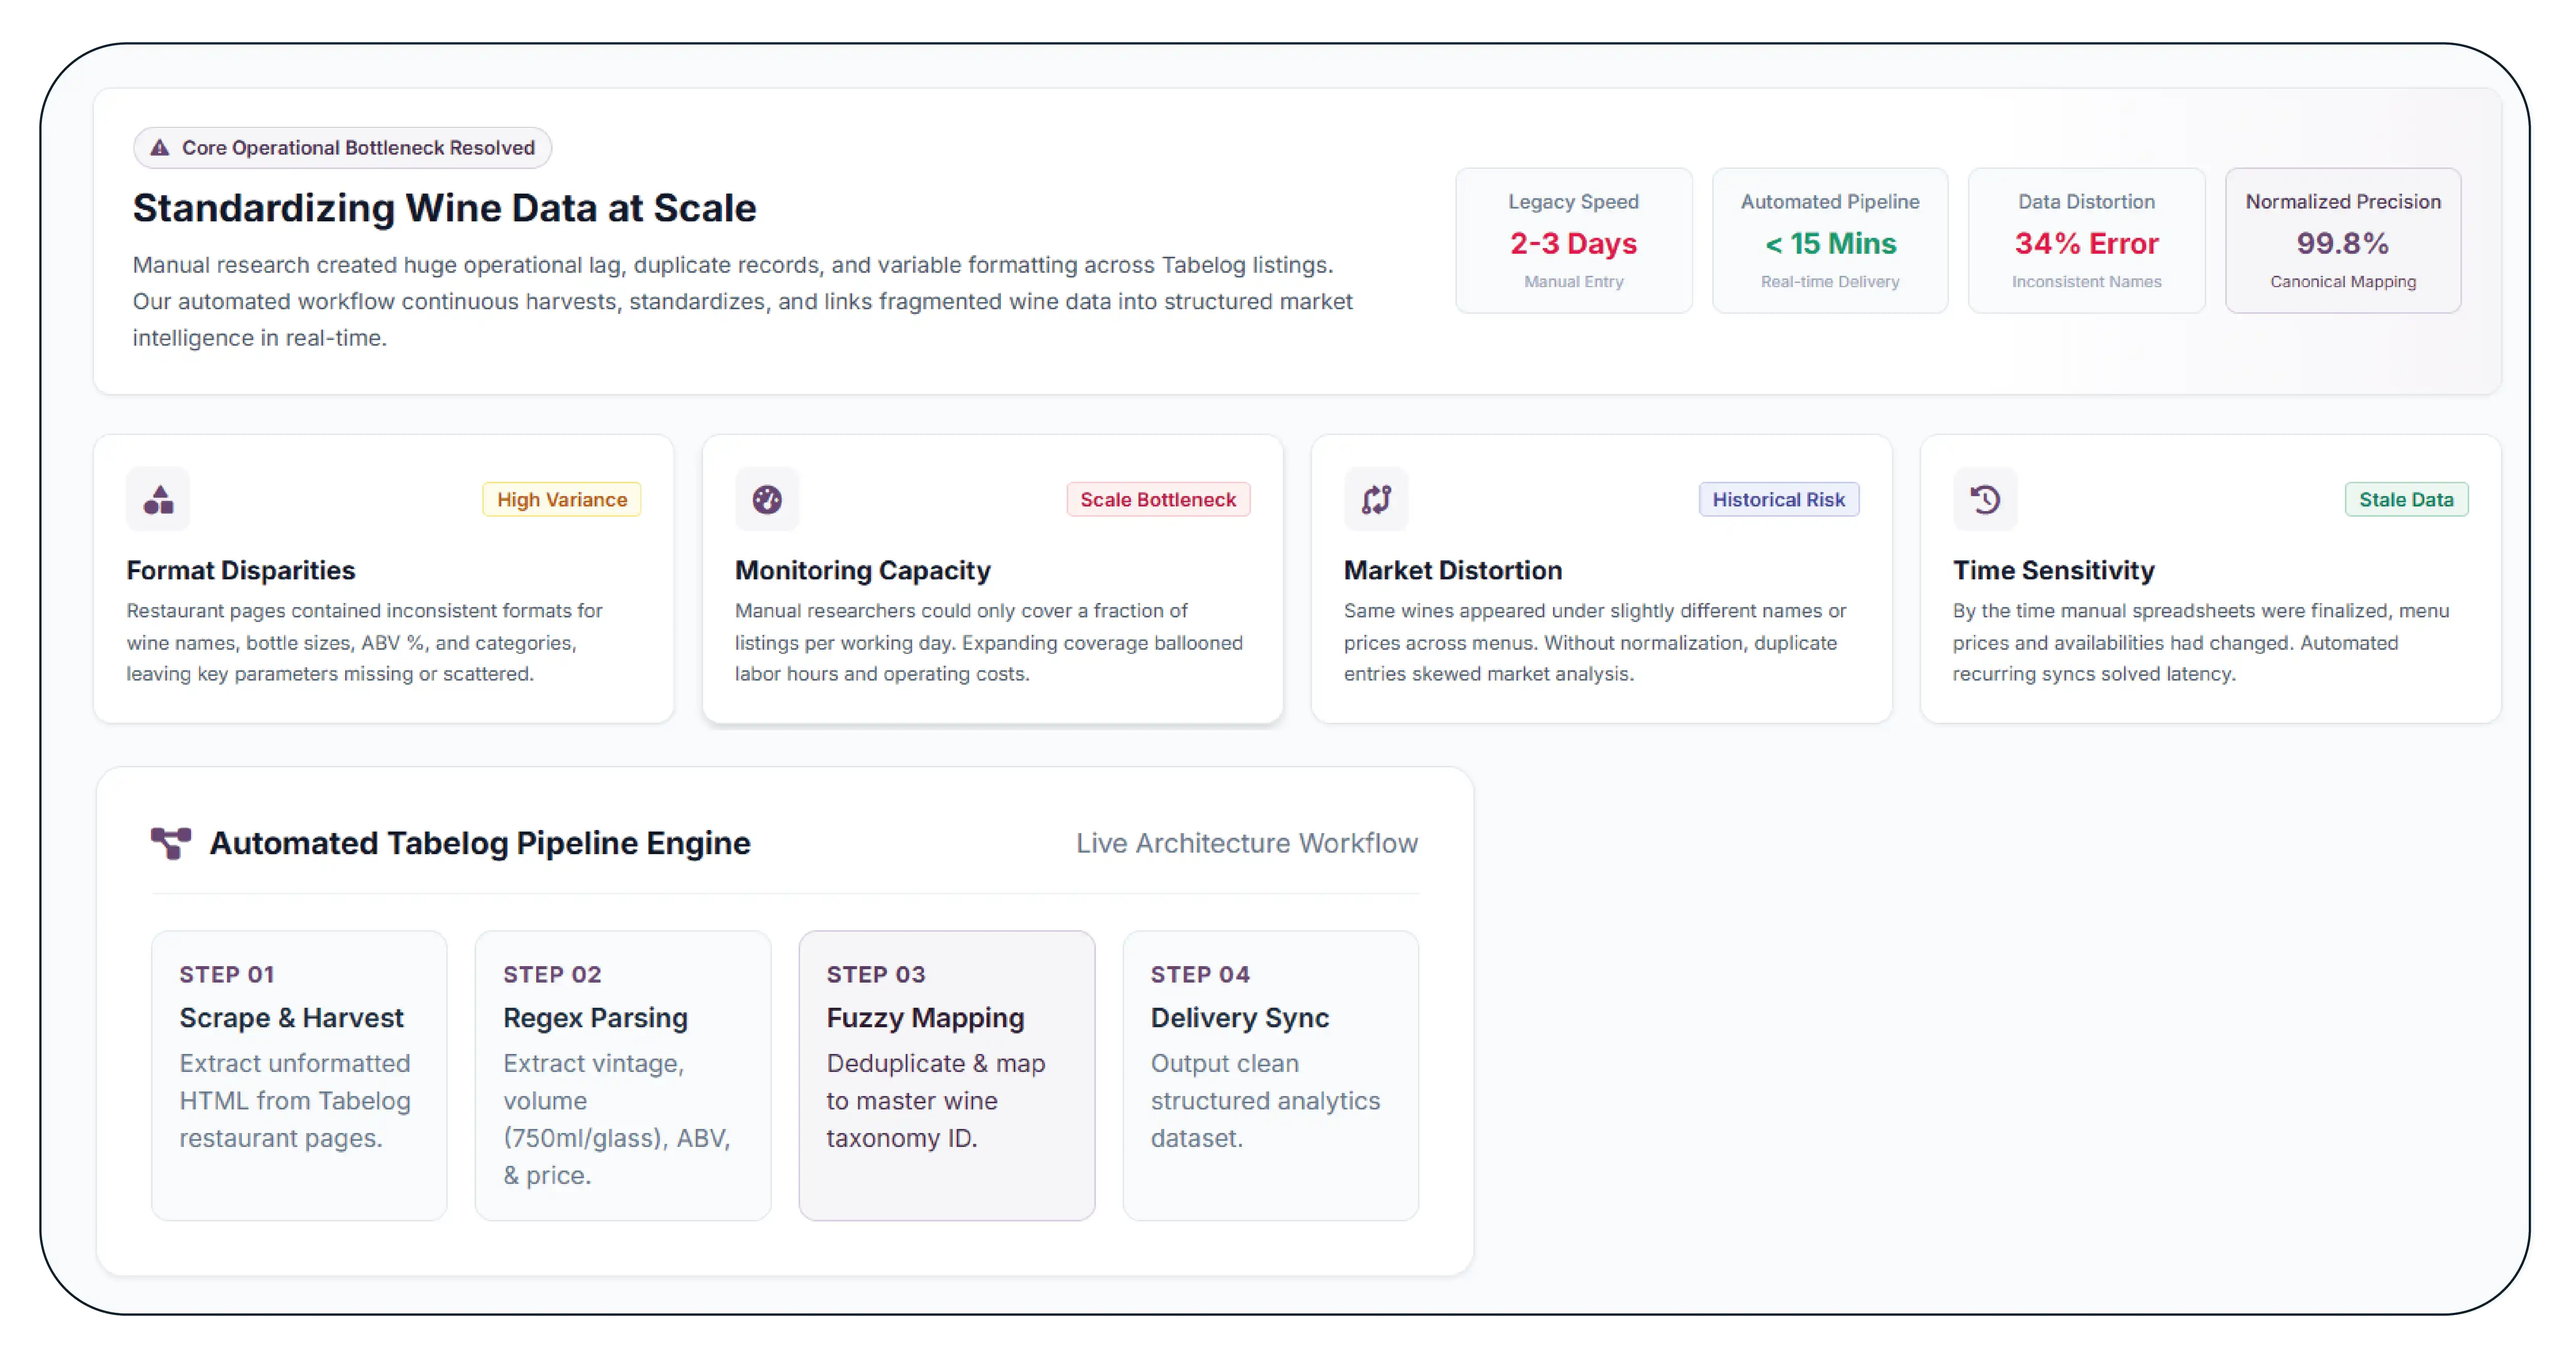
The client's biggest challenge was not simply finding restaurant wine information—it was collecting, standardizing, and maintaining that information at scale.
Restaurant pages contained different formats for wine names, prices, bottle sizes, alcohol percentages, menu categories, and availability. Some listings provided detailed descriptions, while others contained only basic product information. This variation created additional work for analysts attempting to compare restaurants consistently.
Another operational bottleneck was the number of restaurant pages that required monitoring. Manual researchers could collect information from a limited number of restaurants within a working day, but expanding coverage substantially increased time requirements.
The client also faced challenges in maintaining historical consistency. A wine could appear under slightly different names, prices could change, and menu structures could vary between restaurants. Without normalization, duplicate or inconsistent records could distort market analysis.
The absence of a standardized Tabelog data for wine market analysis workflow meant that analysts spent too much time preparing data instead of interpreting it.
Speed was another concern. By the time manually gathered information was compiled into spreadsheets, some prices or menu listings could already have changed. The client therefore required an automated process capable of recurring collection, validation, normalization, and structured delivery.
Our Solution
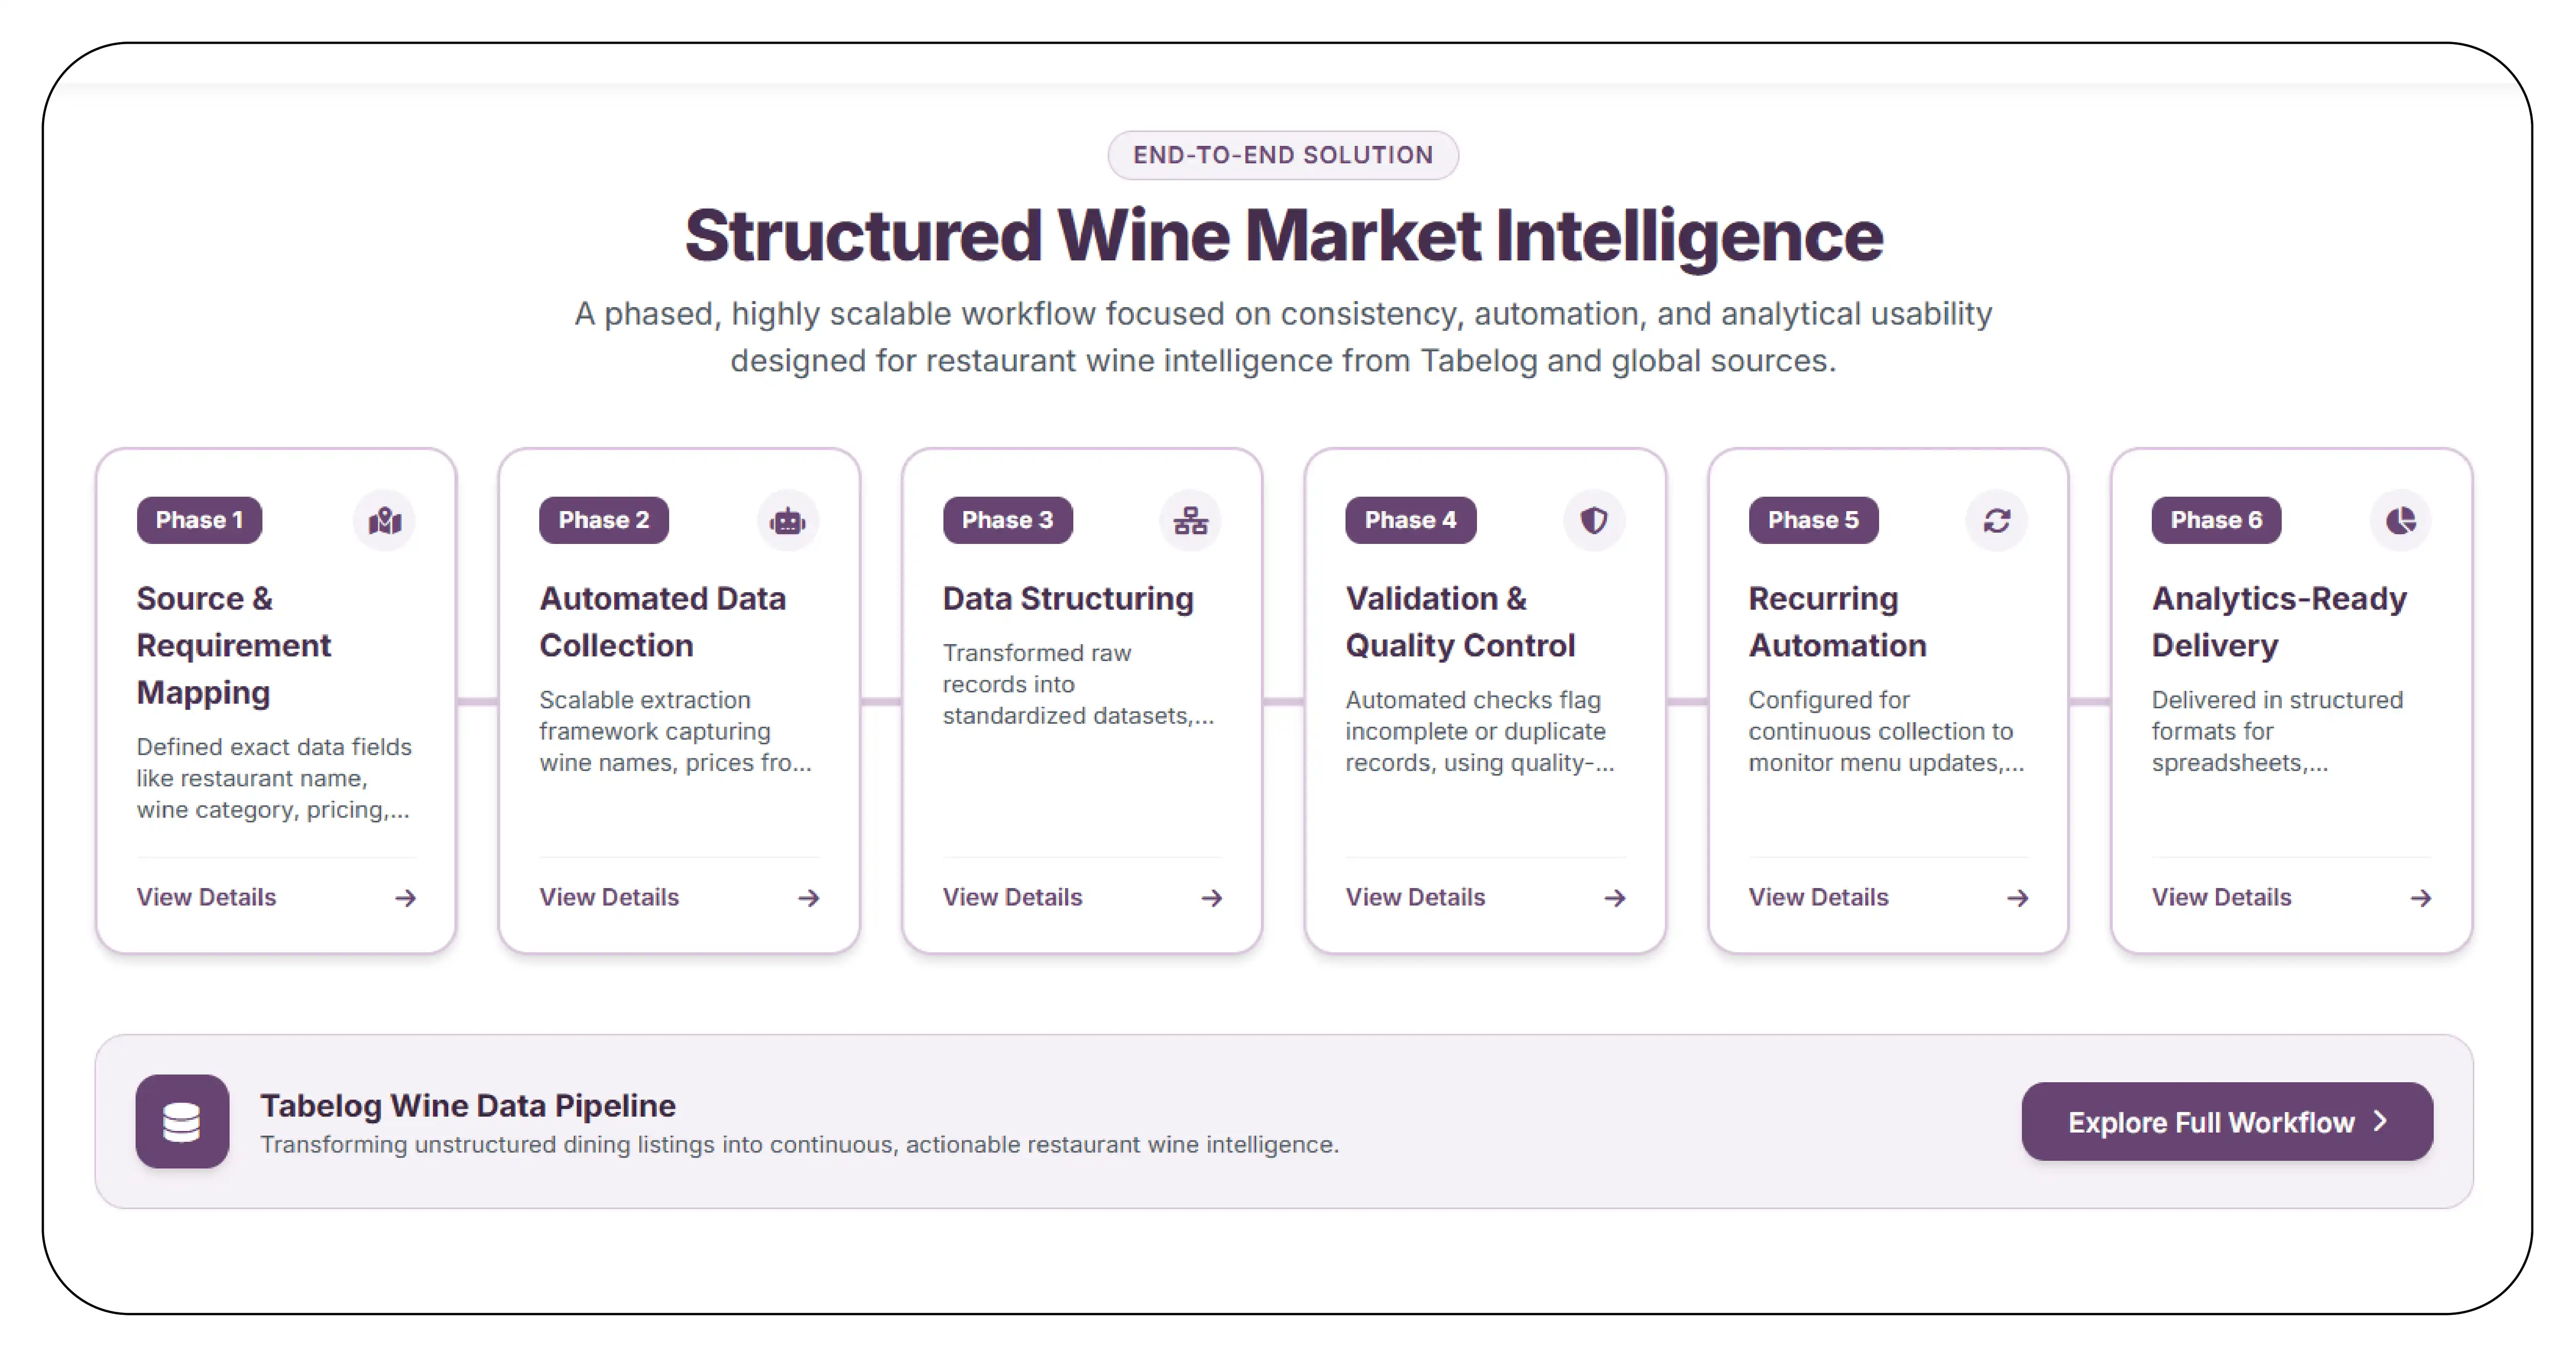
Product Data Scrape designed a phased wine intelligence workflow focused on scalability, consistency, automation, and analytical usability.
Phase 1: Source and Requirement Mapping
The first stage defined the exact data fields required by the client. These included restaurant name, restaurant location, wine name, wine category, listed price, bottle or serving size, alcohol percentage, menu description, ratings, URL, and other accessible attributes. Priority restaurant categories and geographic areas were also mapped so the collection workflow could be expanded systematically.
Phase 2: Automated Data Collection
A scalable extraction framework was developed to identify relevant restaurant pages and collect wine-related information. Automated workflows reduced dependence on repetitive manual browsing and allowed the client to expand coverage. The extraction logic was designed to extract wine names and prices from Tabelog while also capturing supporting restaurant and product attributes whenever available.
Phase 3: Data Structuring
Raw records were transformed into standardized datasets. Wine names were cleaned, prices were converted into consistent formats, and restaurant information was organized into dedicated fields. This phase also addressed variations in naming conventions, serving formats, and menu presentation.
Phase 4: Validation and Quality Control
Automated validation rules checked required fields and identified incomplete, duplicate, or inconsistent records. Records failing predefined checks were flagged for additional processing. Quality-control sampling was then used to measure extraction accuracy and improve processing rules.
Phase 5: Recurring Automation
The workflow was configured for recurring collection so the client could maintain updated market intelligence instead of relying on one-time datasets. This made it easier to monitor changes in restaurant wine menus, pricing, and product availability over time.
Phase 6: Analytics-Ready Delivery
Final datasets were delivered in structured formats suitable for spreadsheets, databases, BI dashboards, and downstream analytical systems. The resulting pipeline supported scrape wine data Collection from Tabelog as a repeatable data intelligence process rather than a one-off research exercise.
Results & Key Metrics
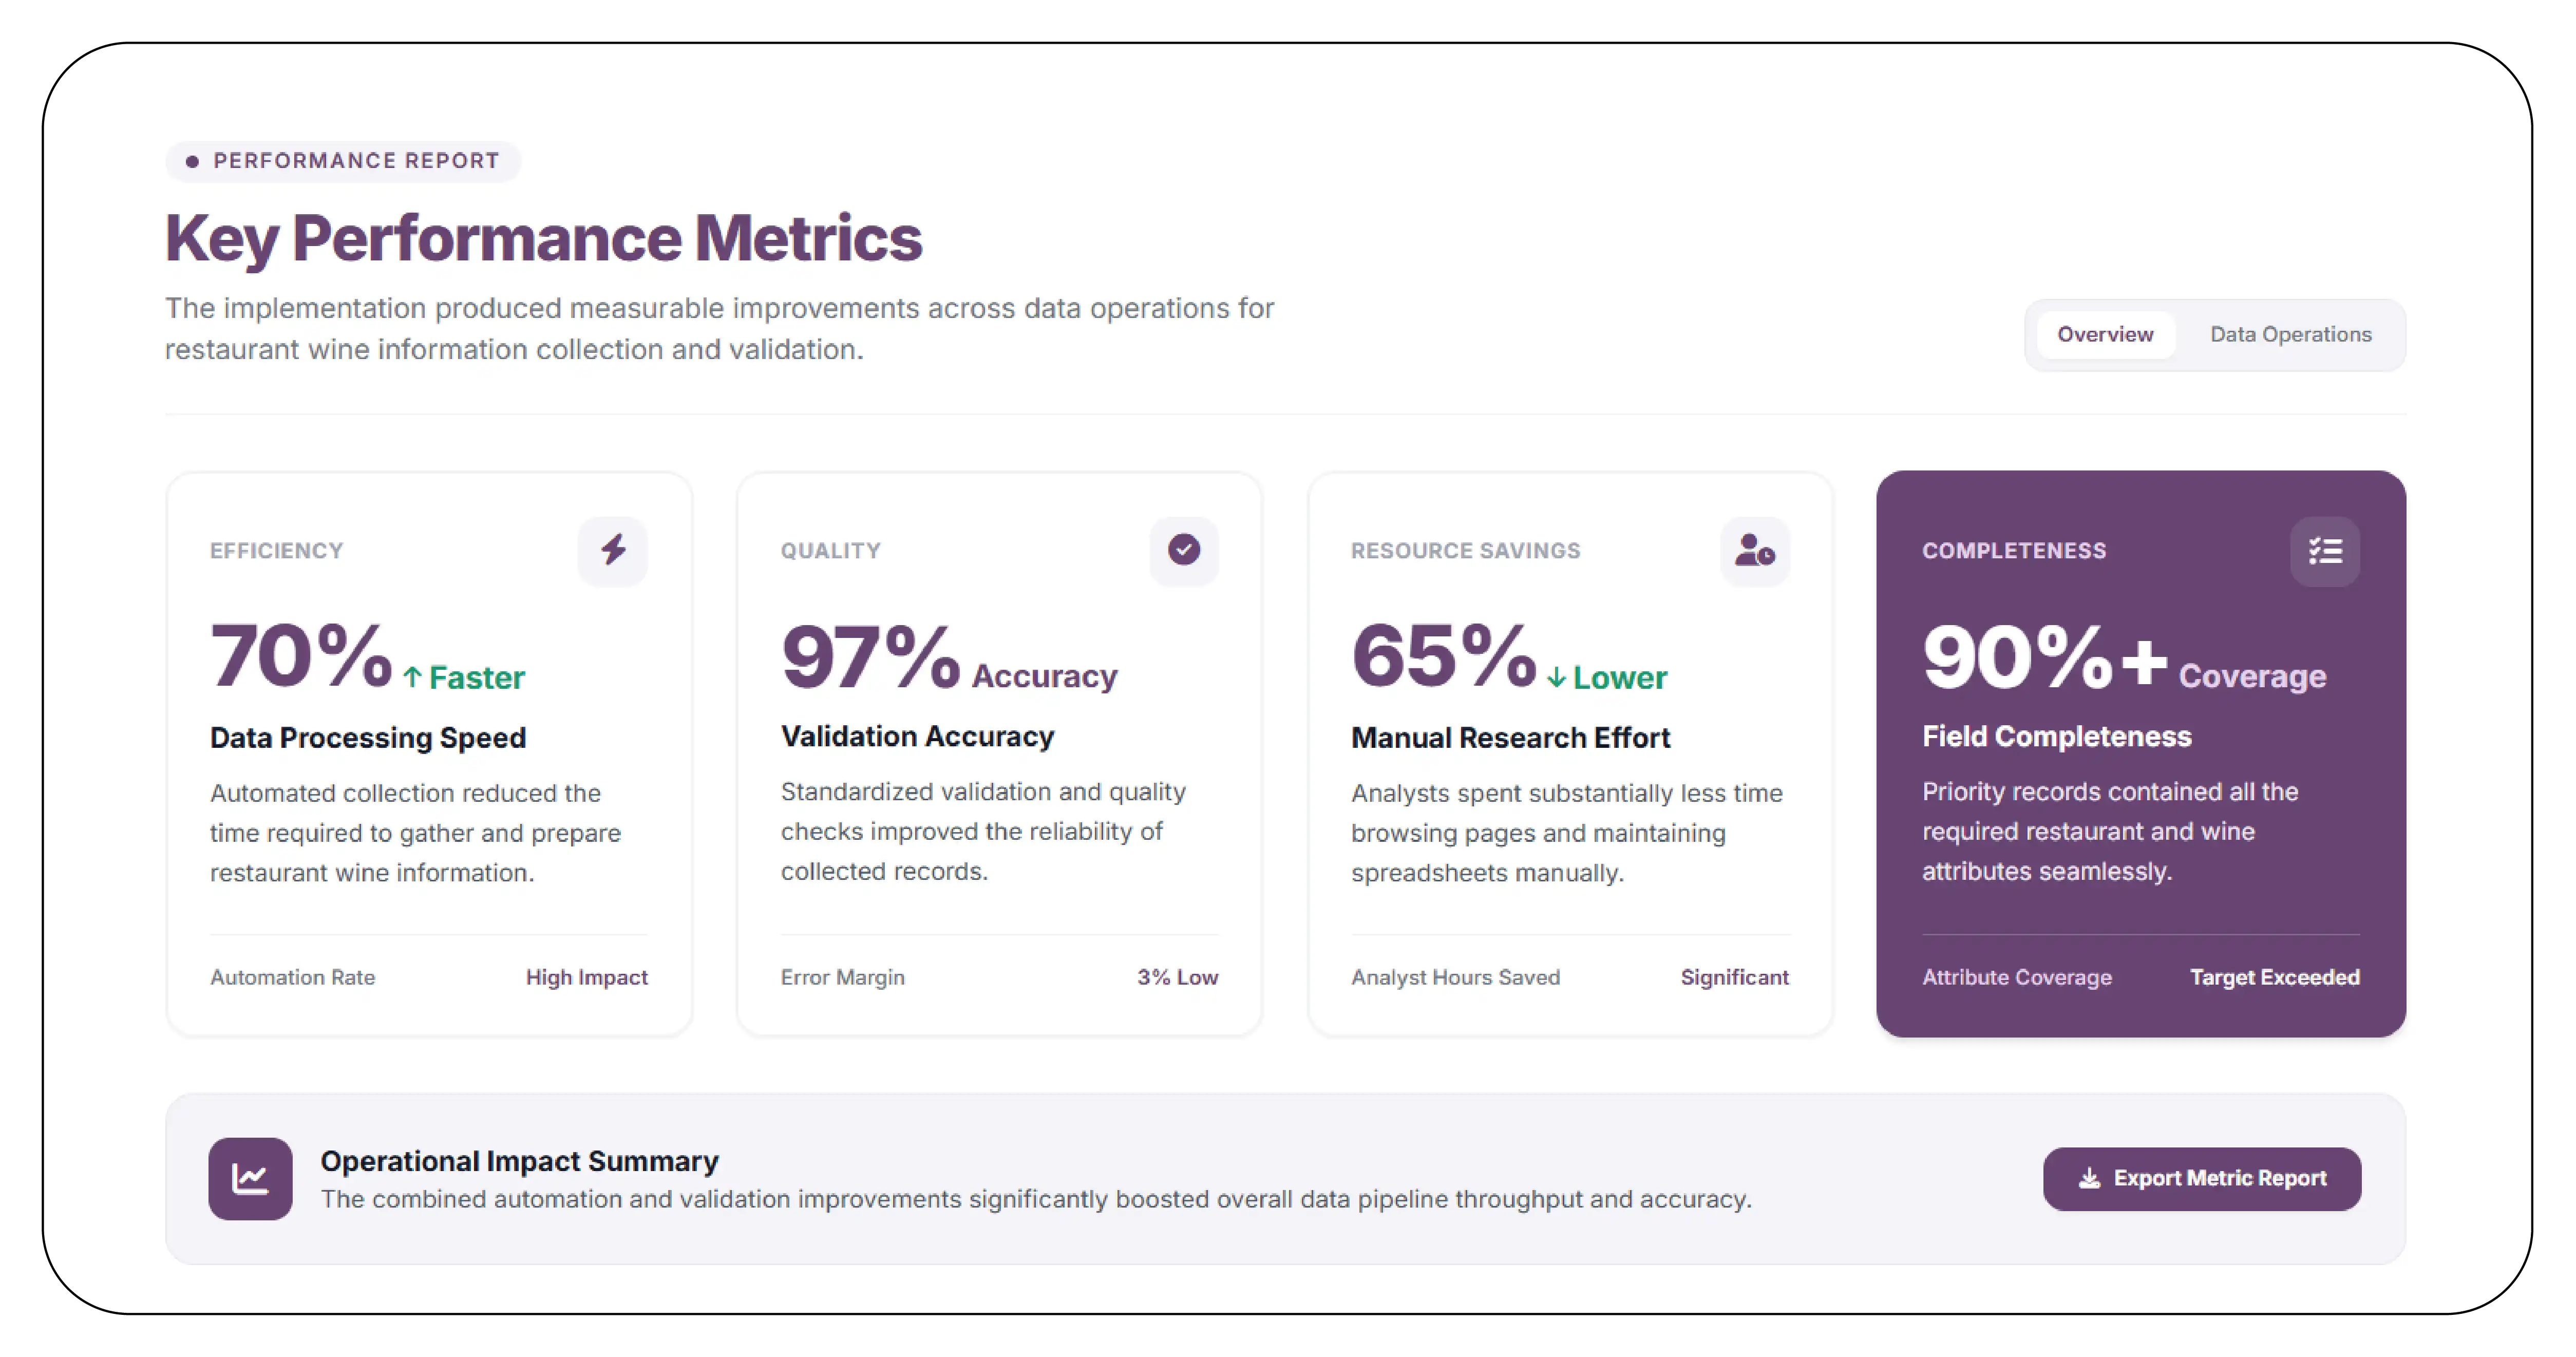
The implementation produced measurable improvements across data operations:
70% faster data processing: Automated collection reduced the time required to gather and prepare restaurant wine information.
97% validation accuracy: Standardized validation and quality checks improved the reliability of collected records.
65% lower manual research effort: Analysts spent substantially less time browsing pages and maintaining spreadsheets.
90%+ field completeness: Priority records contained the required restaurant and wine attributes.
Recurring monitoring capability: Automated workflows enabled scheduled refreshes instead of isolated research projects.
Results Narrative
The client moved from fragmented manual research to a structured intelligence workflow capable of supporting broader restaurant coverage. The improved pipeline allowed analysts to monitor wine menus across Japan with greater consistency and reduced the operational burden associated with repetitive collection.
More importantly, the client could use standardized datasets to compare restaurant pricing, identify product availability patterns, and track changes over time. The improved data workflow strengthened competitive research while allowing the internal team to focus more on analysis and strategic decision-making.
The project demonstrated how scrape wine data Collection from Tabelog could become part of an ongoing market intelligence infrastructure rather than simply a data-gathering exercise.
What Made Product Data Scrape Different
Product Data Scrape differentiated the project through a combination of structured extraction, automated quality controls, normalization, and recurring monitoring.
Rather than delivering unprocessed records, the workflow was designed around the client's analytical requirements. Wine information was organized into consistent fields, duplicate records were identified, and validation rules helped maintain dataset quality.
The solution also incorporated flexible automation that could accommodate changing restaurant pages and different menu structures. This reduced the need for constant manual intervention.
The resulting Tabelog Wine & Restaurant Intelligence framework gave the client a scalable foundation for restaurant-level wine research. Its modular design also allowed new locations, restaurants, wine categories, and attributes to be incorporated as the client's intelligence requirements expanded.
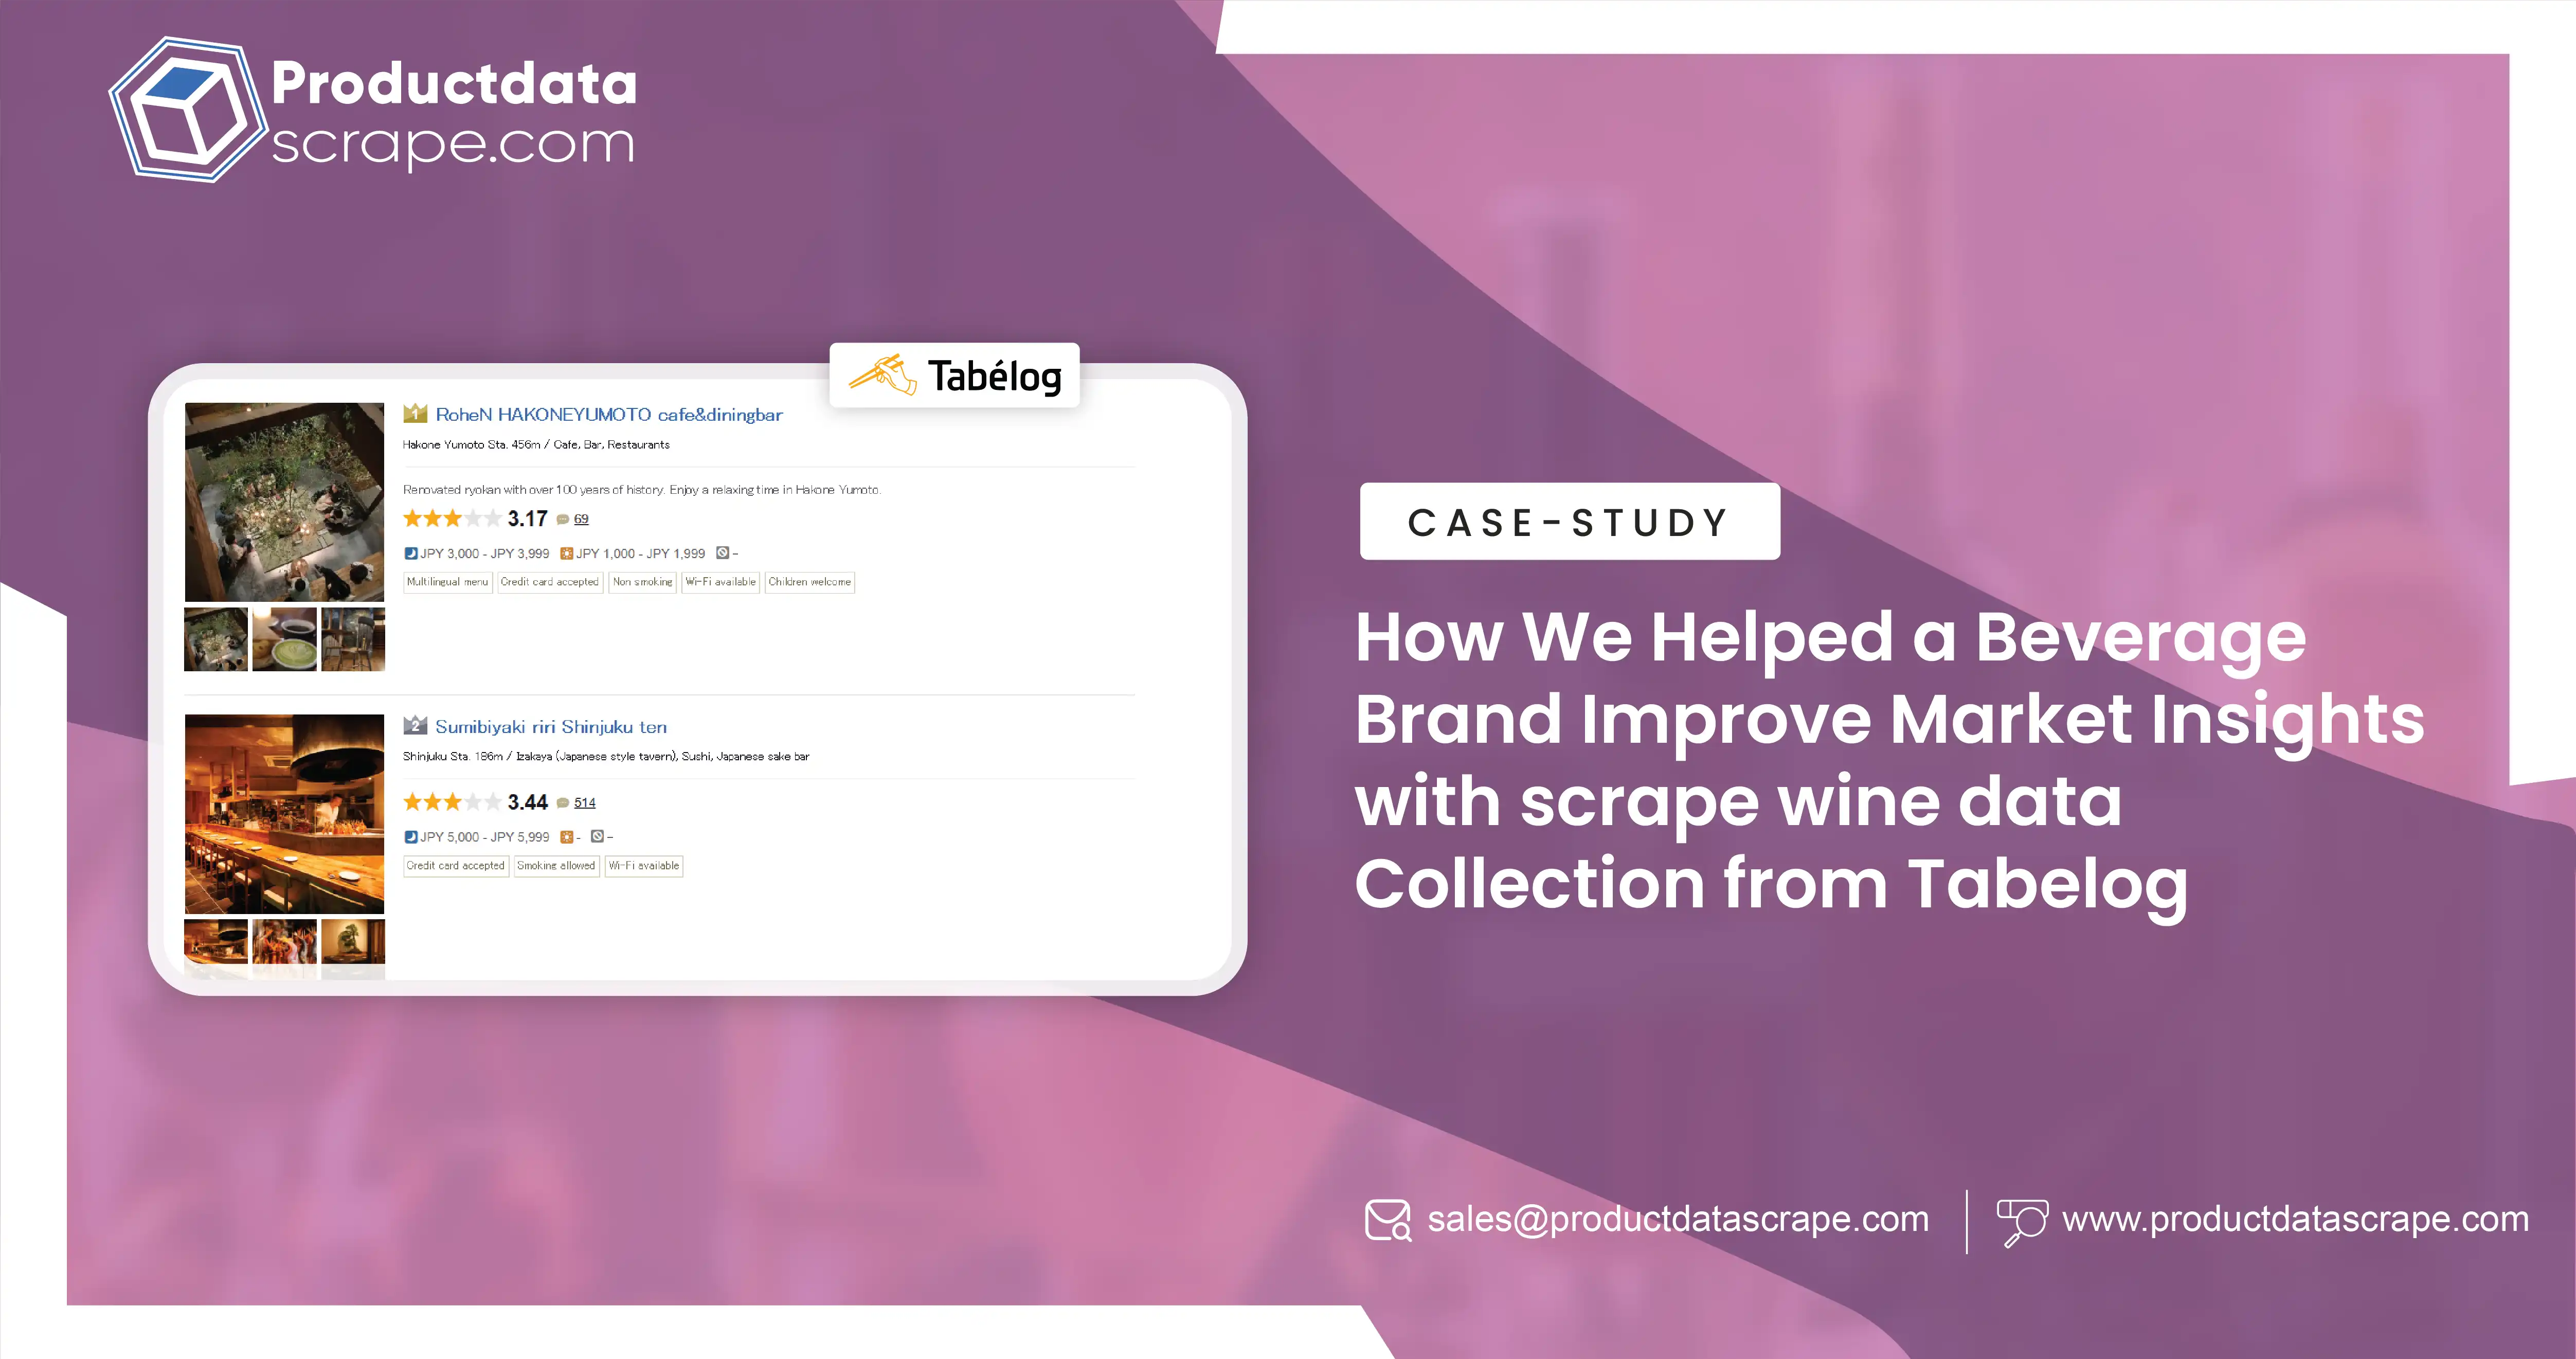
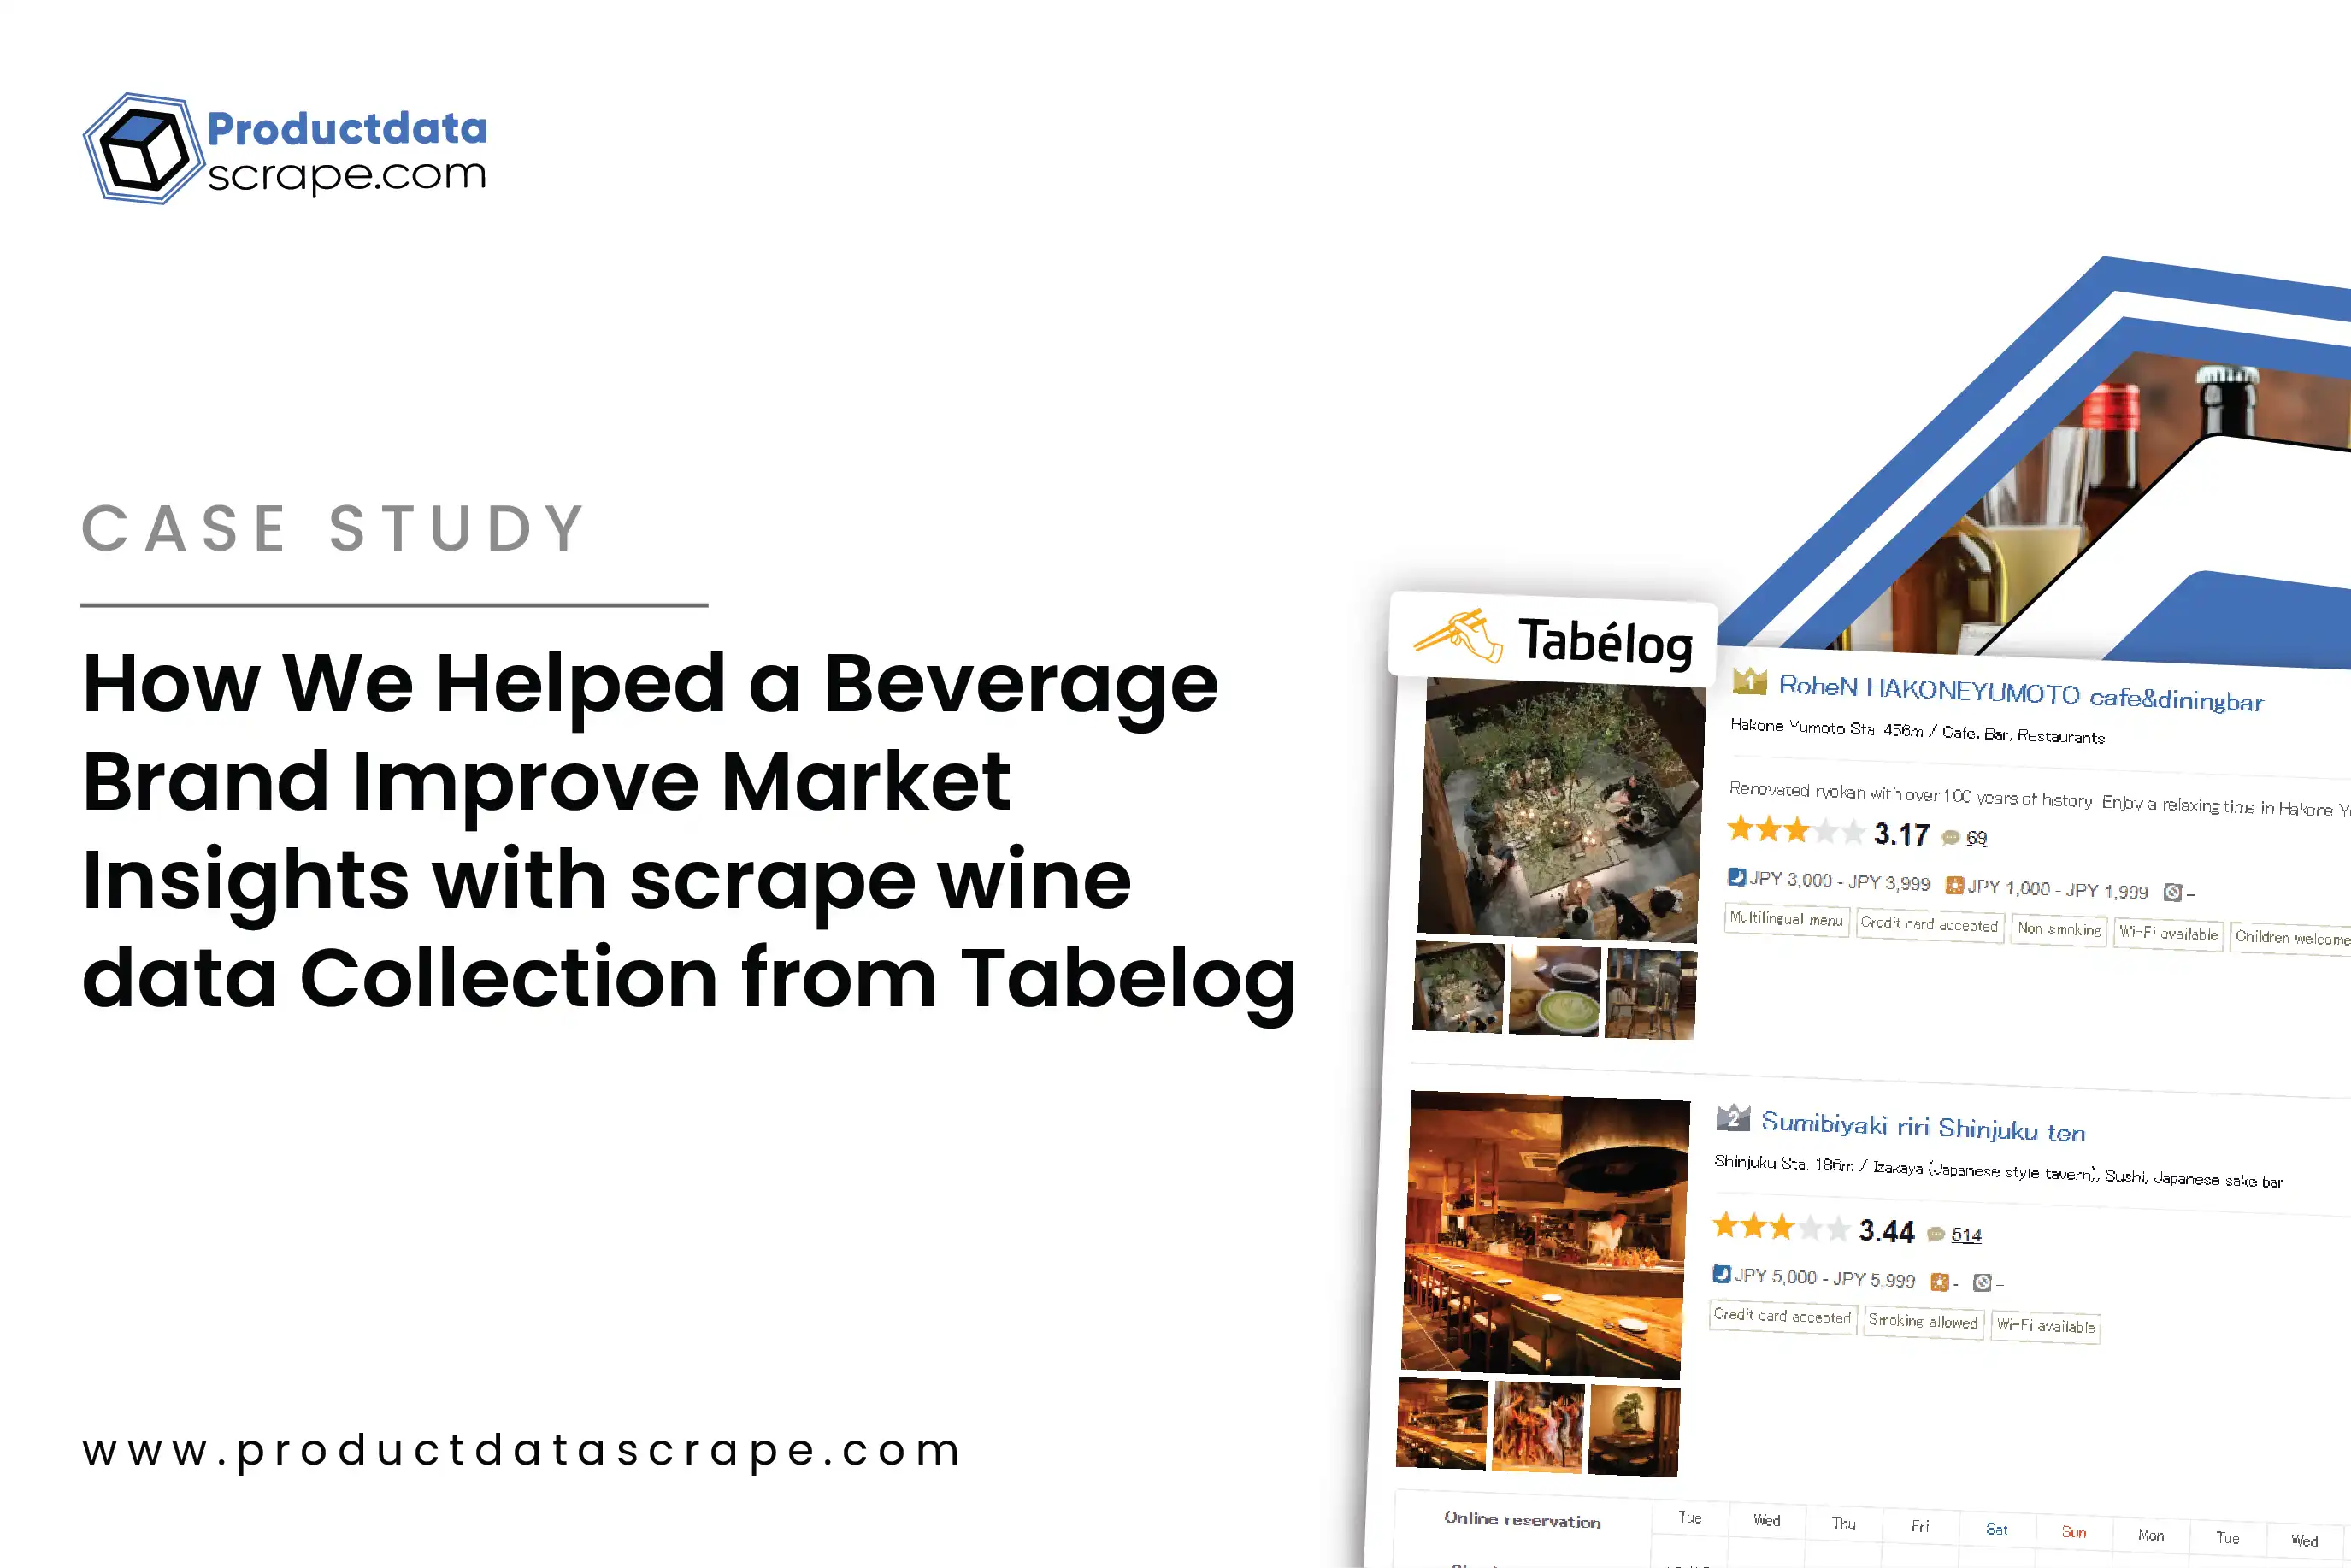
For designers, recommended visual elements include a Tabelog-style restaurant page mockup, wine menu cards, automated data-flow diagrams, Japan market maps, and a structured wine intelligence dashboard.
Client's Testimonial
"Product Data Scrape helped us move from fragmented restaurant research to a structured wine intelligence workflow. The biggest improvement was not simply the volume of information we could collect, but the consistency and usability of the resulting dataset. Our analysts can now spend more time interpreting market movements instead of manually gathering and cleaning records. The automated approach has also made recurring monitoring much easier to manage."
— Director of Market Intelligence, Leading Beverage Analytics Brand
Conclusion
The project demonstrated how structured restaurant data can help beverage businesses build stronger market intelligence capabilities. By combining automated collection, normalization, validation, and recurring delivery, Product Data Scrape helped the client improve data availability while reducing manual research requirements.
The resulting workflow supported pricing comparisons, wine assortment analysis, restaurant-level benchmarking, and ongoing market monitoring. It also created a scalable foundation that could accommodate additional restaurants, locations, product categories, and analytical requirements through the Total Wine Product Data Scraper.
For businesses seeking reliable E-commerce data for restaurant menus, automated data collection can turn fragmented online information into structured business intelligence.
Product Data Scrape continues to help brands build scalable data pipelines designed for faster research, better competitive visibility, and more informed commercial decisions.
Frequently Asked Questions
1. What wine information can be collected from Tabelog?
Depending on availability, datasets can include restaurant names, locations, wine names, prices, serving sizes, alcohol percentages, menu descriptions, ratings, URLs, and other accessible attributes.
2. How can wine data support competitive intelligence?
Structured wine data enables businesses to compare prices, product assortments, restaurant offerings, geographic variations, and changes in menu positioning.
3. Can the data collection be automated?
Yes. Automated workflows can be configured for recurring collection, processing, validation, normalization, and structured delivery based on project requirements.
4. Can Product Data Scrape monitor restaurants across Japan?
Yes. A scalable workflow can be designed to cover selected restaurants, locations, regions, or categories, subject to source availability and project scope.
5. What formats can the final dataset support?
Data can be structured for analytical workflows and delivered in formats appropriate for spreadsheets, databases, dashboards, APIs, or other downstream systems.


 Singapore
 EMAIL
EMAIL
 PHONE
PHONE















.webp)






