Introduction
To build a reliable European B2B prospect database, businesses should collect company identities, product categories, distribution roles, locations, websites, and verified business contact details from authorized sources, then standardize the records for lead generation. Scrape Pan-European B2B database of food & beverage workflows help manufacturers, wholesalers, distributors, importers, and FMCG companies identify relevant commercial partners across European markets. Combining company intelligence with industrial B2B & MRO data can also help suppliers serving food-processing plants, packaging operations, and industrial procurement teams identify complementary opportunities.
The European market offers a substantial research opportunity. According to Eurostat’s Key Figures on the European Food Chain: 2025 Edition, the EU had approximately 309,000 food and beverage processing enterprises in 2023. These businesses employed 4.8 million people and generated €298.6 billion in value added. The sector represented 14.3% of manufacturing enterprises. Source: Eurostat.
For sales and market research teams, however, a large company universe is useful only when the records support practical decisions. A manufacturer looking for regional distributors needs different attributes from a wholesaler seeking new suppliers or a beverage brand researching retail channels.
A well-designed database should therefore distinguish manufacturers, importers, exporters, distributors, wholesalers, retailers, and food-service suppliers. It should also retain country-specific business identifiers, product categories, source references, and verification dates. This makes prospect lists easier to segment, update, and validate while reducing duplicate outreach and irrelevant leads.
How can businesses identify food and beverage companies across European markets?
European Food Beverage Data Scraping can help sales teams assemble a structured view of companies operating across food processing, beverages, wholesale distribution, packaging, ingredients, and related services. Instead of collecting company names alone, the process should capture the attributes needed to qualify a prospect.
Useful fields include legal company name, trading name, country, city, business website, company registration identifier where available, product category, distribution role, and publicly listed business contact information. Product-specific fields may include ingredient types, packaging formats, certifications, and export markets where these details are publicly documented.
Market segmentation matters because the European food sector includes businesses of very different sizes. Eurostat reports that 95.8% of EU food and beverage processing enterprises in 2023 were micro or small businesses employing fewer than 50 people. Large companies, despite representing a smaller share of businesses, accounted for 56.8% of food-processing value added and 65.2% of beverage-processing value added. Source: Eurostat.
This makes company size and business role useful segmentation variables. A packaging supplier might prioritize large processors with extensive operations, while a regional ingredient distributor could focus on smaller manufacturers with specialized product requirements.
The phrase Eastern Europe Fixes Market Intelligence can be treated as a regional research objective: compare company coverage across Central and Eastern European markets, validate local-language company names, and normalize addresses and product categories. It should not be interpreted as a verified market statistic.
| Year | Verified EU food and beverage processing indicator | Business implication |
|---|
| 2020–2022 | Comparable figures are not reproduced here without a verified, consistent series | Build historical coverage only from validated source records |
| 2023 | Approximately 309,000 enterprises | Establish a sector-level company-universe benchmark |
| 2024 | No comparable enterprise count cited here | Validate newer structural business statistics before updating |
| 2025 | Eurostat’s food-chain publication provides sector context | Use as a reference for market segmentation |
| 2026 | Full-year enterprise statistics are not yet available | Continue collecting and validating current records |
The recommended output is a searchable database with country, sector, company-size, and supplier-role filters rather than an unverified list of businesses.
What should a high-quality company database contain?
B2B Food Database Extraction should produce records that help users decide whom to contact and why. A database with thousands of company names but no reliable classification can increase research time rather than improve sales productivity.
The first step is to define the target audience. Food manufacturers may need ingredient suppliers, co-packers, packaging manufacturers, and logistics providers. Beverage brands may prioritize distributors, importers, hospitality suppliers, and retail-channel partners. Wholesalers may instead need manufacturers with specific product lines and export capabilities.
Relevant attributes include company name, country, business type, product range, website, public business email, telephone number where published, and source URL. Additional fields should be collected only when they are relevant, available, and permitted by the source.
Digital commerce provides context for this work. Eurostat reported that 22.0% of EU enterprises had e-commerce sales in 2020, rising to 22.8% in 2021 and 22.9% in 2022. The 2022 figure varied substantially by country: Lithuania recorded 38.9%, Sweden 38.1%, and Denmark 36.7%. These figures cover enterprises generally, not exclusively food businesses. Sources: Eurostat 2020, Eurostat 2021, and Eurostat 2022.
| Year | EU enterprises conducting online sales | Interpretation |
|---|
| 2020 | 22.0% | Online selling was already a meaningful business channel |
| 2021 | 22.8% | The share increased modestly |
| 2022 | 22.9% | Online sales adoption continued |
| 2023 | 23.83% | Eurostat’s e-sales series reports continued growth |
| 2024 | 23.59% | A slight decline from 2023 |
| 2025–2026 | Check the latest Eurostat release and definitions before comparison | Do not substitute estimates for published figures |
The 2023–2024 values refer to the share of enterprises with e-sales in Eurostat’s time series; the survey reference year and reporting year should be checked when reproducing the figures. Source: Eurostat e-commerce statistics.
Quick commerce & FMCG data can complement the company database by adding information about product availability, pack sizes, listed prices, and distribution channels where authorized data sources provide those fields. These product-level observations should remain separate from company-registration records so analysts can distinguish a verified business fact from a changing product or price observation.
How can trade directories improve supplier discovery and price research?
European Food Trade Directory Scraping can help procurement and commercial teams identify suppliers by product category, country, and distribution role. Trade directories may contain company descriptions, product specializations, locations, certifications, and contact information. The coverage and freshness of those fields vary by source, so each record should retain its origin and last verification date.
A useful workflow starts with defined product categories, such as dairy, bakery ingredients, packaged foods, beverages, frozen products, confectionery, and food-processing supplies. Analysts can then map suppliers against target countries and distinguish manufacturers from intermediaries.
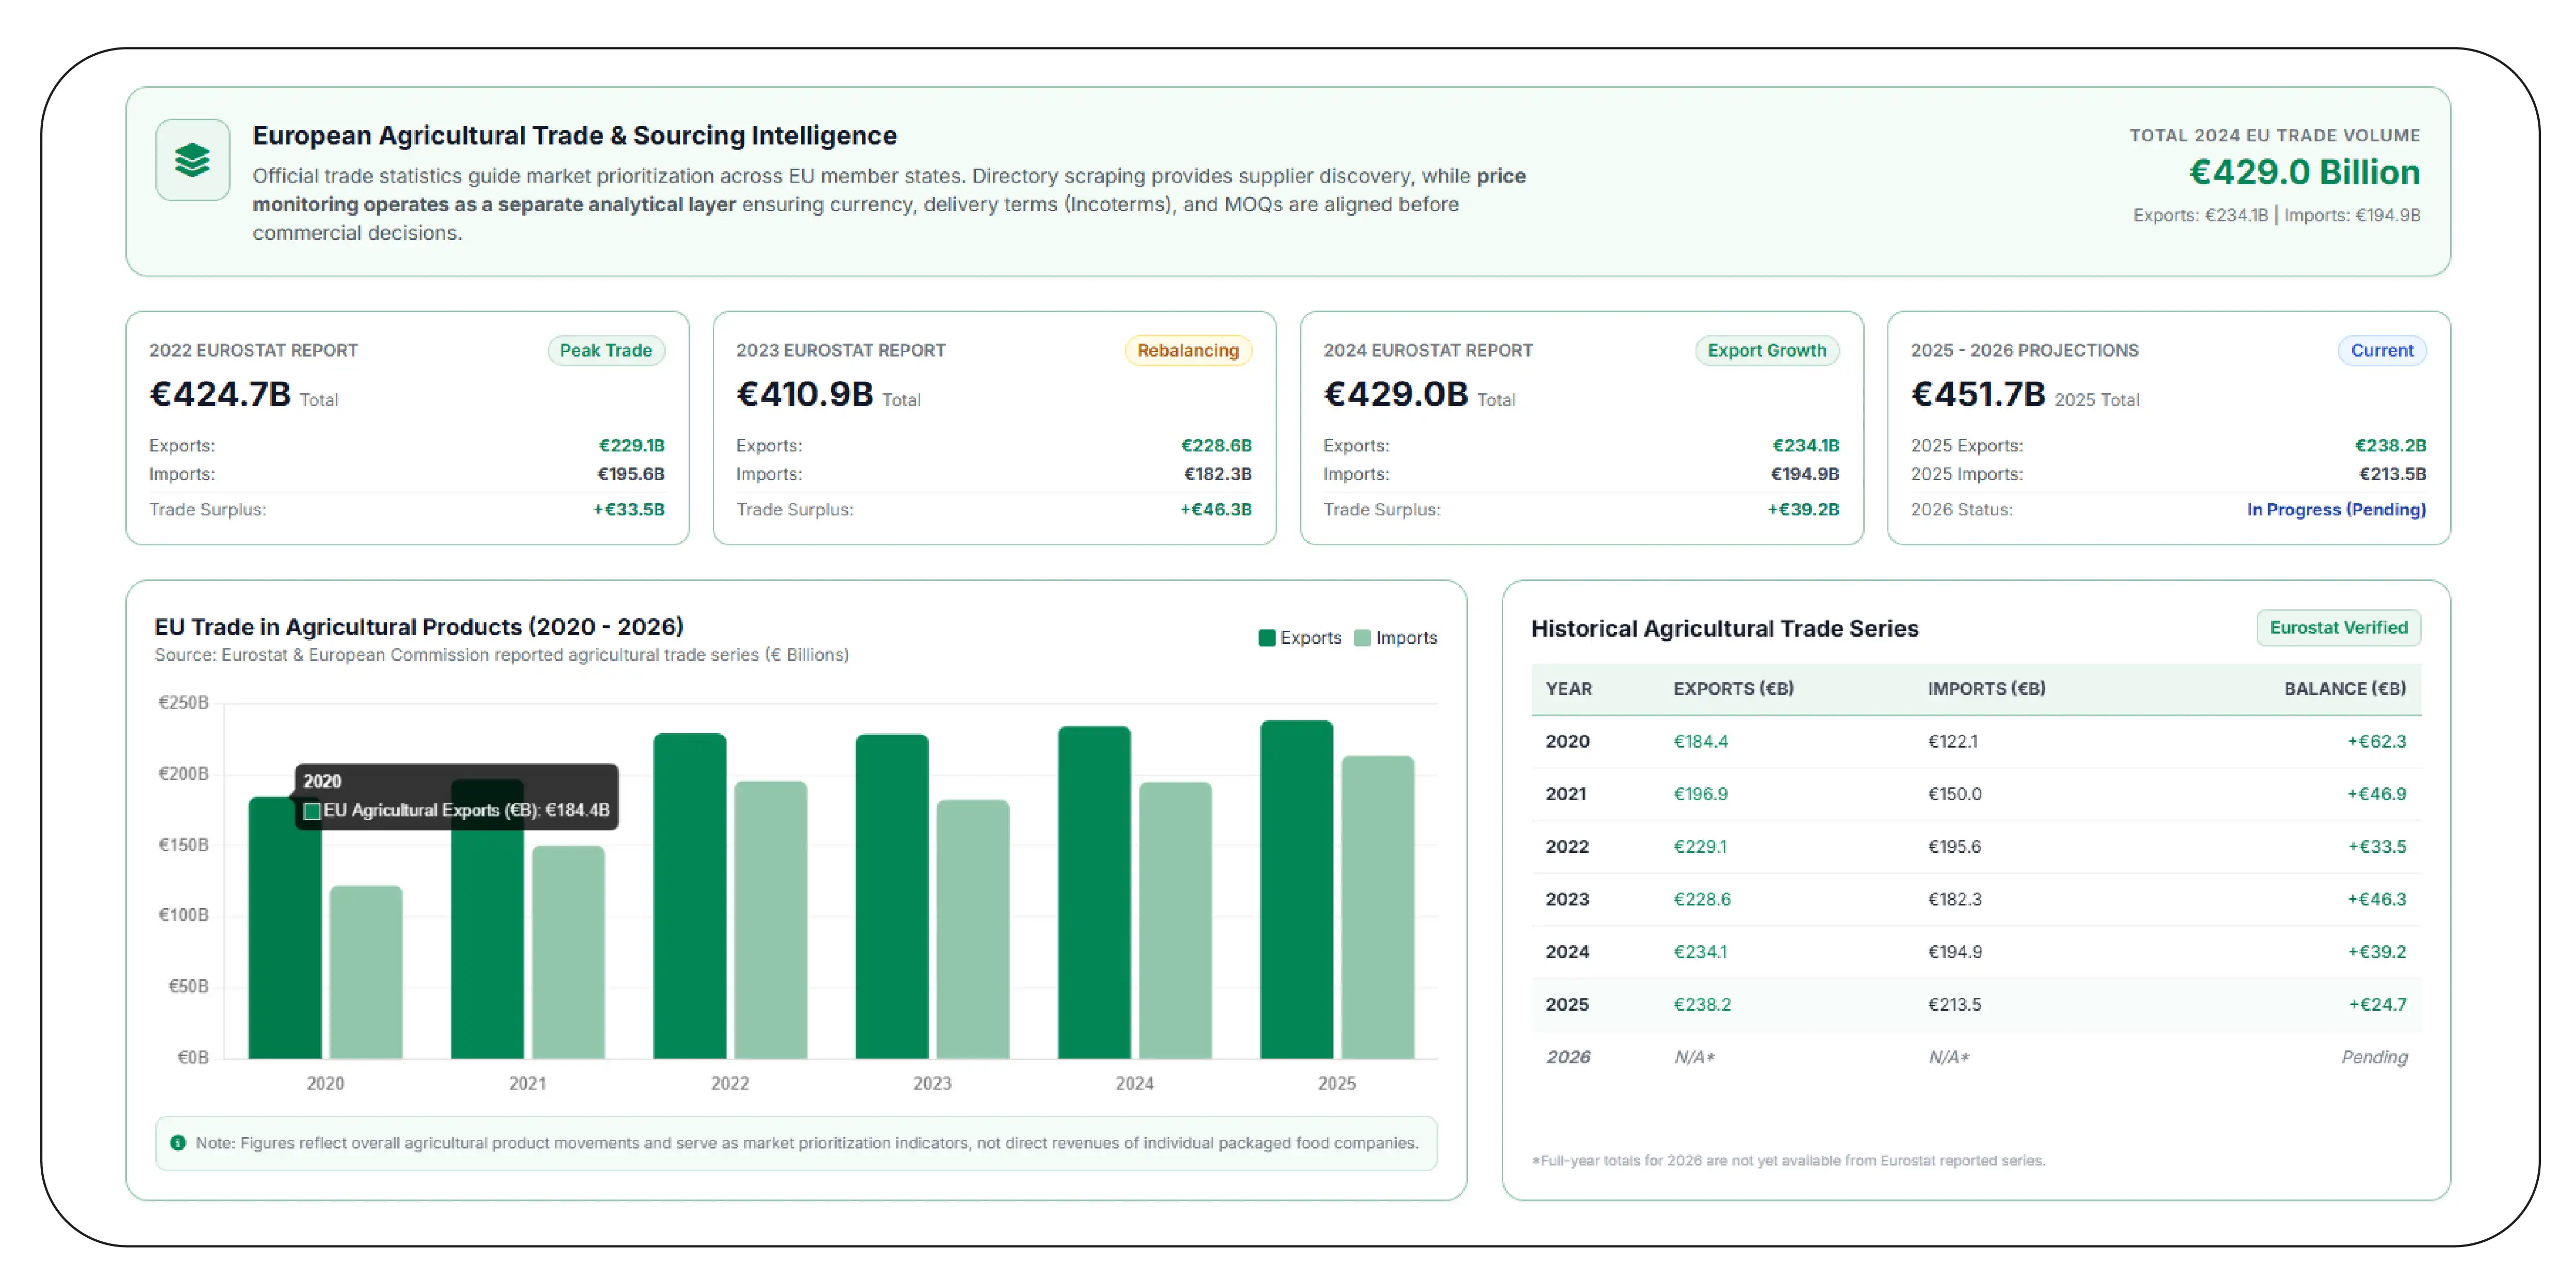
Official trade statistics can guide market prioritization. Eurostat reported that EU trade in agricultural products reached €424.7 billion in 2022, including €229.1 billion in exports and €195.6 billion in imports. In 2023, the total was €410.9 billion, comprising €228.6 billion in exports and €182.3 billion in imports. In 2024, exports rose to €234.1 billion and imports to €194.9 billion. Sources: Eurostat 2022, Eurostat 2023, and Eurostat 2024.
| Year | EU agricultural exports | EU agricultural imports | Trade balance |
|---|
| 2020 | €184.4 billion | €122.1 billion | €62.3 billion |
| 2021 | €196.9 billion | €150.0 billion | €46.9 billion |
| 2022 | €229.1 billion | €195.6 billion | €33.5 billion |
| 2023 | €228.6 billion | €182.3 billion | €46.3 billion |
| 2024 | €234.1 billion | €194.9 billion | €39.2 billion |
| 2025 | €238.2 billion | €213.5 billion | €24.7 billion |
| 2026 | Full-year total not yet available | Full-year total not yet available | Not yet available |
Sources: Eurostat and the European Commission’s reported agricultural-trade series. Figures are for agricultural products and should not be interpreted as a standalone measure of packaged food and beverage company sales. 2025 source.
Price monitoring should be treated as a separate analytical layer. Directory records can identify suppliers, while permitted product sources may supply current list prices, package sizes, minimum-order quantities, and price dates. Analysts should compare prices only when currency, quantity, product specification, delivery terms, and tax treatment are sufficiently consistent.
This distinction helps procurement teams avoid treating a directory listing as proof that a supplier currently stocks a product or offers a particular price.
How should companies monitor FMCG businesses and beverage brands over time?
Pan-European FMCG Company Data Monitoring is most useful when a company dataset is maintained as a series of dated observations rather than a one-time export. Businesses change names, launch new product lines, update websites, appoint distributors, and enter or leave markets. A monitoring process should record these changes without overwriting the historical evidence.
For food and beverage brands, useful fields include company identity, brand name, product category, country, distribution role, website, and verified public contact information. If product-level sources are available and authorized, the dataset can also track package formats, product descriptions, and country-specific availability.
The scale of European food processing supports this approach. Eurostat’s 2025 food-chain publication reports approximately 309,000 EU food and beverage processing enterprises in 2023, with 4.8 million people employed and €298.6 billion in value added. It also notes that most processors primarily serve local or national markets, while a smaller number of large enterprises operate global brands. Source: Eurostat.
A monitoring system should prioritize changes with business relevance: a new distribution market, a revised product range, a change in company status, a newly listed supplier category, or a change to a published business contact. Every change should include a timestamp and source reference.
| Monitoring dimension | Recommended update | Why it matters |
|---|
| Company identity | When a source changes | Prevents duplicate or outdated records |
| Product category | On a verified change | Supports accurate segmentation |
| Distribution footprint | When new evidence appears | Helps identify expansion opportunities |
| Public business contacts | Periodic verification | Reduces failed outreach |
| Product and price data | At a source-appropriate frequency | Supports comparisons over time |
| Source and retrieval date | Every collection cycle | Enables audits and traceability |
Q-Commerce Beverage Brand Data Scraping can support research into beverage products offered through quick-commerce channels, provided collection follows the relevant platform’s terms and applicable law. Brand-level company records and product-level listings should be linked through stable identifiers where possible, but they should not be treated as interchangeable evidence.
Which supplier attributes make prospecting more effective?
B2B Food Supplier Attribute Data Scraping should focus on the information that helps a buyer assess commercial fit. A list of company names is only the starting point. A useful record can include the supplier’s product specialization, country, operating locations, manufacturing or distribution role, website, available business contact details, and relevant certifications where publicly documented.
The same company may operate in several roles, such as manufacturer, importer, distributor, or private-label producer. Those roles should be stored as separate attributes when verified, not inferred from a generic description. Country and region names should also be standardized to make cross-market filters reliable.
The importance of accurate company classification is clear from the scale and diversity of the sector: Eurostat’s 2023 data records approximately 309,000 food and beverage processors, and 95.8% of them were micro or small businesses. A broad prospecting strategy that treats all companies as equivalent is unlikely to serve every sales team equally well. Source: Eurostat.
The exact phrase Scrape Pan-European B2B database of food & beverage describes a collection objective, not a guarantee that every company or attribute is available from one source. In practice, businesses may need to combine official business registers, trade associations, company websites, public directories, and other authorized sources.
A robust supplier dataset should include these quality controls:
- Identity validation: retain the original company name and a normalized form.
- Duplicate detection: use reliable identifiers where available, supported by name and address matching.
- Attribute provenance: store a source for each important field where practical.
- Freshness indicators: record when each observation was collected and last checked.
- Confidence labels: distinguish verified details from incomplete or unconfirmed fields.
- Privacy safeguards: limit personal data collection to what is necessary and lawfully permitted.
This approach supports better prospect prioritization and makes the database easier to maintain as businesses expand across borders.
How can beverage trade records support cross-border expansion?
Beverage Trade Database Scraping can help beverage producers, importers, wholesalers, and distributors map potential partners across European markets. Useful research fields include beverage category, company role, operating country, product specialization, public website, and available business contact information. Where permitted sources provide it, additional fields may include packaging type, export markets, or brand representation.
Trade statistics can help teams frame their market research, but they cannot identify individual buyers by themselves. The European Commission reported that EU agricultural exports reached €238.2 billion in 2025, while imports reached €213.5 billion. The resulting surplus was €24.7 billion. These figures cover agricultural products broadly, rather than beverage trade alone. Source: Eurostat.
For a beverage company, the next step is to narrow the analysis by product category and target market. Alcoholic beverages, soft drinks, bottled water, coffee, tea, and functional beverages have different distribution structures and regulatory considerations. An appropriate prospect list should reflect those differences.
| Research question | Data needed | Recommended action |
|---|
| Which markets are relevant? | Trade statistics and country-level business records | Rank countries by product-specific opportunity |
| Which companies distribute the category? | Verified company role and product specialization | Segment potential distributors |
| Which prospects match the product? | Category, pack format, and channel fit | Prioritize qualified leads |
| Is the information current? | Source URL and verification timestamp | Recheck before outreach |
| Can the product be sold in the market? | Applicable product and labeling requirements | Verify regulatory obligations separately |
The exact phrase Scrape Pan-European B2B database of food & beverage also captures a continuing maintenance requirement: company information needs to be refreshed as source records change. No single directory should be assumed to cover every European country or every beverage category.
A strong research process combines verified company records with product-specific trade statistics, transparent sourcing, and human review of priority leads. This produces a more defensible prospecting resource than a large but unvalidated contact list.
Why choose a specialist data partner?
A useful data partner should deliver more than raw records. It should help define the target market, identify appropriate sources, standardize company fields, remove duplicates, preserve source references, and establish a realistic update schedule. Food Wholesaler Listing Scraper workflows can support supplier discovery and channel mapping when they are built around verified business attributes and permitted sources.
For buyers, the practical value lies in a dataset that can be segmented by country, product category, supplier role, and company characteristics. Clear documentation, freshness indicators, and consistent delivery formats make the information easier to use in sales systems and market research workflows.
Conclusion
A well-structured European food and beverage database helps manufacturers, distributors, wholesalers, and market researchers find relevant companies, compare markets, and organize cross-border prospecting. Reliable results depend on accurate company classification, traceable sources, current business details, and careful separation of company records from product and price observations.
For categories requiring additional regulatory care, Alcohol & Liquor Data Scraping should use appropriate authorized sources and account for applicable age, advertising, product, and market-specific rules. Businesses should validate supplier and buyer suitability before acting on collected records.
Ready to develop a tailored European B2B research dataset? Contact Product Data Scrape to discuss authorized data collection, supplier discovery, company intelligence, and lead-generation requirements for your target markets!
FAQs
1. What information should a European food and beverage B2B database include?
It should include verified company names, countries, business roles, product categories, websites, available public business contacts, source references, and verification dates.
2. Can company data be collected from every European country?
Coverage depends on available sources, language, access restrictions, and applicable laws. Validate country coverage before treating a dataset as pan-European.
3. How often should B2B company records be updated?
Update frequency depends on business needs and source changes. Review priority contacts regularly and preserve timestamps so users can identify stale records.
4. Can Product Data Scrape support customized company datasets?
Yes. Product Data Scrape can scope a dataset around selected countries, supplier types, product categories, verified fields, and delivery requirements, subject to source availability and permissions.
5. How can businesses improve lead quality?
Define an ideal customer profile, verify company roles and product fit, remove duplicates, prioritize target markets, and validate business contacts before outreach.


 Singapore
 EMAIL
 PHONE










.webp)