Introduction
"Is quick commerce more expensive than the supermarket?"
It is the most asked question in grocery retail data, it is asked by consumers, brands, operators, journalists, and regulators, and the honest answer is that it depends almost entirely on how you measure — to the point where a competent analyst can produce either conclusion from the same underlying data without doing anything dishonest.
That is not a reason to avoid the question. It is a reason to be extremely explicit about method, because the methodological choices are the analysis. Four decisions determine the answer, and a comparison that does not state all four is not a comparison anyone should quote.
This guide covers those four decisions, how to build a q-commerce vs supermarket pricing comparison that holds up, and what the data reveals once the comparison is done properly.
Why the Two Channels Are Structurally Hard to Compare
Before the method, the obstacles — because each one is a place the comparison silently breaks.
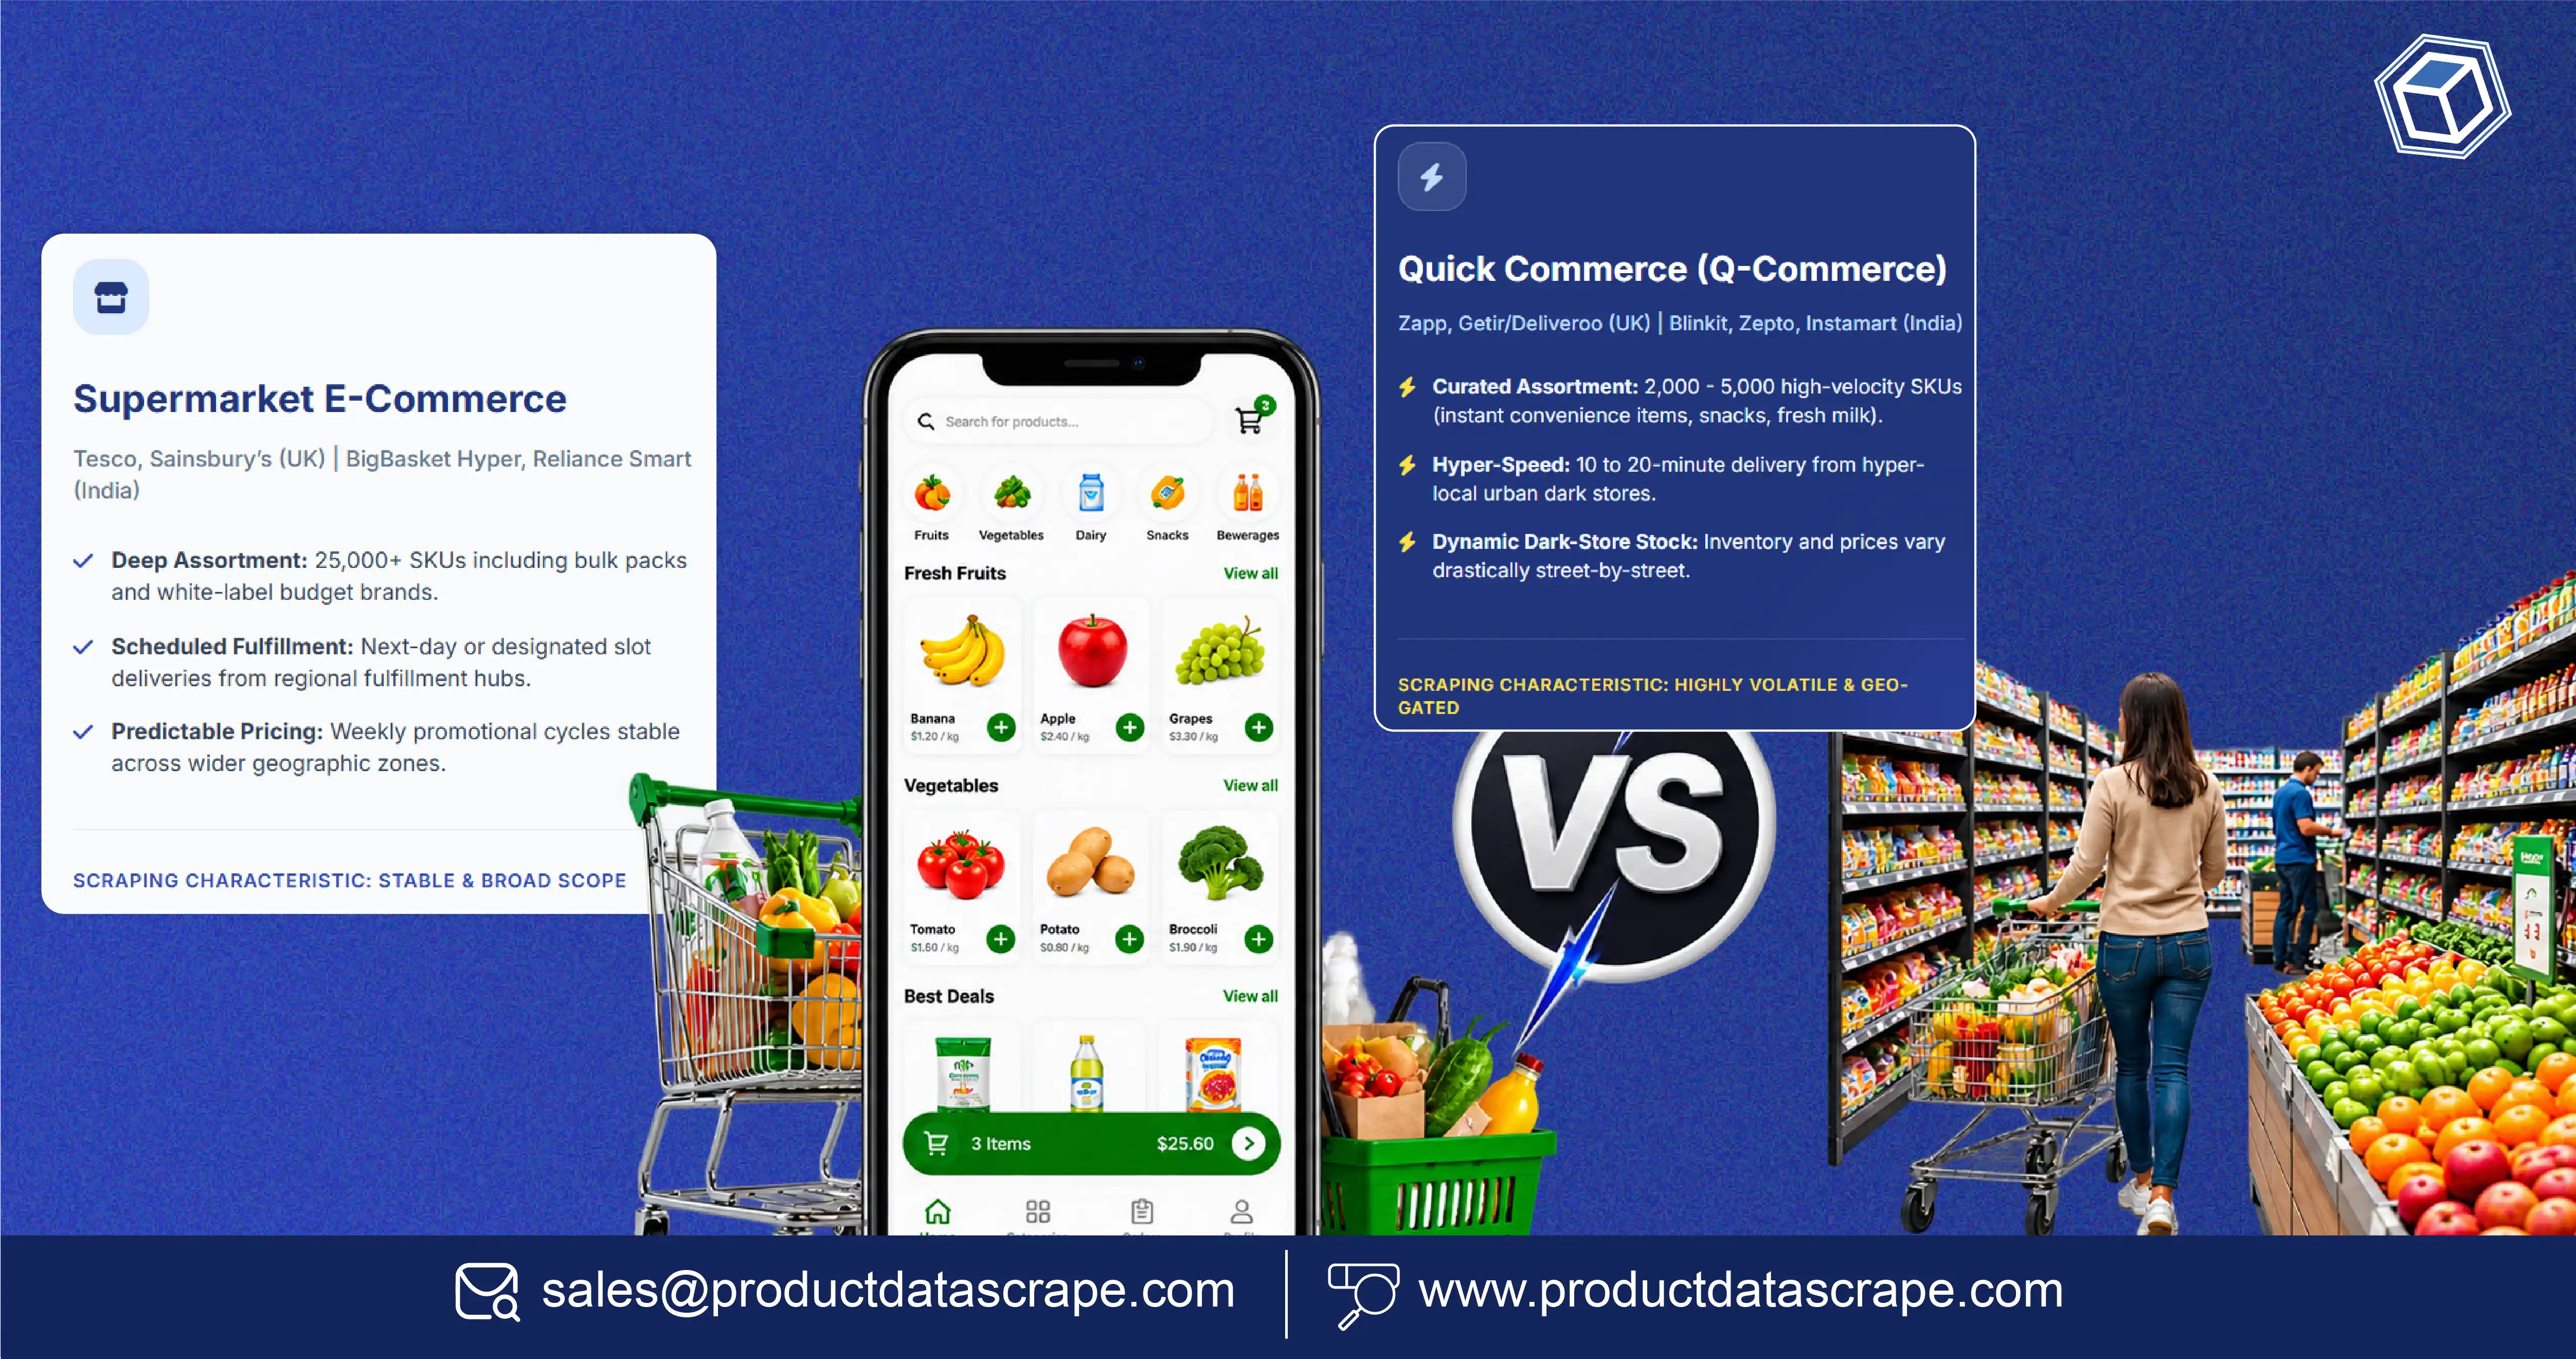
They stock different pack sizes. Quick commerce is built around immediate consumption and small baskets. It carries smaller packs, single units, and convenience formats. Supermarkets carry family and bulk formats. The same brand's product frequently exists in both channels at different sizes, and comparing them as "the same product" is the single most common error in this analysis.
They carry different assortments. Q-commerce ranges are narrower — typically a curated selection of high-velocity SKUs. A meaningful share of any supermarket basket simply does not exist in the q-commerce catalogue.
They have different cost structures at checkout. The listed price is not the paid price in either channel, but the gap is much larger in q-commerce: delivery fees, small-basket fees, surge or peak-time fees, rain or late-night surcharges, and membership programmes that remove some or all of these.
Their prices move on different rhythms. Q-commerce pricing can vary by time of day and demand conditions in ways supermarket shelf pricing does not.
They are local in different ways. Q-commerce prices and availability vary by dark store and delivery zone; supermarket prices vary by store and region. Matching geography between them is a deliberate design decision, not an automatic one.
The Four Decisions That Determine the Answer
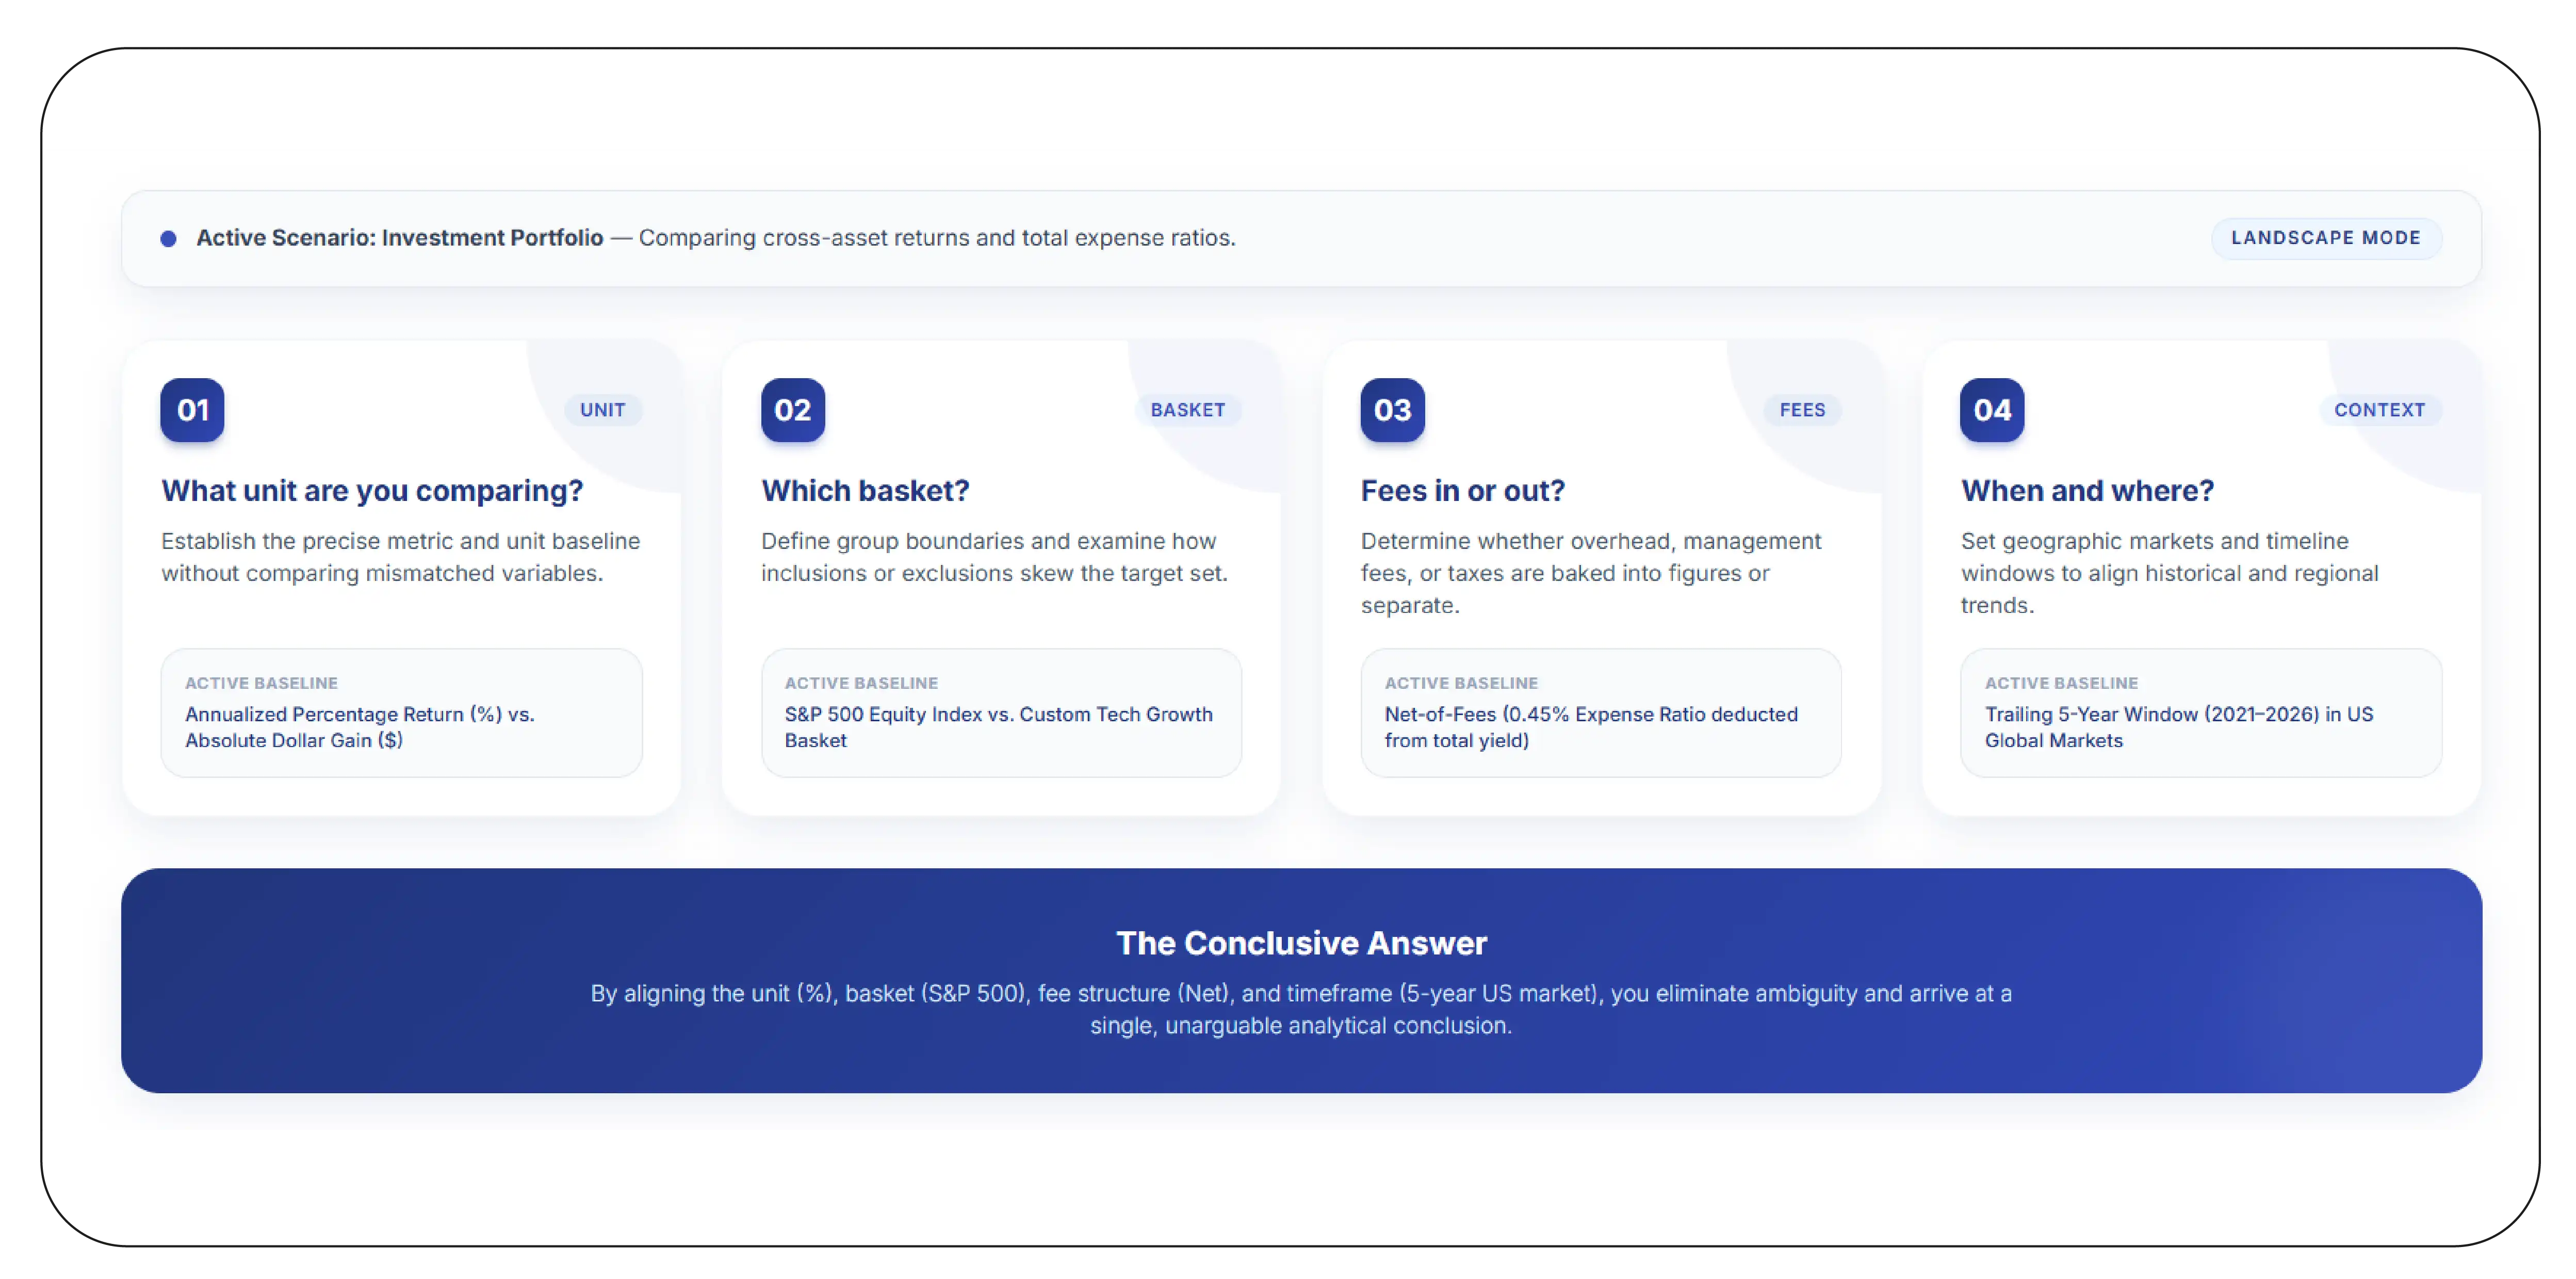
Decision one: what unit are you comparing?
This is the decision that changes the answer most.
Compare listed pack prices and quick commerce usually looks cheaper, because its packs are smaller and cheaper per pack. Compare unit-normalised prices — per kilogram, per litre, per 100 grams — and the picture frequently reverses, because the smaller pack carries a higher unit price.
Neither is wrong. They answer different questions. Pack price answers "what will I spend today?" Unit price answers "what am I paying for the product?" A comparison must state which it is using, and a serious analysis reports both.
The non-negotiable part: if you are comparing unit prices, every price must be normalised with the raw pack size retained so the normalisation can be audited. Unit-price comparisons that cannot be traced back to pack sizes are not checkable, and unverifiable comparisons in this space have a poor track record.
Decision two: which basket?
Because assortments differ, you have three options, and they produce different answers.
The intersection basket — only SKUs available in both channels. This is the cleanest like-for-like comparison and the one most defensible for a pricing claim. Its limitation is that it excludes exactly the products where the channels differ most, which biases toward similarity.
The representative basket — a basket reflecting typical purchasing in each channel, accepting that the contents differ. This answers "what does a typical shop cost in each channel?" — a genuinely useful consumer question — but it is not a price comparison, it is a basket cost comparison, and conflating the two is a common error.
The category basket — matched at category level with the closest available equivalent in each channel. A middle path, requiring explicit and documented matching rules.
None is correct in the abstract. All three are legitimate. The failure is not choosing badly; it is not saying which one you chose.
Decision three: fees in or out?
Q-commerce listed prices exclude the delivery economics that are central to the channel. Supermarket prices exclude the cost of getting to the store, which is real but not chargeable.
A listed-price-only comparison understates q-commerce cost, sometimes substantially. A fee-inclusive comparison requires assumptions — basket size, time of day, membership status — each of which moves the answer.
The workable approach is to report a fee-inclusive effective basket cost with the assumptions stated explicitly, alongside the listed-price comparison. And to model more than one scenario, because a small late-night basket and a large mid-afternoon membership basket are genuinely different economics, not a rounding difference.
Decision four: when and where?
Q-commerce prices can vary by time of day and demand conditions. Supermarket shelf prices vary by store and region. A comparison that captures q-commerce at peak surge and supermarket prices on a quiet Tuesday is measuring the capture schedule.
Capture both channels simultaneously, at matched locations, across multiple times of day, and report the variation rather than a single point.
Sample Data: A Matched Intersection Basket
An illustrative same-day, same-location comparison of an intersection basket, normalised to unit prices.
| Product |
Q-commerce pack |
Q-comm price |
Q-comm per kg/L |
Supermarket pack |
Super price |
Super per kg/L |
Unit gap |
| Toned milk |
500 ml |
32 |
64.0 |
1 L |
62 |
62.0 |
+3.2% |
| Atta |
1 kg |
62 |
62.0 |
5 kg |
265 |
53.0 |
+17.0% |
| Sunflower oil |
1 L |
148 |
148.0 |
1 L |
142 |
142.0 |
+4.2% |
| Toor dal |
500 g |
88 |
176.0 |
1 kg |
165 |
165.0 |
+6.7% |
| Biscuits |
120 g |
30 |
250.0 |
300 g |
65 |
216.7 |
+15.4% |
| Tea |
250 g |
165 |
660.0 |
500 g |
310 |
620.0 |
+6.5% |
| Basket (unit-weighted) |
|
|
|
|
|
|
+8.9% |
Illustrative figures.
Read the fourth-from-last column carefully. On listed pack price, quick commerce is cheaper on every single line — 32 against 62 for milk, 62 against 265 for atta. On unit price, it is more expensive on every line, by between 3% and 17%.
Both statements are true simultaneously. They are not in tension; they are answers to different questions. This single table is why "is q-commerce more expensive?" cannot be answered without stating the unit.
Note also where the gap is widest: atta and biscuits, the two lines where the pack-size difference is largest. The unit-price premium is essentially a function of pack size, which is a much more useful finding than a single blended number — it says the channel premium is concentrated in categories where q-commerce sells small and supermarkets sell bulk.
Now the fee layer, on the same basket:
| Scenario |
Basket subtotal |
Delivery fee |
Small-basket fee |
Surge |
Effective total |
vs supermarket |
| Supermarket |
1,009 |
— |
— |
— |
1,009 |
baseline |
| Q-comm, large basket, off-peak, member |
525 |
0 |
0 |
0 |
525 |
— |
| Q-comm, same basket unit-matched, off-peak, member |
1,099 |
0 |
0 |
0 |
1,099 |
+8.9% |
| Q-comm, same basket unit-matched, peak, non-member |
1,099 |
35 |
0 |
25 |
1,159 |
+14.9% |
| Q-comm, small basket, peak, non-member |
180 |
35 |
30 |
15 |
260 |
n/a — different basket |
Illustrative figures.
The third and fourth rows are the honest comparison: the same quantity of the same goods, from the same locations, on the same day. The premium is 8.9% before fees and 14.9% for a non-member at peak.
The last row is included to show what an unmatched comparison looks like — a small q-commerce basket at 260 against a supermarket basket at 1,009 is not a price finding, it is a basket-size finding, and it is the shape of a great many published comparisons.
The structured record:
{
  "comparison_id": "qc-vs-super-2026-07-15",
  "captured_at": "2026-07-15T15:00:00+05:30",
  "capture_window_minutes": 30,
  "location_id": "IN-560001",
  "basket_type": "intersection",
  "basket_size_skus": 6,

  "line_item": {
    "product_name": "Atta",
    "brand": "brand_a",
    "q_commerce": {
      "platform": "qc_platform_1",
      "pack_size_value": 1,
      "pack_size_unit": "kg",
      "listed_price": 62,
      "price_per_kg": 62.0,
      "availability_state": "in_stock"
    },
    "supermarket": {
      "retailer": "retailer_a",
      "pack_size_value": 5,
      "pack_size_unit": "kg",
      "listed_price": 265,
      "price_per_kg": 53.0,
      "availability_state": "in_stock"
    },
    "unit_price_gap_pct": 17.0
  },

  "fee_model": {
    "scenario": "peak_non_member",
    "delivery_fee": 35,
    "small_basket_fee": 0,
    "surge_fee": 25,
    "membership_applied": false
  },

  "methodology": {
    "unit": "normalised_per_kg_or_litre",
    "basket": "intersection_only",
    "fees": "included_scenario_modelled",
    "capture": "simultaneous_matched_location"
  }
}
The methodology block is not decoration. In this particular analysis it is the most important object in the record, because it is what allows anyone to know what the number means.
What the Data Reveals When Done Properly
A unit-price premium exists and is real, but it is concentrated. It is widest in categories where pack-size divergence is largest — bulk staples, large-format packaged goods — and narrow to negligible in categories where both channels sell the same pack.
Fees matter more than the price gap for small baskets. On a small basket, delivery and small-basket fees can exceed the entire unit-price premium. On a large basket with membership, they can vanish. Any single "q-commerce is X% more expensive" figure is a statement about a specific basket size and membership status, whether or not it admits it.
Time of day is a real variable in q-commerce and largely not one in supermarket shelf pricing. Comparisons at a single point in time miss this asymmetry.
Availability differs and affects the comparison. If a basket item is out of stock in one channel, excluding it silently changes the basket. Availability has to be captured and reported alongside price, and exclusions have to be documented.
Assortment is the deeper story. The intersection basket is frequently a minority of either channel's range. The channels are not primarily competing on price for identical goods; they are offering different propositions. A price comparison is a real but partial account of the difference.
Who Uses Q-Commerce vs Supermarket Price Scraping
FMCG brands manage pricing and pack architecture across channels — deciding what pack sizes to place in q-commerce, and understanding how their unit price is perceived when a small pack sits beside a supermarket bulk format.
Q-commerce operators benchmark their unit-price position against supermarkets on a matched basket, which is the comparison their customers are implicitly making.
Supermarket and retailer teams measure their price position against the fastest-growing competing channel.
Consumer researchers, journalists, and regulators need this comparison to be methodologically defensible, because it is used in public argument — which is precisely why the four decisions have to be stated.
Economists and inflation analysts track channel price divergence as a component of measured food price movement.
Frequently Asked Questions
Which channel is actually cheaper?
On listed pack price, q-commerce frequently appears cheaper because its packs are smaller. On unit price, a premium is typical, concentrated in categories with large pack-size differences. Once fees are included, the answer depends on basket size, time of day, and membership. Any single answer that does not state those conditions is incomplete.
How do you handle different pack sizes?
Unit normalisation — per kilogram, per litre, per 100 grams — with the raw pack size retained on every record so the normalisation is auditable.
Can delivery fees be captured?
Yes, and modelled as scenarios: basket size, time of day, and membership status each change the effective cost, so a single fee number would be misleading.
Can both channels be captured at the same time?
Yes. Simultaneous capture at matched locations is a requirement, not an option — otherwise the comparison partly measures the capture schedule.
Does this work outside India?
Yes. The same structure applies in the UK and other markets with an established quick-commerce sector; the platforms differ, the four methodological decisions do not.
State the Method, Then State the Finding
This is a question where the method is not a preliminary to the analysis — it is the analysis. Unit or pack. Intersection, representative, or category basket. Fees in or out. Matched timing and location or not. Four decisions, and the answer moves substantially with each one.
Comparisons that state all four are useful to a brand, an operator, a researcher, and a regulator alike. Comparisons that state none are quotable and unreliable, and there are a great many of them.
Product Data Scrape delivers q-commerce vs supermarket price scraping across India, the UK, and other markets: simultaneous matched-location capture, unit-price normalisation with raw pack sizes retained, intersection and category basket construction, delivery and platform fee capture with scenario modelling, time-of-day series, and availability state on every record.
Delivered as JSON, CSV, via REST API, or pushed to your warehouse — with the methodology documented on the dataset, because in this comparison the method is the finding.
Ask us to build a matched basket for your categories and your locations. We will tell you what it shows, and under exactly which assumptions.
Product Data Scrape — turning marketplace complexity into decision-ready data.


 Singapore
 EMAIL
EMAIL
 PHONE
PHONE

















.webp)






