Introduction
Availability is the most consequential number in retail that almost nobody measures properly.
A product that is out of stock does not generate a lost-sale record. It does not appear in a sales report as a negative. It produces, in most reporting systems, exactly nothing — a silence that looks identical to low demand. Which means the single largest source of preventable revenue loss in grocery retail is, in the systems most teams rely on, invisible by construction.
Public listing data changes that. Every marketplace, every retailer site, and every quick-commerce app publishes, continuously and openly, whether a given product can be bought right now. Captured systematically over time, out-of-stock data scraping turns that signal into a measurable series — and it answers questions that internal systems structurally cannot.
But it is also one of the easiest datasets in retail to measure badly. This guide covers what out-of-stock data scraping genuinely reveals, the definitional and methodological traps that make most availability numbers meaningless, and what the data can and cannot honestly support.
The Definition Problem Nobody Resolves First
Before any number is useful, one question has to be answered: what counts as out of stock?
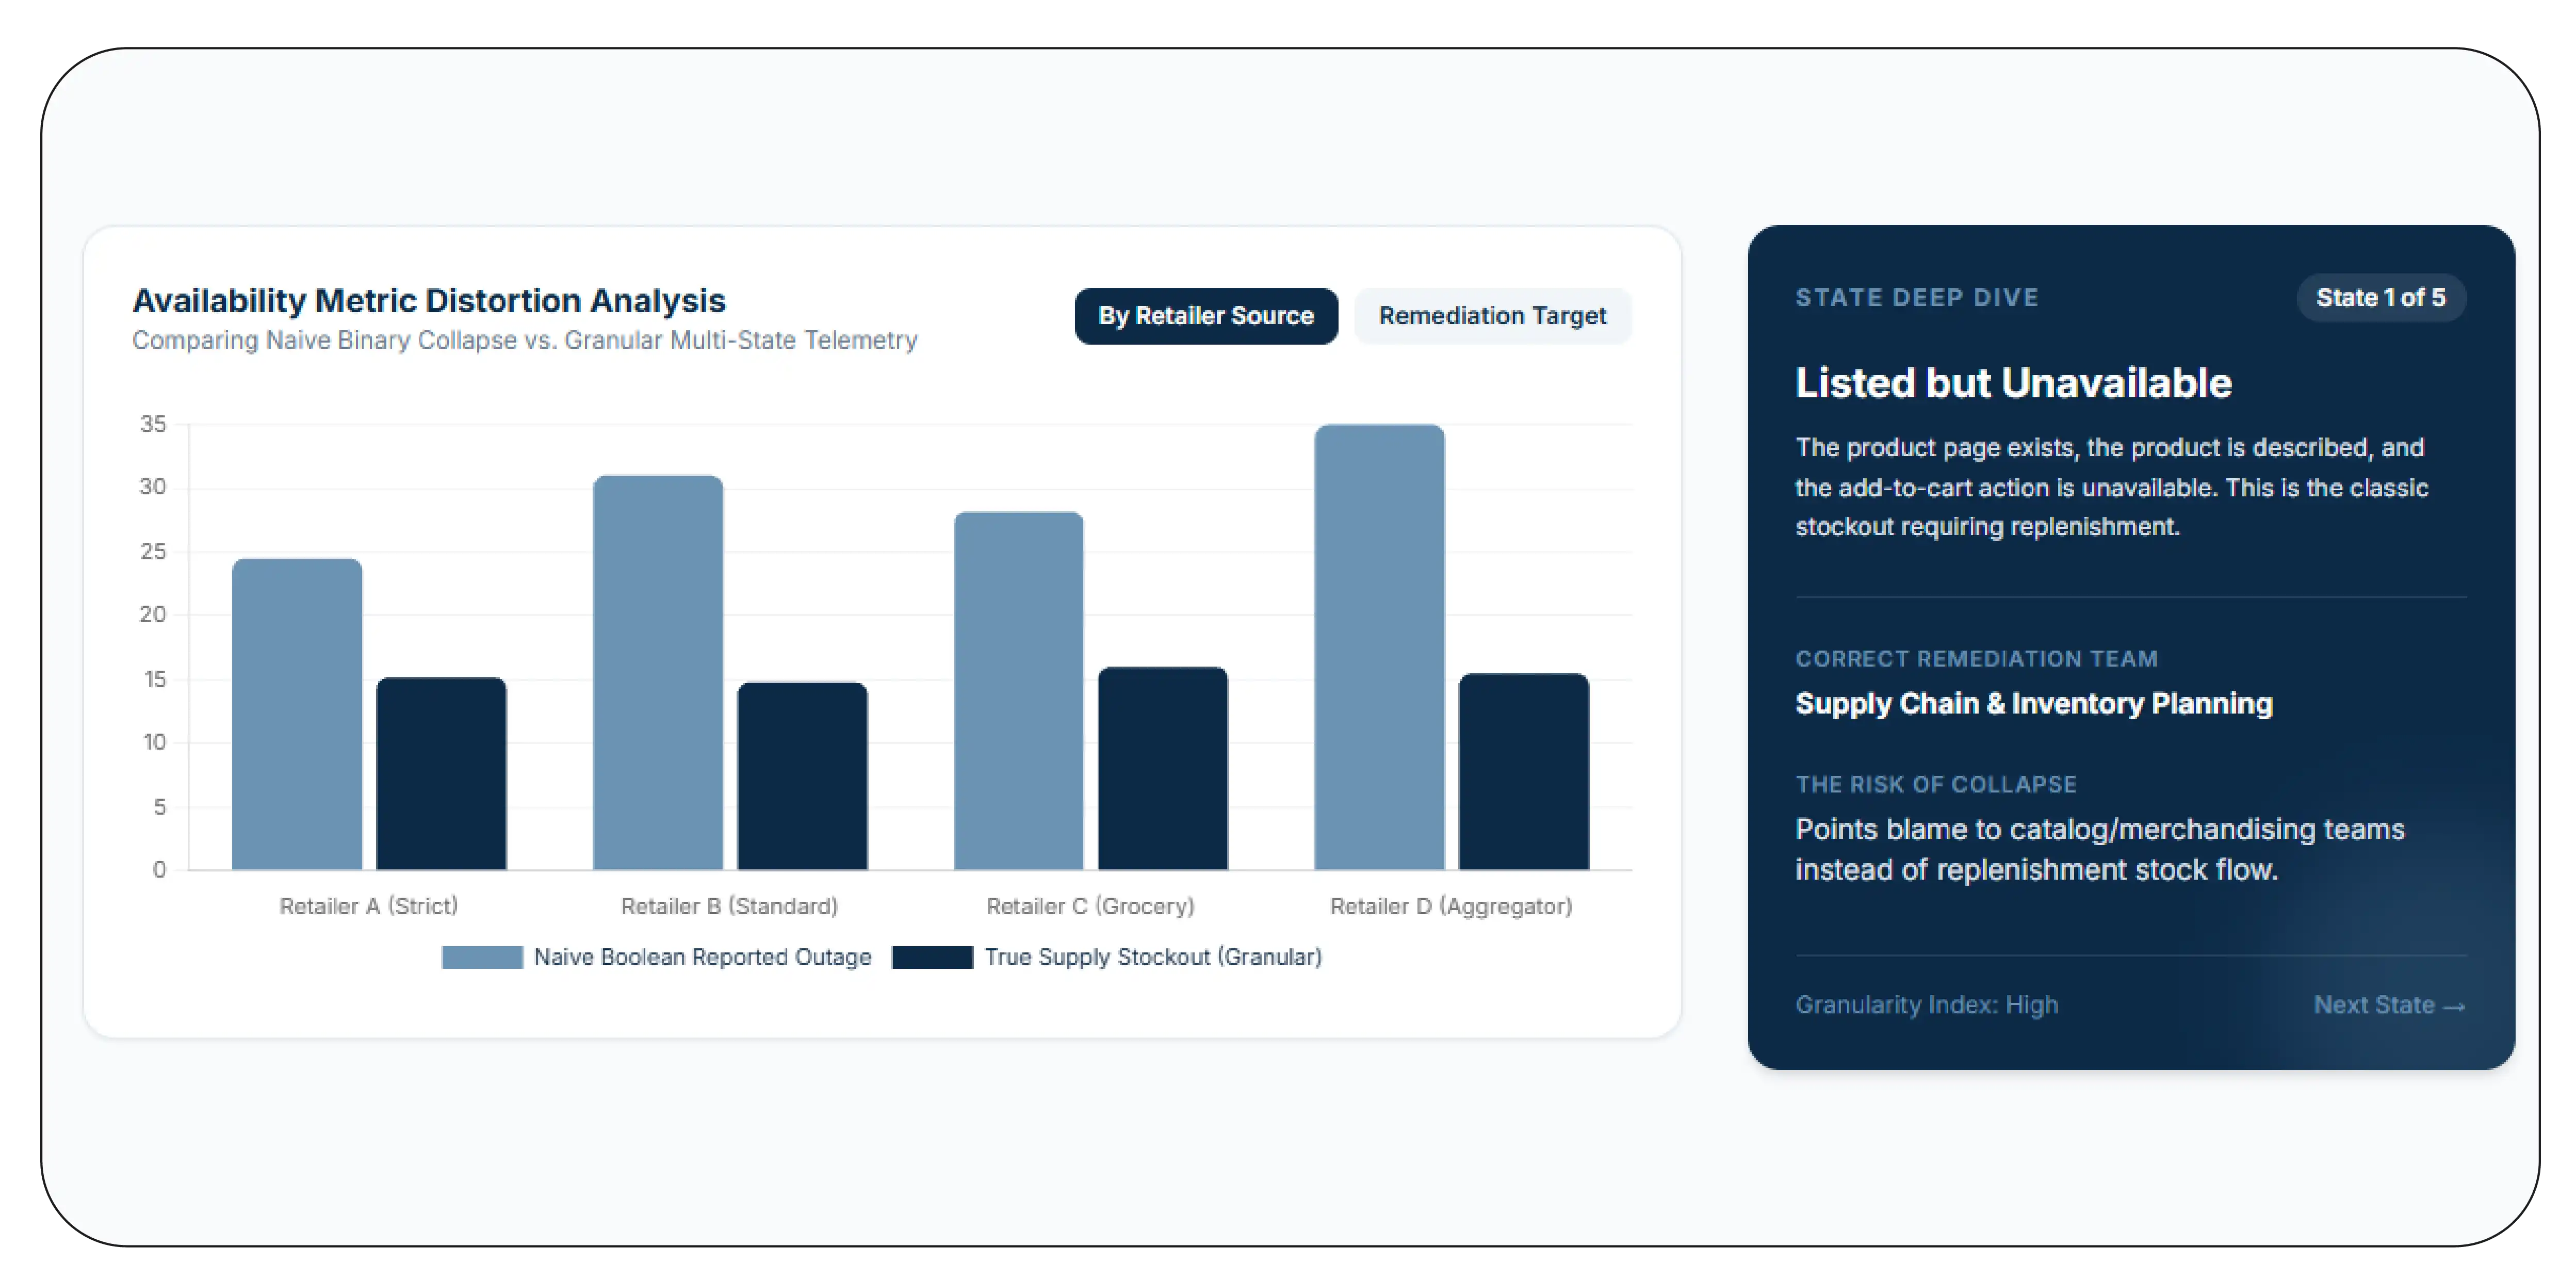
This sounds pedantic. It is the single biggest source of incomparable availability figures in the industry, because at least five distinct states get collapsed into one label.
Listed but unavailable. The product page exists, the product is described, and the add-to-cart action is unavailable. This is the classic stockout.
Delisted. The product page has disappeared entirely. This is not a stockout — it is an assortment change, and it is permanent rather than temporary. Counting delistings as stockouts inflates your availability problem and points remediation at the wrong team.
Unavailable at this location. The product is available nationally and not deliverable to a given pincode, zip code, or store. Whether this is a "stockout" depends entirely on whose question you are answering. For a shopper in that location, it is. For a national supply chain view, it may not be.
Available but not purchasable. The listing is live and something else blocks the purchase — a minimum basket not met, a delivery slot unavailable, a fulfilment restriction. The product is in stock and the customer still cannot buy it.
Substituted. In grocery specifically, some retailers surface a substitute rather than an unavailable state. The original product is out; the interface does not present it as out.
A serious availability dataset captures these as distinct states, not as a single boolean. The moment they are collapsed, comparisons across retailers, regions, or time periods stop meaning anything, because different sources collapse them differently.
Snapshot Rates Versus Time-Weighted Rates
Here is the methodological error that appears in most availability reporting, including a good deal of published research.
An out-of-stock "rate" of 4% can mean two entirely different things.
Snapshot rate. At the moment of capture, 4% of monitored SKUs were unavailable. This is what you get from a daily 6 a.m. crawl.
Time-weighted rate. Across the measurement period, monitored SKUs were unavailable for 4% of total available-hours. This is what you get from continuous capture.
These diverge dramatically, and they diverge in a direction that matters. Consider two products over a week:
| Product |
Stockout pattern |
Snapshot rate (daily 6am capture) |
Time-weighted rate |
| Product A |
Out of stock all day Wednesday |
~14% (1 of 7 captures) |
~14% |
| Product B |
Out of stock 5–9 p.m. every evening |
0% (never out at 6 a.m.) |
~17% |
Illustrative.
Product B is unavailable more of the time than Product A, and it is unavailable specifically during peak grocery shopping hours. A daily morning capture reports it as perfectly available. Not approximately available — perfectly, 0%.
This is not a hypothetical edge case. Evening and weekend stockouts are the dominant pattern in grocery and quick commerce, because that is when demand concentrates. A measurement regime that captures once daily in the morning is structurally blind to the majority of the availability problem it exists to measure.
The practical rule: capture frequency has to be at least as fast as the phenomenon you are measuring. If stockouts resolve within hours, hourly capture is the floor. Daily capture measures something, but it is not the out-of-stock rate.
What Public Data Can and Cannot Tell You
This is worth stating plainly, because availability data is frequently oversold.
Public listing data reliably tells you:
- Whether a product could be purchased, at a given location, at a given moment
- How long that state persisted, if capture frequency is adequate
- How availability varies across regions, retailers, categories, and time
- Which competing products remained available during a gap
- Whether a product's absence is a stockout or a delisting
Public listing data does not tell you:
- Inventory levels. "In stock" is a binary published state, not a quantity. A product with three units and a product with three thousand look identical.
- Why the stockout occurred. Supply failure, demand spike, forecasting error, logistics disruption, and deliberate allocation decisions all produce the identical observable signal.
- Lost sales. You can infer that demand was unserved. You cannot measure how much without demand data you do not have.
- Whether a substitution was accepted.
Any vendor or analysis claiming to read inventory depth from public listings is either using a retailer-specific quirk that will break, or overstating what the data supports. Product Data Scrape captures availability as the published state it is — with the definitional states separated — and leaves inference about causes to the teams who hold the internal data to test it against.
That boundary matters more than it might seem. Availability data becomes far more valuable when it is trusted, and it is trusted when it does not claim more than it can support.
The Fields That Make Availability Data Usable
| Field |
Why it matters |
| availability_state |
The distinct state, not a boolean — in stock, out of stock, delisted, location-unavailable, substituted |
| captured_at |
Timestamp. Without it, duration cannot be computed and the entire dataset collapses to a snapshot |
| location_id |
Pincode, zip, store, or dark-store identifier. Availability is a local fact |
| stock_signal |
Low-stock indicators where the retailer surfaces them |
| substitute_offered |
Whether an alternative was presented in place of the product |
| product_id, variant_id |
Availability is a per-variant fact; a size or pack being out is invisible at product level |
| seller_id |
On multi-seller listings, availability differs by seller |
| price_at_capture |
Availability and price move together; separating them loses the relationship |
| first_observed_unavailable |
Enables duration and recovery measurement |
The last row is the one that converts a stream of snapshots into an analysable dataset. An availability record without a duration is an anecdote.
Sample Data: One SKU, One Week
An illustrative availability series for a single grocery SKU at one location.
| Capture |
State |
Stock signal |
Substitute offered |
Duration so far |
| Mon 08:00 |
In stock |
Normal |
— |
— |
| Mon 18:00 |
In stock |
Low |
— |
— |
| Mon 21:00 |
Out of stock |
— |
Yes |
0h |
| Tue 08:00 |
In stock |
Normal |
— |
Recovered (~9h gap) |
| Tue 19:00 |
Out of stock |
— |
Yes |
0h |
| Wed 08:00 |
In stock |
Normal |
— |
Recovered (~11h gap) |
| Wed 20:00 |
Out of stock |
— |
Yes |
0h |
| Thu 08:00 |
In stock |
Low |
— |
Recovered (~10h gap) |
Illustrative series.
Read the pattern rather than the rows. This SKU went out of stock three evenings running and recovered by each morning. A daily 08:00 capture would report 100% availability across the entire week. The time-weighted evening availability was materially worse — and the gaps landed squarely in peak shopping hours, with a substitute presented each time, which means demand was not merely delayed but actively redirected to another product.
That is a replenishment-cadence finding: the store is being restocked overnight and running dry before close. It is actionable, it is specific, and it is completely invisible to the measurement regime most teams run.
The structured record at Wednesday 20:00:
{
  "product_id": "GROC-DAIRY-MILK-1L",
  "variant_id": "1L-full-cream",
  "retailer": "retailer_a",
  "location_id": "400001",
  "captured_at": "2026-07-15T20:04:11+05:30",

  "availability_state": "out_of_stock",
  "stock_signal": null,
  "substitute_offered": true,
  "substitute_product_id": "GROC-DAIRY-MILK-1L-ALT",

  "price_at_capture": 74,
  "first_observed_unavailable": "2026-07-15T19:47:00+05:30",

  "competing_products_available": [
    {"product_id": "GROC-DAIRY-MILK-1L-BRANDB", "state": "in_stock", "price": 76},
    {"product_id": "GROC-DAIRY-MILK-1L-BRANDC", "state": "in_stock", "price": 72}
  ]
}
The competing_products_available array is the field most availability datasets omit and the one that carries the most commercial weight. A stockout where every competitor is also out is a category-level supply event. A stockout where two competitors remain available at similar prices is a share transfer — and the second is a far more urgent problem for a brand than the first.
What the Aggregate Data Reveals
Once availability is captured properly, patterns emerge that are consistent enough to plan against.
Availability is not uniform across the day. Evening stockouts dominate in grocery and quick commerce. Any availability figure that does not state its capture times is not comparable to any other.
Availability is intensely local. The same SKU, same retailer, same moment, differs by store and by delivery zone. National averages are the least useful cut of an inherently local dataset — they average a dark store that is chronically short with one that never is, and describe neither.
Availability and price move together. Products frequently go out of stock shortly after a deep promotion. Analysing availability without price is analysing half the system.
Category structure matters more than category label. Short-shelf-life and high-velocity categories — fresh, dairy, bakery — show fundamentally different availability profiles from ambient packaged goods, and comparing their rates directly says more about product characteristics than about retail execution.
Duration distribution beats average duration. Two retailers with the same mean stockout duration can have completely different profiles: one with many short gaps, another with few long ones. The first is a replenishment cadence issue; the second is a supply issue. The mean hides both.
Five Mistakes That Make Availability Numbers Meaningless
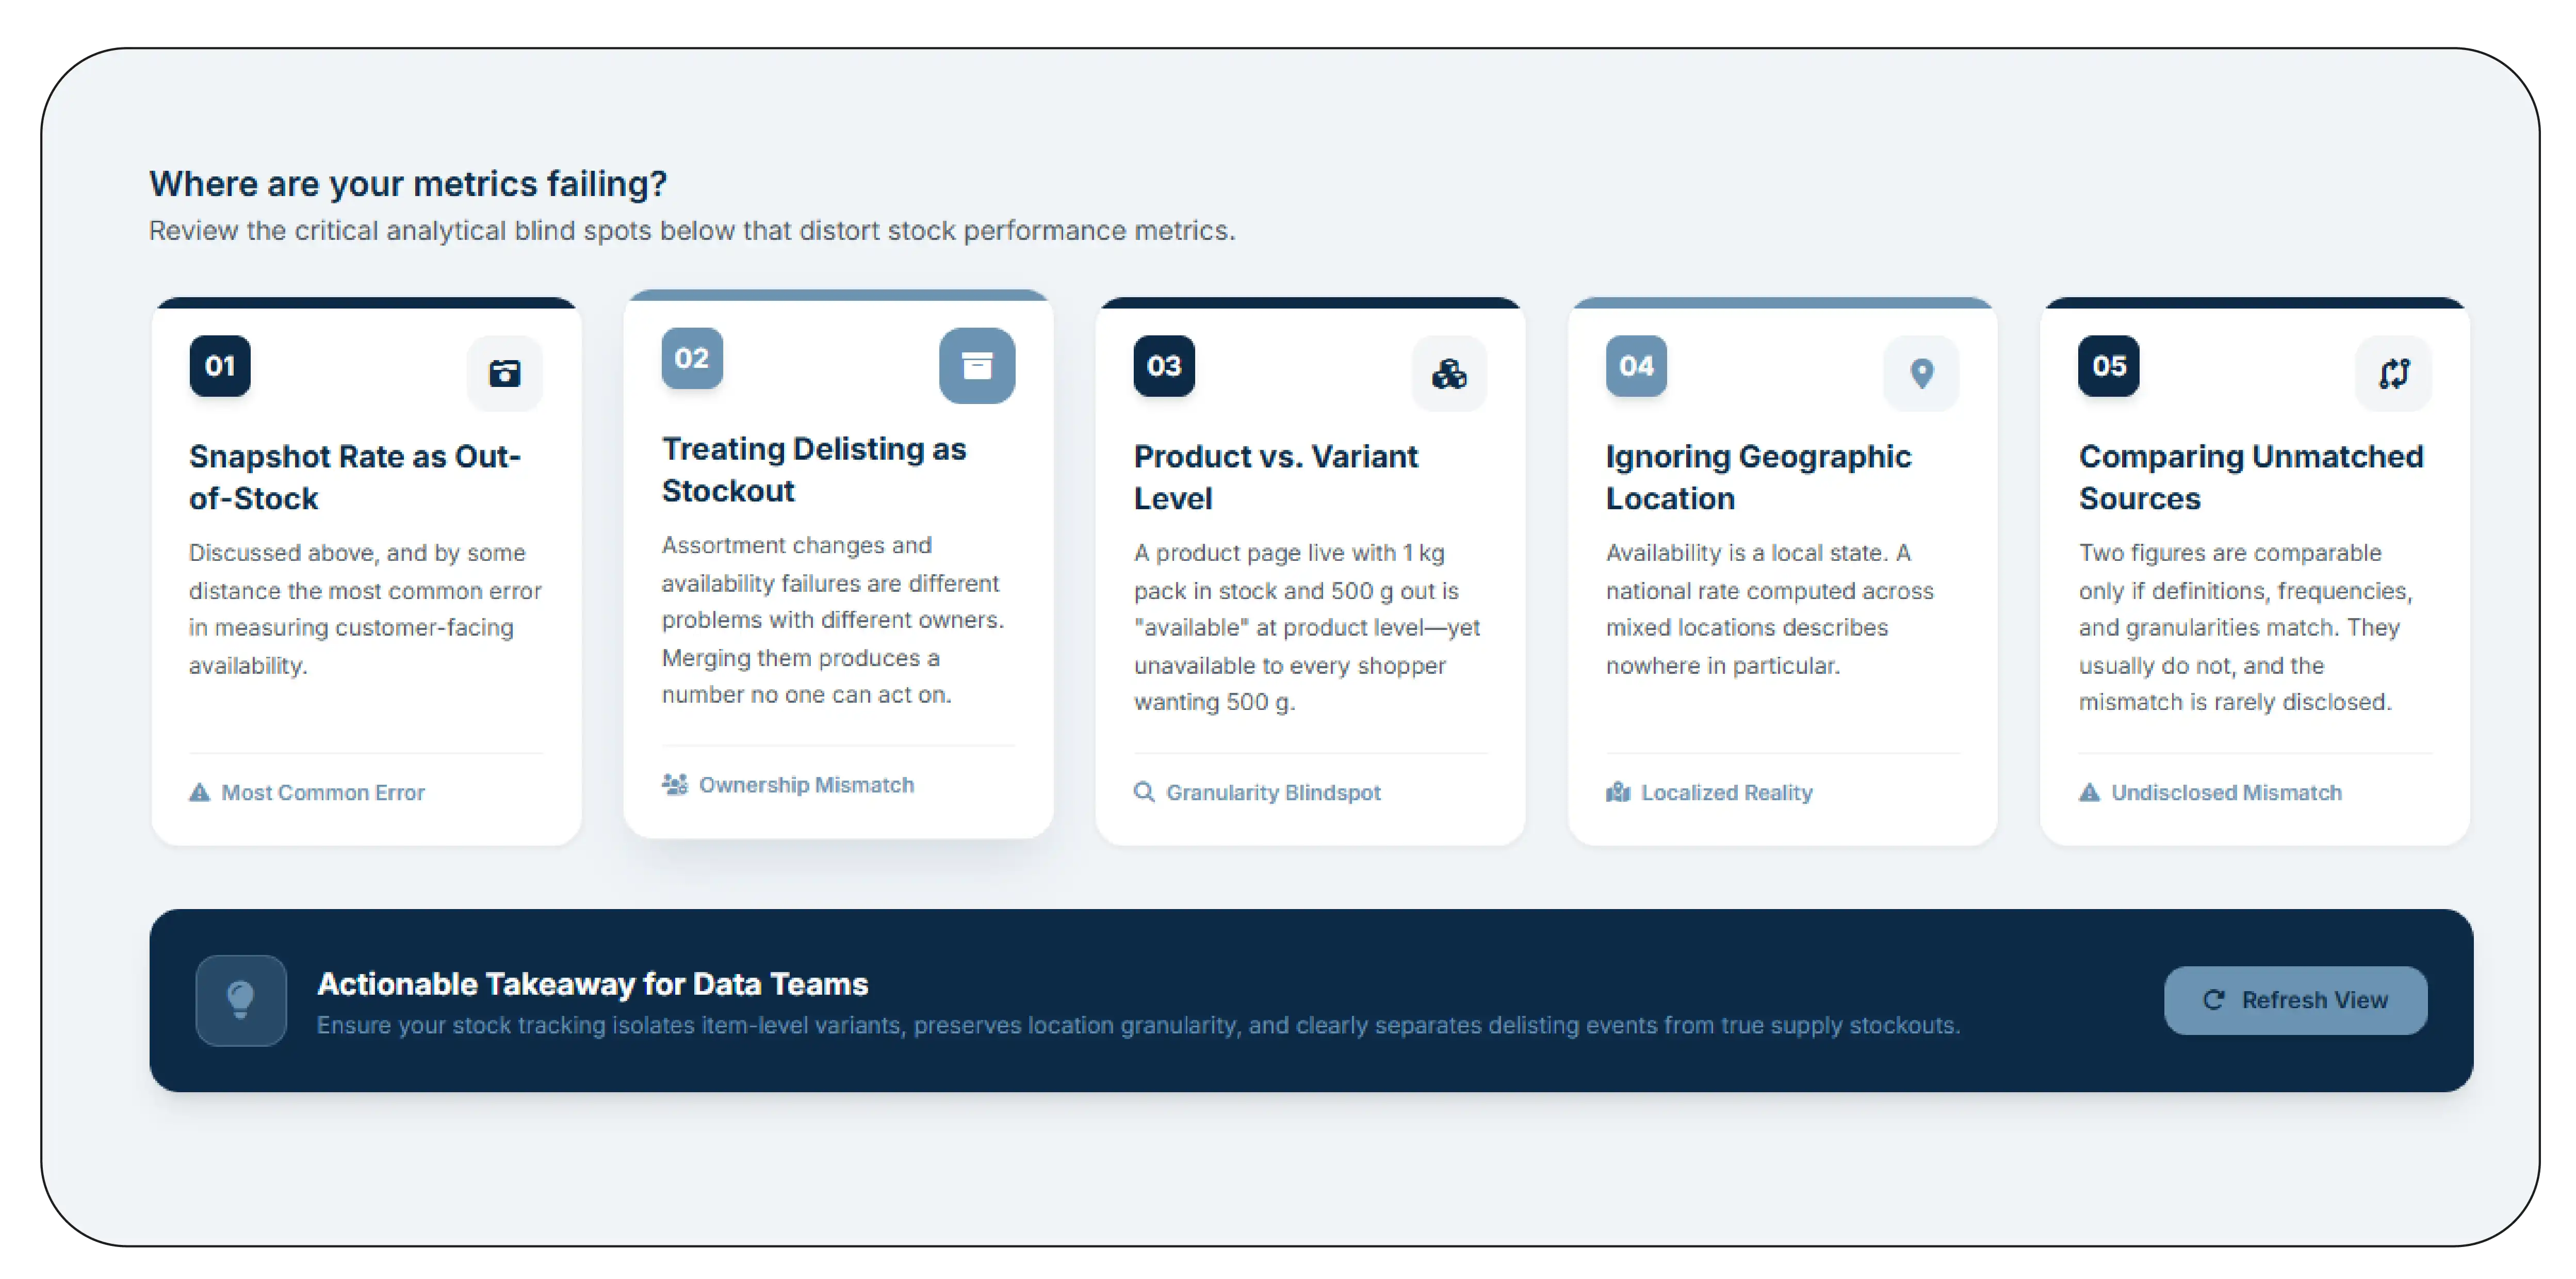
Reporting a snapshot rate as an out-of-stock rate. Discussed above, and by some distance the most common error.
Treating delisting as stockout. Assortment changes and availability failures are different problems with different owners. Merging them produces a number that no one can act on.
Measuring at product level rather than variant level. A product page live with the 1 kg pack in stock and the 500 g pack out is "available" at product level and unavailable to every shopper who wanted 500 g.
Ignoring location. Availability is a local state. A national rate computed across mixed locations describes nowhere in particular.
Comparing across sources with different definitions. Two availability figures from two providers are comparable only if their state definitions, capture frequencies, and location granularity match. They usually do not, and the mismatch is rarely disclosed.
Who Uses Out-of-Stock Data Scraping
FMCG brands measure channel health — where their products are unavailable, how long, how often, and which competitor took the shelf while they were gone. This is the closest thing to on-shelf-availability measurement that exists for e-commerce, and it does not require retailer cooperation.
Retailers and quick-commerce operators benchmark their availability against competitors on a matched basket, which is otherwise unknowable.
Supply chain teams identify replenishment-cadence failures — like the evening-stockout pattern above — that internal inventory systems record as "stock arrived" without noticing it ran out before close.
Researchers and public-interest analysts study availability as an economic and food-access variable, where longitudinal, methodologically transparent data is the entire requirement.
Investors and analysts track availability as an operational signal for retail businesses, where sustained deterioration frequently precedes reported financial effects.
Frequently Asked Questions
How often should availability be captured?
At least hourly for grocery and quick commerce, where stockouts commonly resolve within hours. Daily capture measures something real but should not be called an out-of-stock rate.
Can you tell how much stock is left?
No. Public listings publish a state, not a quantity. Where a retailer surfaces a low-stock indicator, that is captured as its own field — but it is a signal, not an inventory count.
Can availability be captured per location?
Yes, and it should be. Availability is a local fact; location granularity is not an enhancement, it is a requirement.
How do you handle substitutions?
As a distinct state with the substitute recorded, because a stockout that redirects a shopper to another product has a different commercial consequence from one that simply blocks the purchase.
Is this data suitable for published research?
It can be, provided the methodology is stated — state definitions, capture frequency, location granularity, and panel composition. Availability figures without those disclosures are not reproducible.
Measure the Silence
The reason availability goes unmeasured is not that it is unimportant. It is that a stockout produces no record. It is an absence, and absences do not report themselves.
Public listing data is the one source that observes the absence directly — at the moment it happens, at the location it happens, for as long as it lasts, alongside every competing product that stayed available. Captured with adequate frequency and honest definitions, it turns the largest silent loss in retail into a measurable, segmentable, addressable number.
Product Data Scrape delivers out-of-stock data scraping across grocery retailers, marketplaces, and quick-commerce platforms: distinct availability states rather than a boolean, hourly or faster capture, location-level granularity, per-variant resolution, substitution capture, duration and recovery measurement, and competing-product availability on every record.
Delivered as JSON, CSV, via REST API, or pushed to your warehouse — with the methodology documented, because an availability number without its method is not a number anyone should act on.
Ask us for an availability audit on your SKUs across the locations that matter to you. We will show you the gaps your daily report cannot see.
Product Data Scrape — turning marketplace complexity into decision-ready data.


 Singapore
 EMAIL
EMAIL
 PHONE
PHONE


.webp "thumb")
.webp "thumb")













.webp)






