Introduction
Quick commerce is not e-commerce delivered faster. It is a different business with a different physics, and it produces a different kind of data.
On a conventional marketplace, a product either exists or it does not, and the answer is broadly the same across the country. On a q-commerce service, a product exists in a dark store, and the dark store serves a radius of a few kilometres. Move two pincodes away and the same SKU may be unavailable, unlisted, or simply not part of that store's assortment at all. Come back four hours later and it may be sold out.
Availability in q-commerce is not a property of the product. It is a property of a location at a moment in time.
This is what makes Flipkart Quick data scraping structurally different from ordinary marketplace scraping — and it is why FMCG brands, competing q-commerce operators, and analysts covering the Indian retail shift all end up needing the same dataset, for different reasons.
What Flipkart Quick Is, and Why Its Data Behaves Differently
Flipkart Quick is Flipkart's rapid-delivery service, operating in major Indian cities through a dark-store network. A dark store is a small fulfilment node — no customers, no shelves for browsing, just densely packed inventory optimised for pick speed.
Four consequences follow directly, and each one breaks an assumption that ordinary marketplace pipelines are built on.
Assortment is curated per store, not national. A dark store holds a fraction of the catalogue Flipkart's main marketplace lists. The selection is a commercial decision made per store, per city, per category. Two stores in the same city can carry different assortments.
Availability is hyperlocal. The same SKU is available in one pincode and unavailable two pincodes away, because one is inside a dark store's serving radius with stock and the other is not.
Availability is ephemeral. Dark store inventory is shallow by design. A SKU can be available at 09:00 and sold out by 14:00, then restocked overnight. A daily capture sees one of those states and reports it as the day's truth.
The competitive set is different. On the main marketplace, a brand competes with other listings. In q-commerce, a brand competes for a physical slot in a small, constrained inventory — and it competes across platforms, against the same slot in a competitor's dark store.
That last point is the one that reframes the whole exercise. Q-commerce is a shelf-space business. It just happens that the shelf is in a warehouse you cannot see.
Why Conventional Product Data Fails Here
A pipeline built for the main marketplace, pointed at Flipkart Quick, produces data that is not merely incomplete but actively misleading.
It captures from one location. Which, on a hyperlocal service, is equivalent to surveying one dark store and calling it national coverage.
It captures once a day. Which, on inventory that turns over within hours, means the stockout that lasted from 11:00 to 22:00 never happened as far as your data is concerned.
It treats absence as absence. But on Flipkart Quick, a SKU can be absent for two entirely different reasons — not stocked in this dark store (an assortment decision) or stocked but sold out (an availability event). These are different problems, owned by different teams, requiring different responses. A pipeline that collapses them into one null field has destroyed the most important distinction in the dataset.
The Fields
| Field |
Description |
| flipkart_quick_eligible |
Whether Quick delivery is offered for this SKU at this location |
| quick_eta_minutes |
The promised delivery window |
| dark_store_available |
Whether stock is present in the serving dark store |
| availability_reason |
Distinguishes not assorted from out of stock |
| quick_price |
The Quick price — which does not always match the main marketplace price |
| pincode, city, locality |
Location resolution |
| assortment_present |
Whether the SKU appears in this store's catalogue at all |
| category_depth |
How many SKUs the store lists in this category — the share-of-shelf denominator |
| pack_sizes_available |
Which pack variants the store carries |
| captured_at |
Timestamp — non-negotiable on volatile inventory |
The two fields that most pipelines omit and that carry most of the value are availability_reason and category_depth.
availability_reason separates a supply problem from a listing problem. category_depth is the denominator without which "share of shelf" is not a metric — it is a number divided by nothing.
Sample Data: One SKU, One City, One Morning
An illustrative capture for a single FMCG SKU across four pincodes in one metro, at two times of day.
| Pincode |
Locality type |
Time |
Quick Eligible |
Assorted |
In Stock |
ETA |
Quick Price |
Reason |
| 560001 |
Central |
09:15 |
Yes |
Yes |
Yes |
11 min |
245 |
— |
| 560001 |
Central |
18:40 |
Yes |
Yes |
No |
— |
— |
out_of_stock |
| 560034 |
Inner |
09:15 |
Yes |
Yes |
Yes |
14 min |
245 |
— |
| 560034 |
Inner |
18:40 |
Yes |
Yes |
Yes |
19 min |
245 |
— |
| 560064 |
Outer |
09:15 |
Yes |
No |
— |
— |
— |
not_assorted |
| 560064 |
Outer |
18:40 |
Yes |
No |
— |
— |
— |
not_assorted |
| 562130 |
Periphery |
09:15 |
No |
— |
— |
— |
— |
no_quick_coverage |
| 562130 |
Periphery |
18:40 |
No |
— |
— |
— |
— |
no_quick_coverage |
Illustrative series.
Three completely different problems, all of which a single-location daily pipeline would have reported as "available, 245."
- 560001 — an availability problem. The SKU is assorted and sells out by evening. This is a replenishment conversation with the store, and it is losing the brand the entire evening peak.
- 560064 — an assortment problem. The SKU is not in the store's catalogue at all. No amount of replenishment fixes this. This is a listing and trade conversation.
- 562130 — not a brand problem at all. Flipkart Quick does not serve this area. Correctly excluded from the denominator.
Conflating these three is the single most common analytical error we see in q-commerce reporting, and it produces trade conversations that go nowhere because they are aimed at the wrong party.
The JSON for the 560001 evening capture:
{
  "product_id": "FMCG7K2QP9WZXY",
  "title": "BrandY Premium Snack, 150 g",
  "brand": "BrandY",
  "captured_at": "2026-07-14T18:40:12+05:30",
  "pincode": "560001",
  "city": "Bengaluru",
  "locality_type": "central",

  "flipkart_quick_eligible": true,
  "assortment_present": true,
  "dark_store_available": false,
  "availability_reason": "out_of_stock",
  "quick_eta_minutes": null,
  "quick_price": null,
  "main_marketplace_price": 249,

  "category_depth": 84,
  "brand_skus_assorted_in_category": 3,
  "share_of_assortment_pct": 3.6,

  "pack_sizes_available": [],
  "pack_sizes_assorted": ["150g", "80g"]
}
Note share_of_assortment_pct. That is the q-commerce metric that matters, and it is computable only when category_depth is captured.
What the Data Actually Tells You
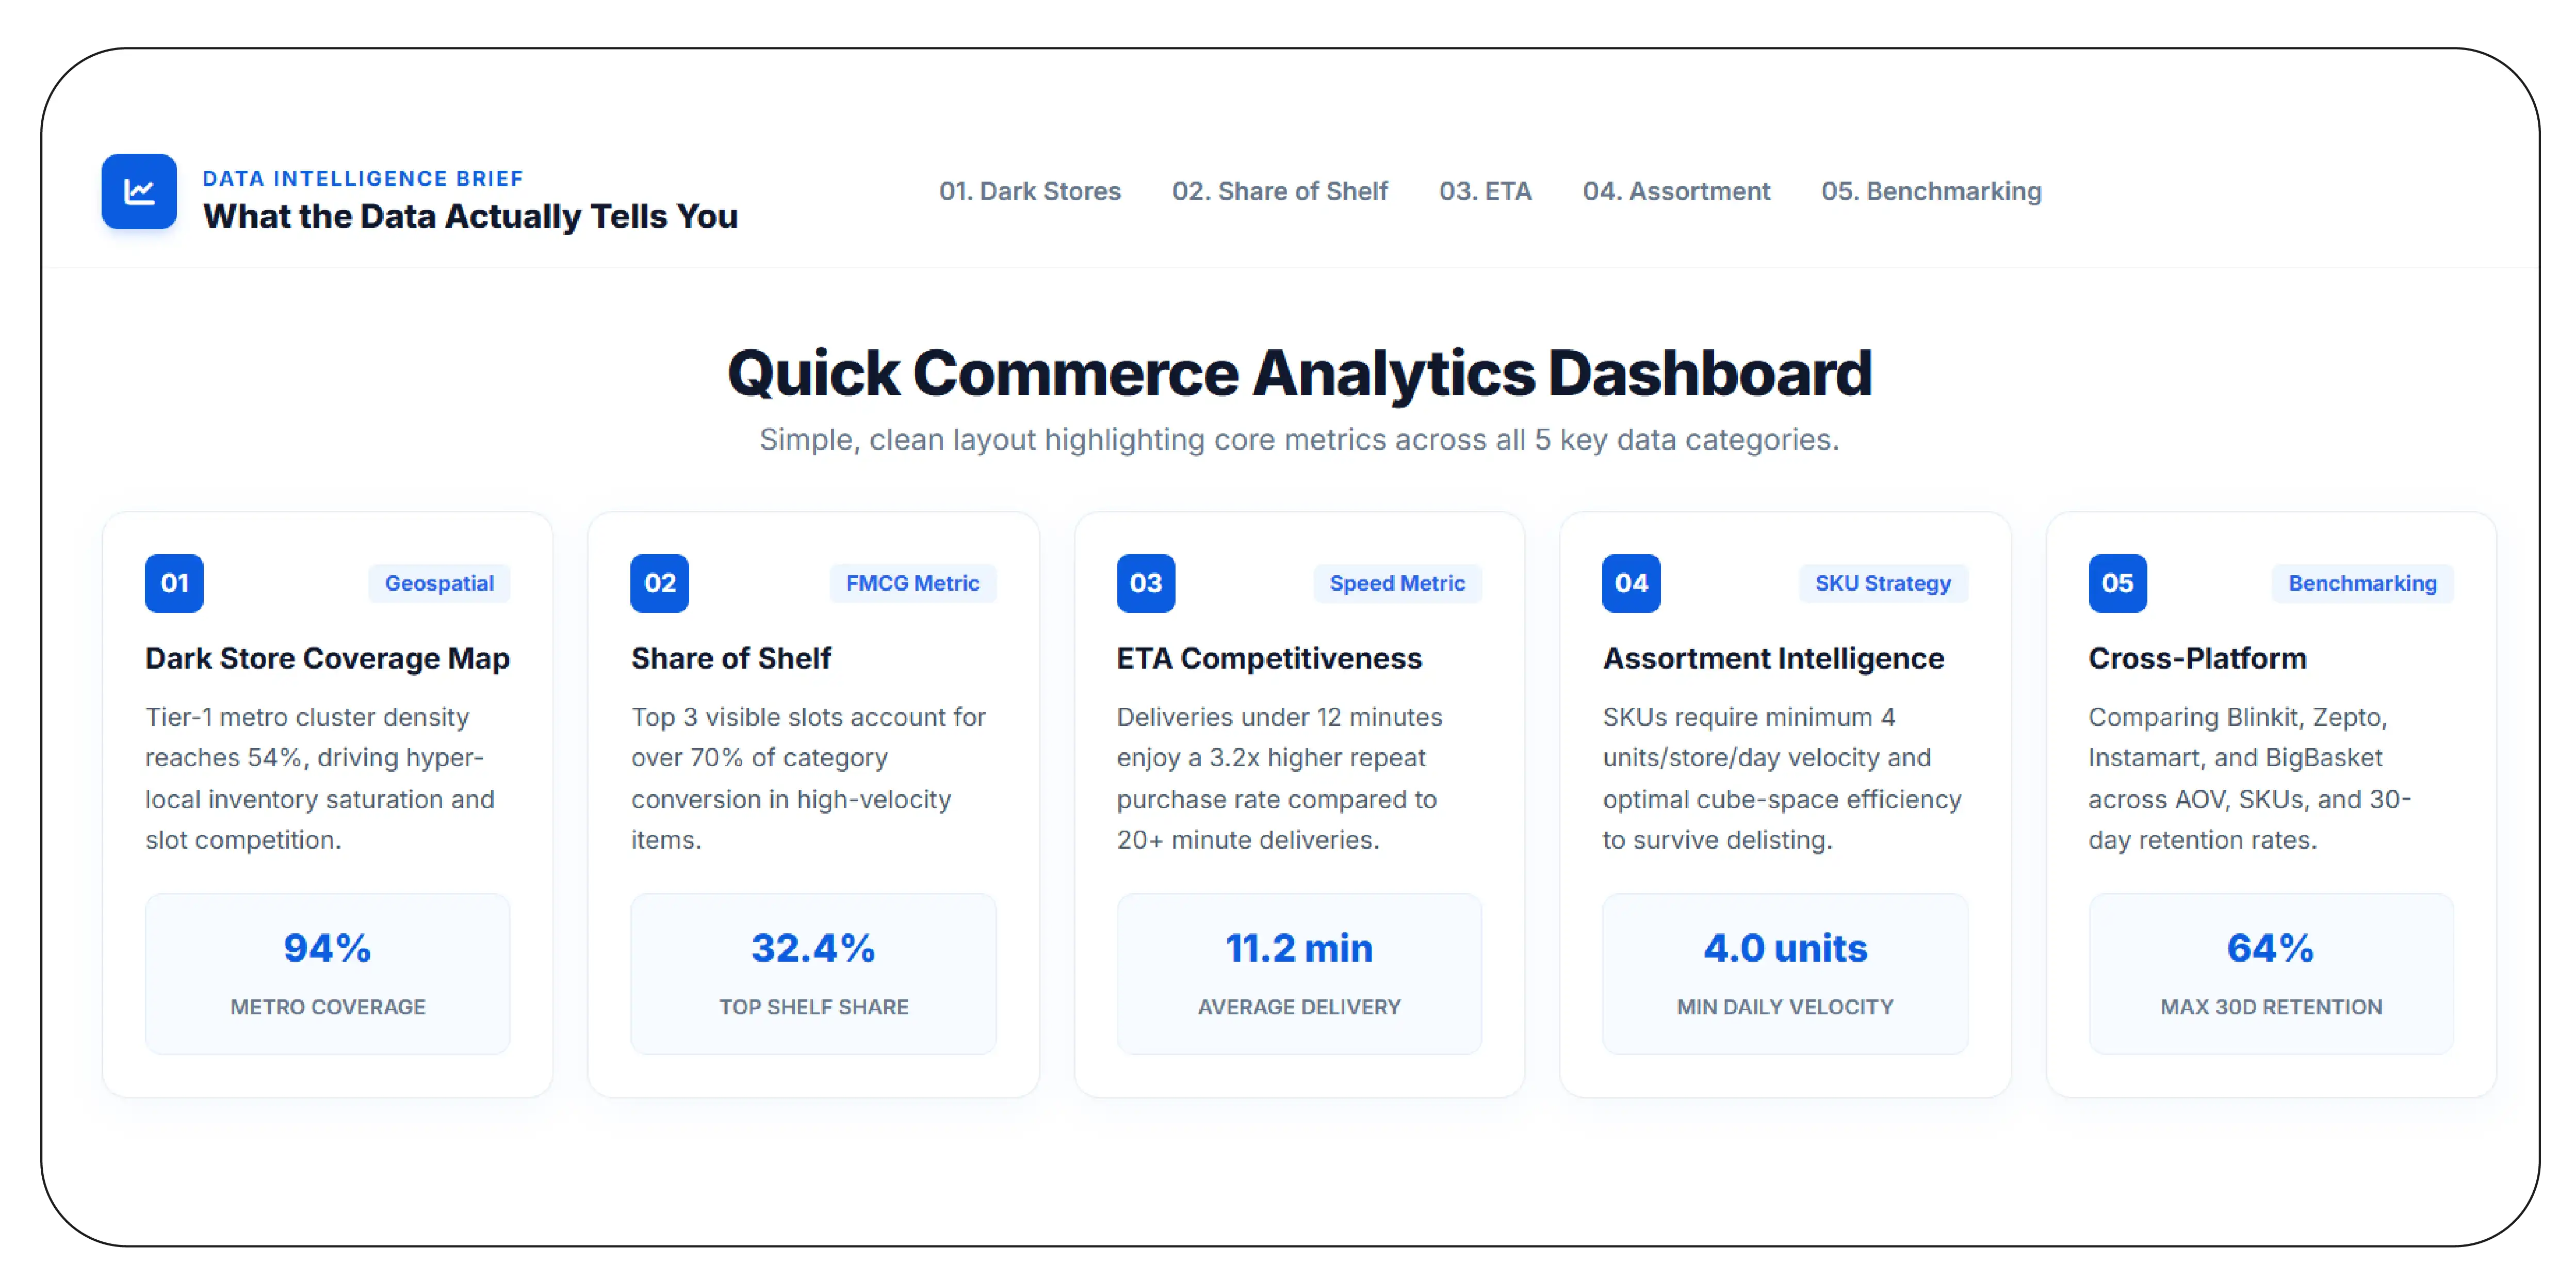
1. The dark store coverage map
Where does Flipkart Quick actually reach? Not where it claims to operate — where a pincode returns a live ETA and a purchasable SKU. Coverage is dense in metro cores and thins fast toward the periphery, and the boundary is far more ragged than any press release suggests.
For an FMCG brand, this map defines the addressable q-commerce market. For a competing operator, it defines where the fight is and, more usefully, where it is not.
2. Share of shelf — the FMCG metric
Physical retail has spent decades measuring share of shelf. Q-commerce has the same economics — a constrained shelf, a finite number of slots, and a direct relationship between slot count and sales — and almost no brands are measuring it.
share_of_assortment = brand SKUs assorted in category ÷ total SKUs in category, computed per dark store, rolled up by city.
This single metric turns q-commerce from a channel a brand sells into, into a channel a brand can manage. It gives the trade team a number to negotiate against, and it makes the outcome of that negotiation measurable.
3. ETA competitiveness
The promise is 10 minutes. The observed ETA varies by location, by time of day, and by load. Tracking the distribution — not the promise — tells you where the service is actually fast, and where a competitor with a 25-minute ETA is effectively at parity.
4. Assortment intelligence: what makes the cut
The dark store catalogue is a curated subset. Which of your SKUs made it? Which of your competitor's? Which pack sizes?
Pack size is the sharpest signal here. Dark stores favour high-turn, small-footprint packs. A brand whose q-commerce assortment is dominated by large family packs is losing the slot fight before it starts, and the fix is a pack strategy, not a price strategy.
5. Cross-platform benchmarking
Flipkart Quick does not exist in isolation. The same brand, the same category, and often the same dark-store real estate are contested across every major Indian q-commerce service. Capturing Flipkart Quick alongside the other platforms — on the same pincode panel, on the same schema, at the same time — produces the only view that actually answers the question a brand's q-commerce lead is asked in every review: where are we winning and where are we losing?
Who Buys This Data, and Why
FMCG and CPG brands — share of shelf, assortment gaps, availability at peak, pack-size strategy, and city-level trade negotiation backed by numbers.
Q-commerce operators — competitive coverage maps, assortment benchmarking, ETA comparison, and expansion-city selection based on where a competitor is thin rather than where they are strong.
Retail analytics and consulting teams — category-level market structure, and the only reliable external view of a business that publishes almost nothing.
Investors and analysts — coverage expansion, assortment depth, and ETA trends as observable proxies for operational health in a sector where reported metrics are scarce.
Capture Frequency: The Thing Most Teams Get Wrong
Dark store inventory is shallow and turns over within hours. A daily capture on q-commerce data is not a lower-resolution version of the truth — it is a different claim, and usually a false one.
| Use case |
Recommended frequency |
| Availability and stockout tracking |
Every 2–4 hours, including evening peak |
| Assortment and share of shelf |
Daily |
| Coverage map |
Weekly |
| ETA distribution |
Every 2–4 hours |
The evening peak capture is the one that finds the money. Stockouts cluster there, and a 09:00-only pipeline will never see a single one of them.
Scale and Compliance
A pincode panel across metros, captured multiple times daily, across a brand's catalogue and a competitor basket, generates a substantial record volume. Product Data Scrape tiers capture by use case, provisions for peak windows, and delivers as JSON, CSV, REST API, or directly to your warehouse.
We collect publicly available product and availability information only — no personal data, no authenticated content, and no circumvention of platform controls. Rate-limited, respectful collection is both the ethical baseline and, practically, the only way a q-commerce monitoring programme stays stable over time.
Frequently Asked Questions
Can you tell us whether a SKU is out of stock or simply not stocked?
Yes — availability_reason distinguishes them, and it is the most important field in the dataset.
Can you compute share of shelf?
Yes, provided category_depth is captured, which it is on every record. Share of assortment is computed per dark store and rolled up by city.
Do you cover other Indian q-commerce platforms?
Yes — and we recommend capturing them on the same pincode panel and the same schema, since cross-platform comparison is where most of the analytical value sits.
How granular is the location resolution?
Pincode level, which maps to dark-store serving areas closely enough for coverage and share-of-shelf analysis.
How often should we capture?
Every 2–4 hours for availability, including an evening-peak capture. Daily for assortment. See the table above.
See the Shelf You Cannot See
Your product is either on the dark store shelf or it is not. If it is not, no amount of marketing, pricing, or content work will sell it — because the customer opening the app in that pincode will simply never see it.
Product Data Scrape delivers Flipkart Quick data scraping across configurable pincode panels: coverage, ETAs, dark store availability, assortment presence, the assortment-versus-stockout distinction, pack-size coverage, category depth for share-of-shelf computation, and cross-platform q-commerce benchmarking on a single schema.
Ask us for a coverage-and-share-of-shelf diagnostic on your category in one city. It usually changes the conversation.
Product Data Scrape — turning marketplace complexity into decision-ready data.


 Singapore
 EMAIL
EMAIL
 PHONE
PHONE


.webp)
.webp "thumb")
.webp "thumb")
.webp "thumb")













.webp)






