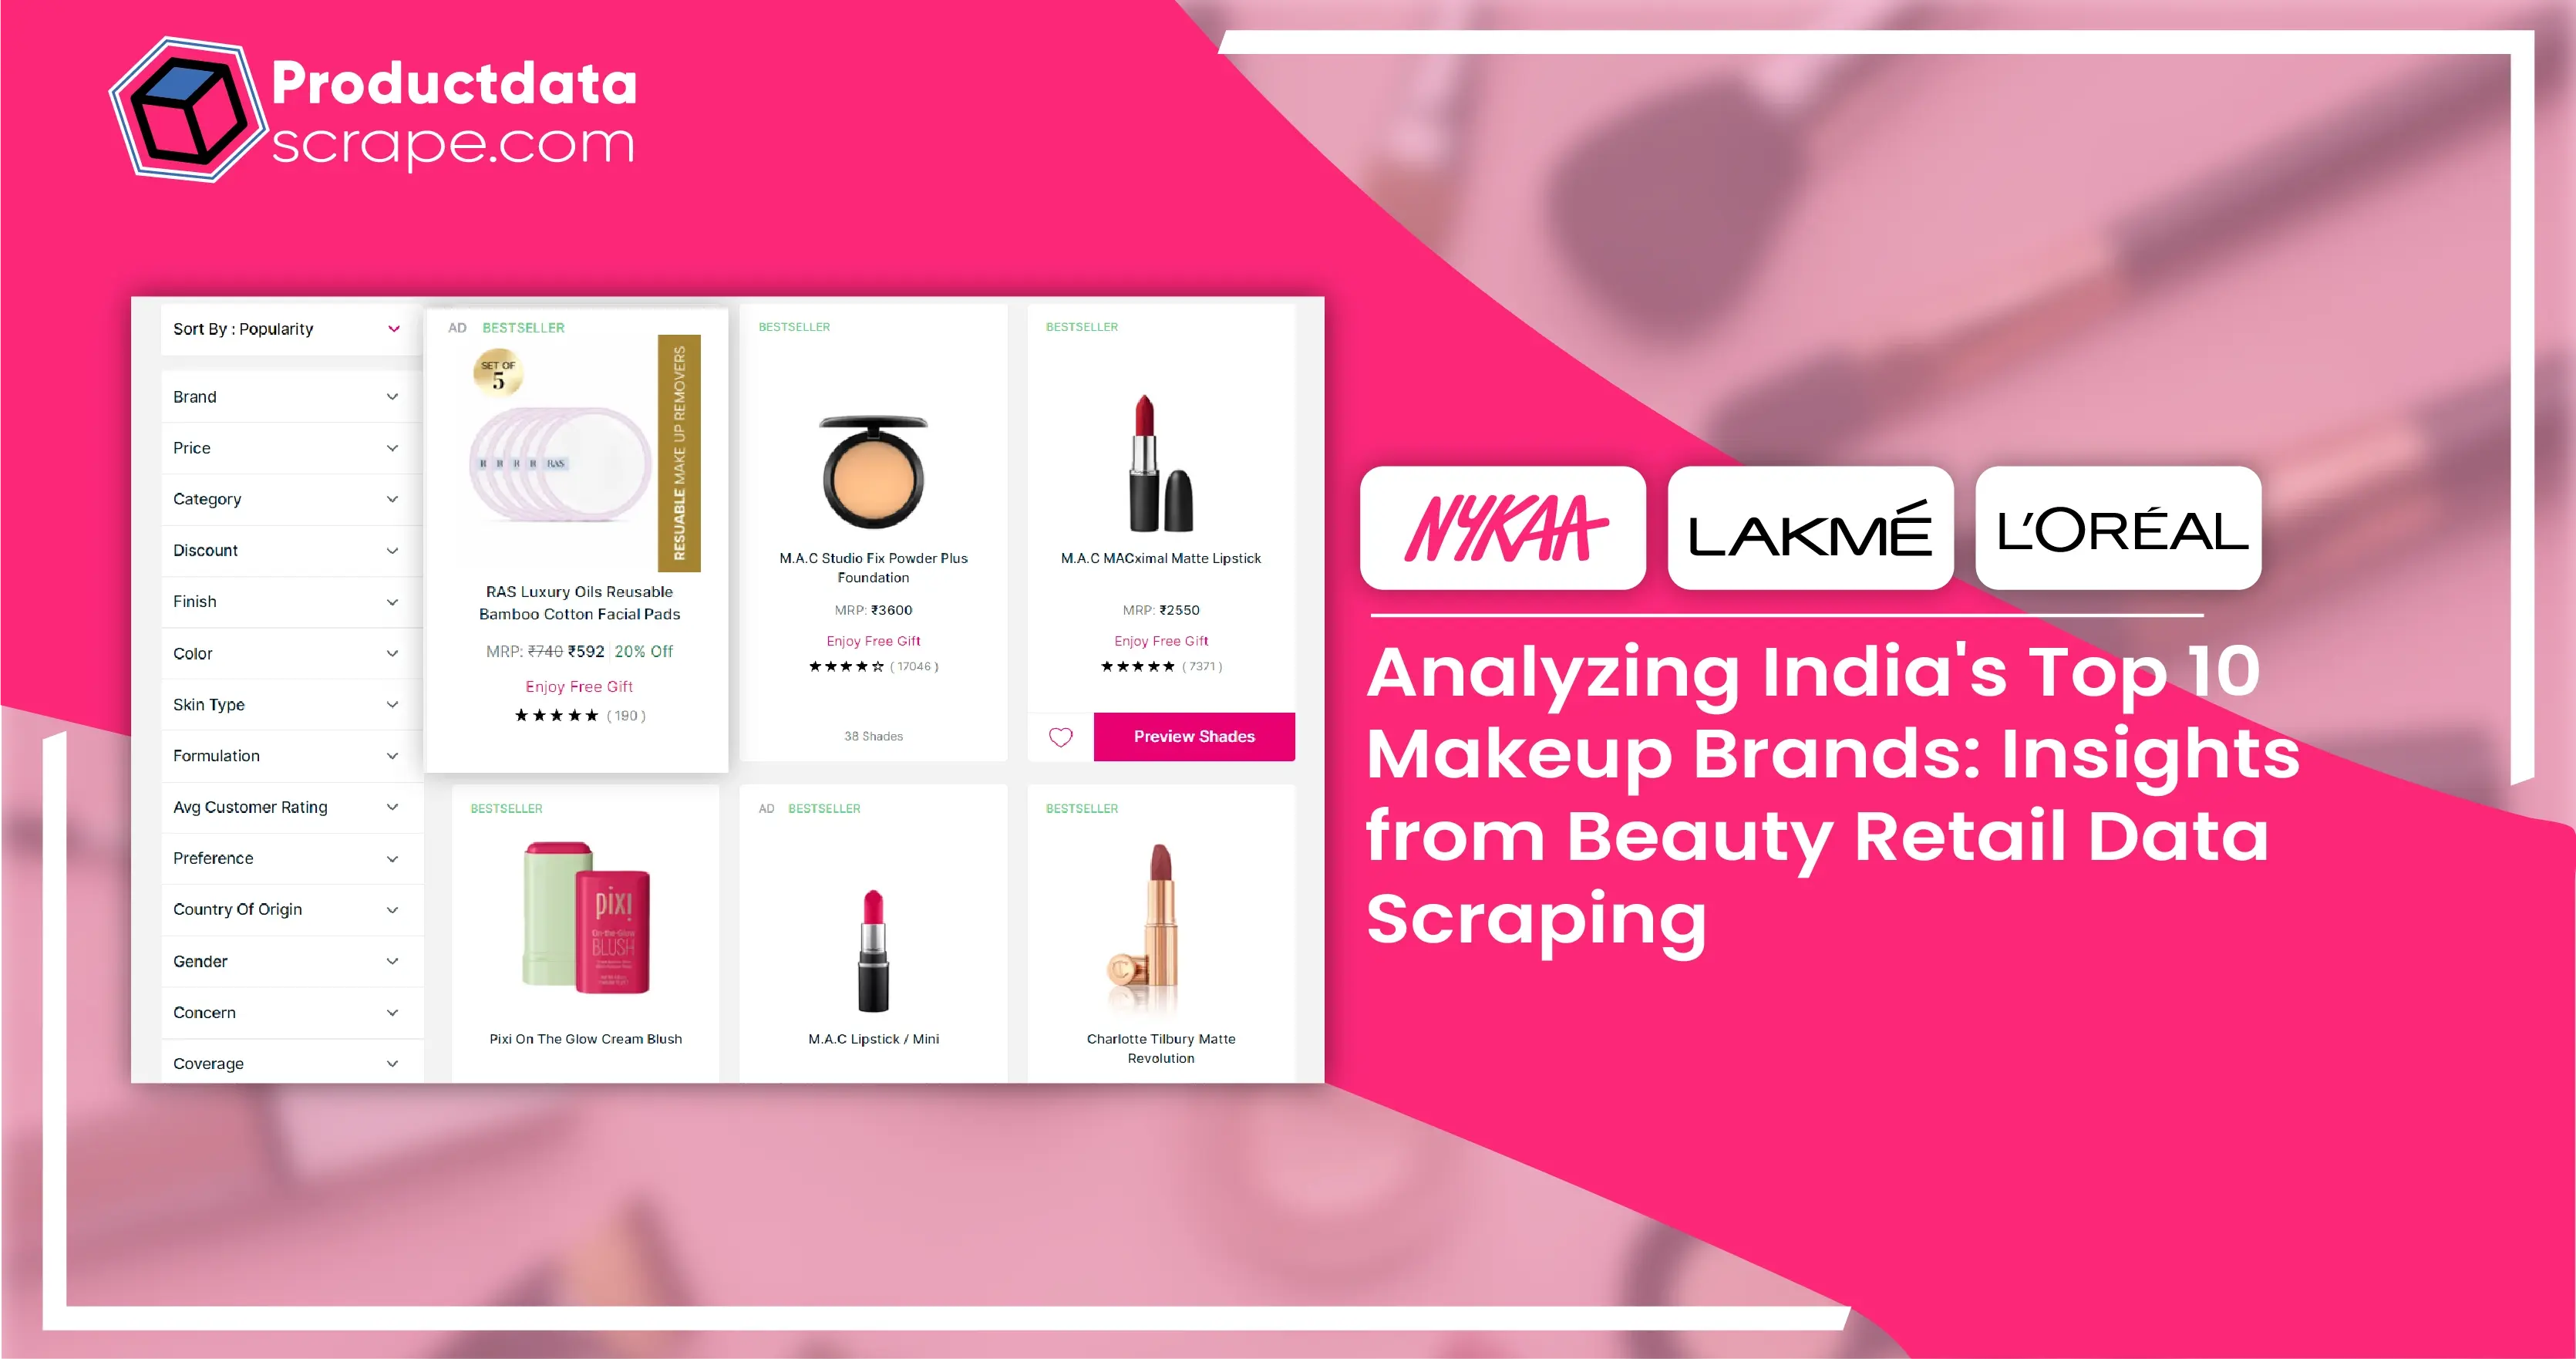
In recent years, the Indian market has emerged as a significant player for makeup brands. The surge in purchasing power among urban women, a heightened focus on beauty and fashion, and a burgeoning middle class have propelled the Indian cosmetics market into rapid growth. International brands are flooding the country, creating stiff competition for local companies. However, some Indian brands revealed from Faces beauty product data scraping have thrived by prioritizing innovation and addressing the unique needs of Indian women.
India's makeup industry is expanding swiftly and is projected to grow at a compound annual growth rate (CAGR) of 9.6%, from $1.2 billion in 2020 to $1.6 billion in 2025. This growth is primarily driven by quality-conscious, digitally savvy consumers, particularly millennials, who see makeup as a means of self-expression and are willing to invest in it. With such a promising opportunity, it's crucial to market your brand effectively.
Amidst this booming market, the recent Nykaa IPO made waves, prompting our client to seek a market analysis. Leveraging our retail data scraping services expertise, we provided them with comprehensive insights. This blog, independently curated by Product Data Scrape, delves into an analysis of India's top ten makeup brands, using scraping retail data of Indian makeup brands to highlight market trends and brand performance.
We've done a deep dive so that you don't have to. Here is our analysis of the top 10 makeup brands in India. In this blog, we use this market data to provide insights into the makeup brands covering the following aspects:
Data Attributes
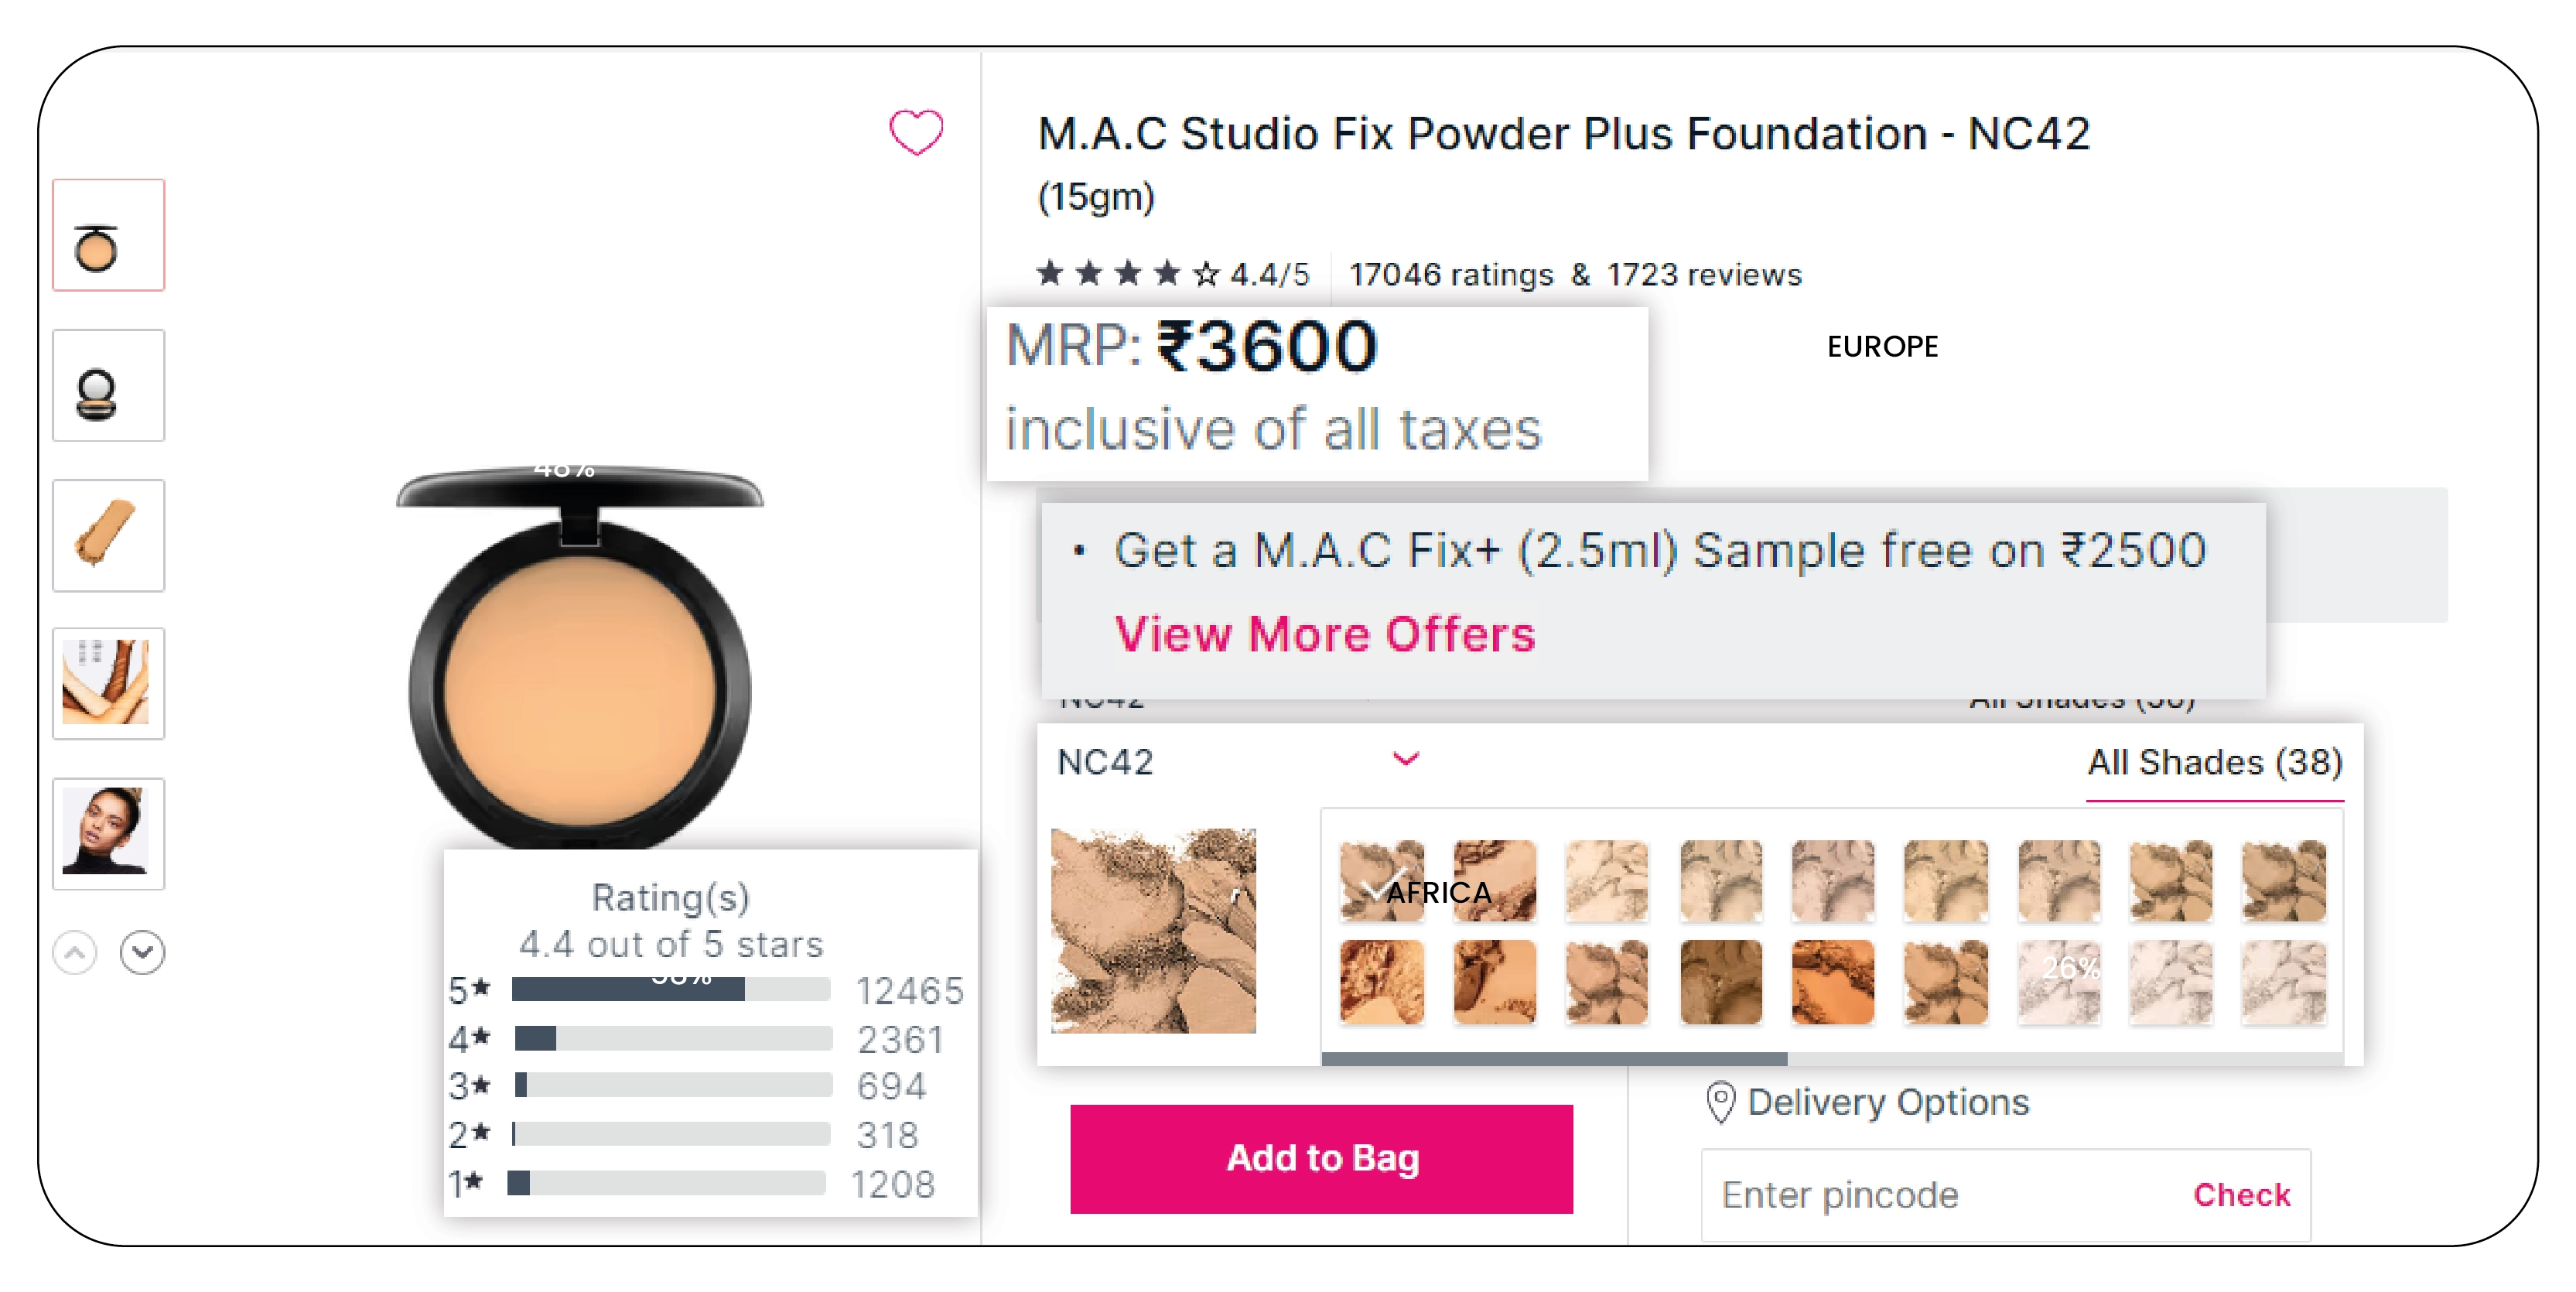
The following data fields were extracted for each makeup brand:
- Brand: Brand represents the brand name, for example, L'Oreal.
- Sale_price: The sale price is when the product is available after the discounts.
- Entry and Exit Price: This comprises a particular brand's lowest and highest prized products.
- Average Discount percentage: The average Discount percentage is the average of all discounts offered on the various products of a particular brand.
- Average Number of ratings: The average number of ratings is the total number of star ratings given to a particular product.
- Average rating across brands: This is the average rating of all products within a particular brand.
- Discount range across all products: Discount range refers to the number of products within a particular discount range.
- Discount statistics: This denotes the number of products with and without discounts in each brand.
A common challenge when gathering product information through Huda beauty product data scraping is dealing with duplicates. After completing the data extraction phase, validating and removing duplicates is essential to ensure accuracy. Our L’oreal beauty product data scraping includes a built-in deduplication feature that swiftly identifies and eliminates duplicate entries using links as a reference, resulting in a streamlined dataset.
Post deduplication, our final dataset contained 15,600 unique products, revealing that 33% of the initially scraped data was redundant. Quality assurance is critical in web scraping to effectively address both coverage and data integrity issues. Thorough checks on the collected data help mitigate inaccuracies and ensure reliable insights for informed decision-making in retail and beyond.
Streamlining Data Integrity: Deduplication in Retail Web Scraping
A common challenge when gathering product information through web scraping is dealing with duplicates. After completing the data extraction phase, validating and removing duplicates is essential to ensure accuracy. Our MAC beauty product data scraping includes a built-in deduplication feature that swiftly identifies and eliminates duplicate entries using links as a reference, resulting in a streamlined dataset.
Post deduplication, our final dataset contained 15,600 unique products, revealing that 33% of the initially scraped data was redundant. Quality assurance is critical in Lakme beauty product data scraping to effectively address both coverage and data integrity issues. Thorough checks on the collected data help mitigate inaccuracies and ensure reliable insights for informed decision-making in retail and beyond.
Enhancing Data Insights: Tools and Visualizations for Analyzing Scraped Retail Data
To analyze the extensive dataset from scraping retail data of Indian makeup brands' efforts, we leveraged Jupyter Notebook and Python Pandas for comprehensive data exploration. For initial insights, visualizations were crafted using Seaborn. However, we opted for Tableau Public for more interactive and reader-friendly visualizations.
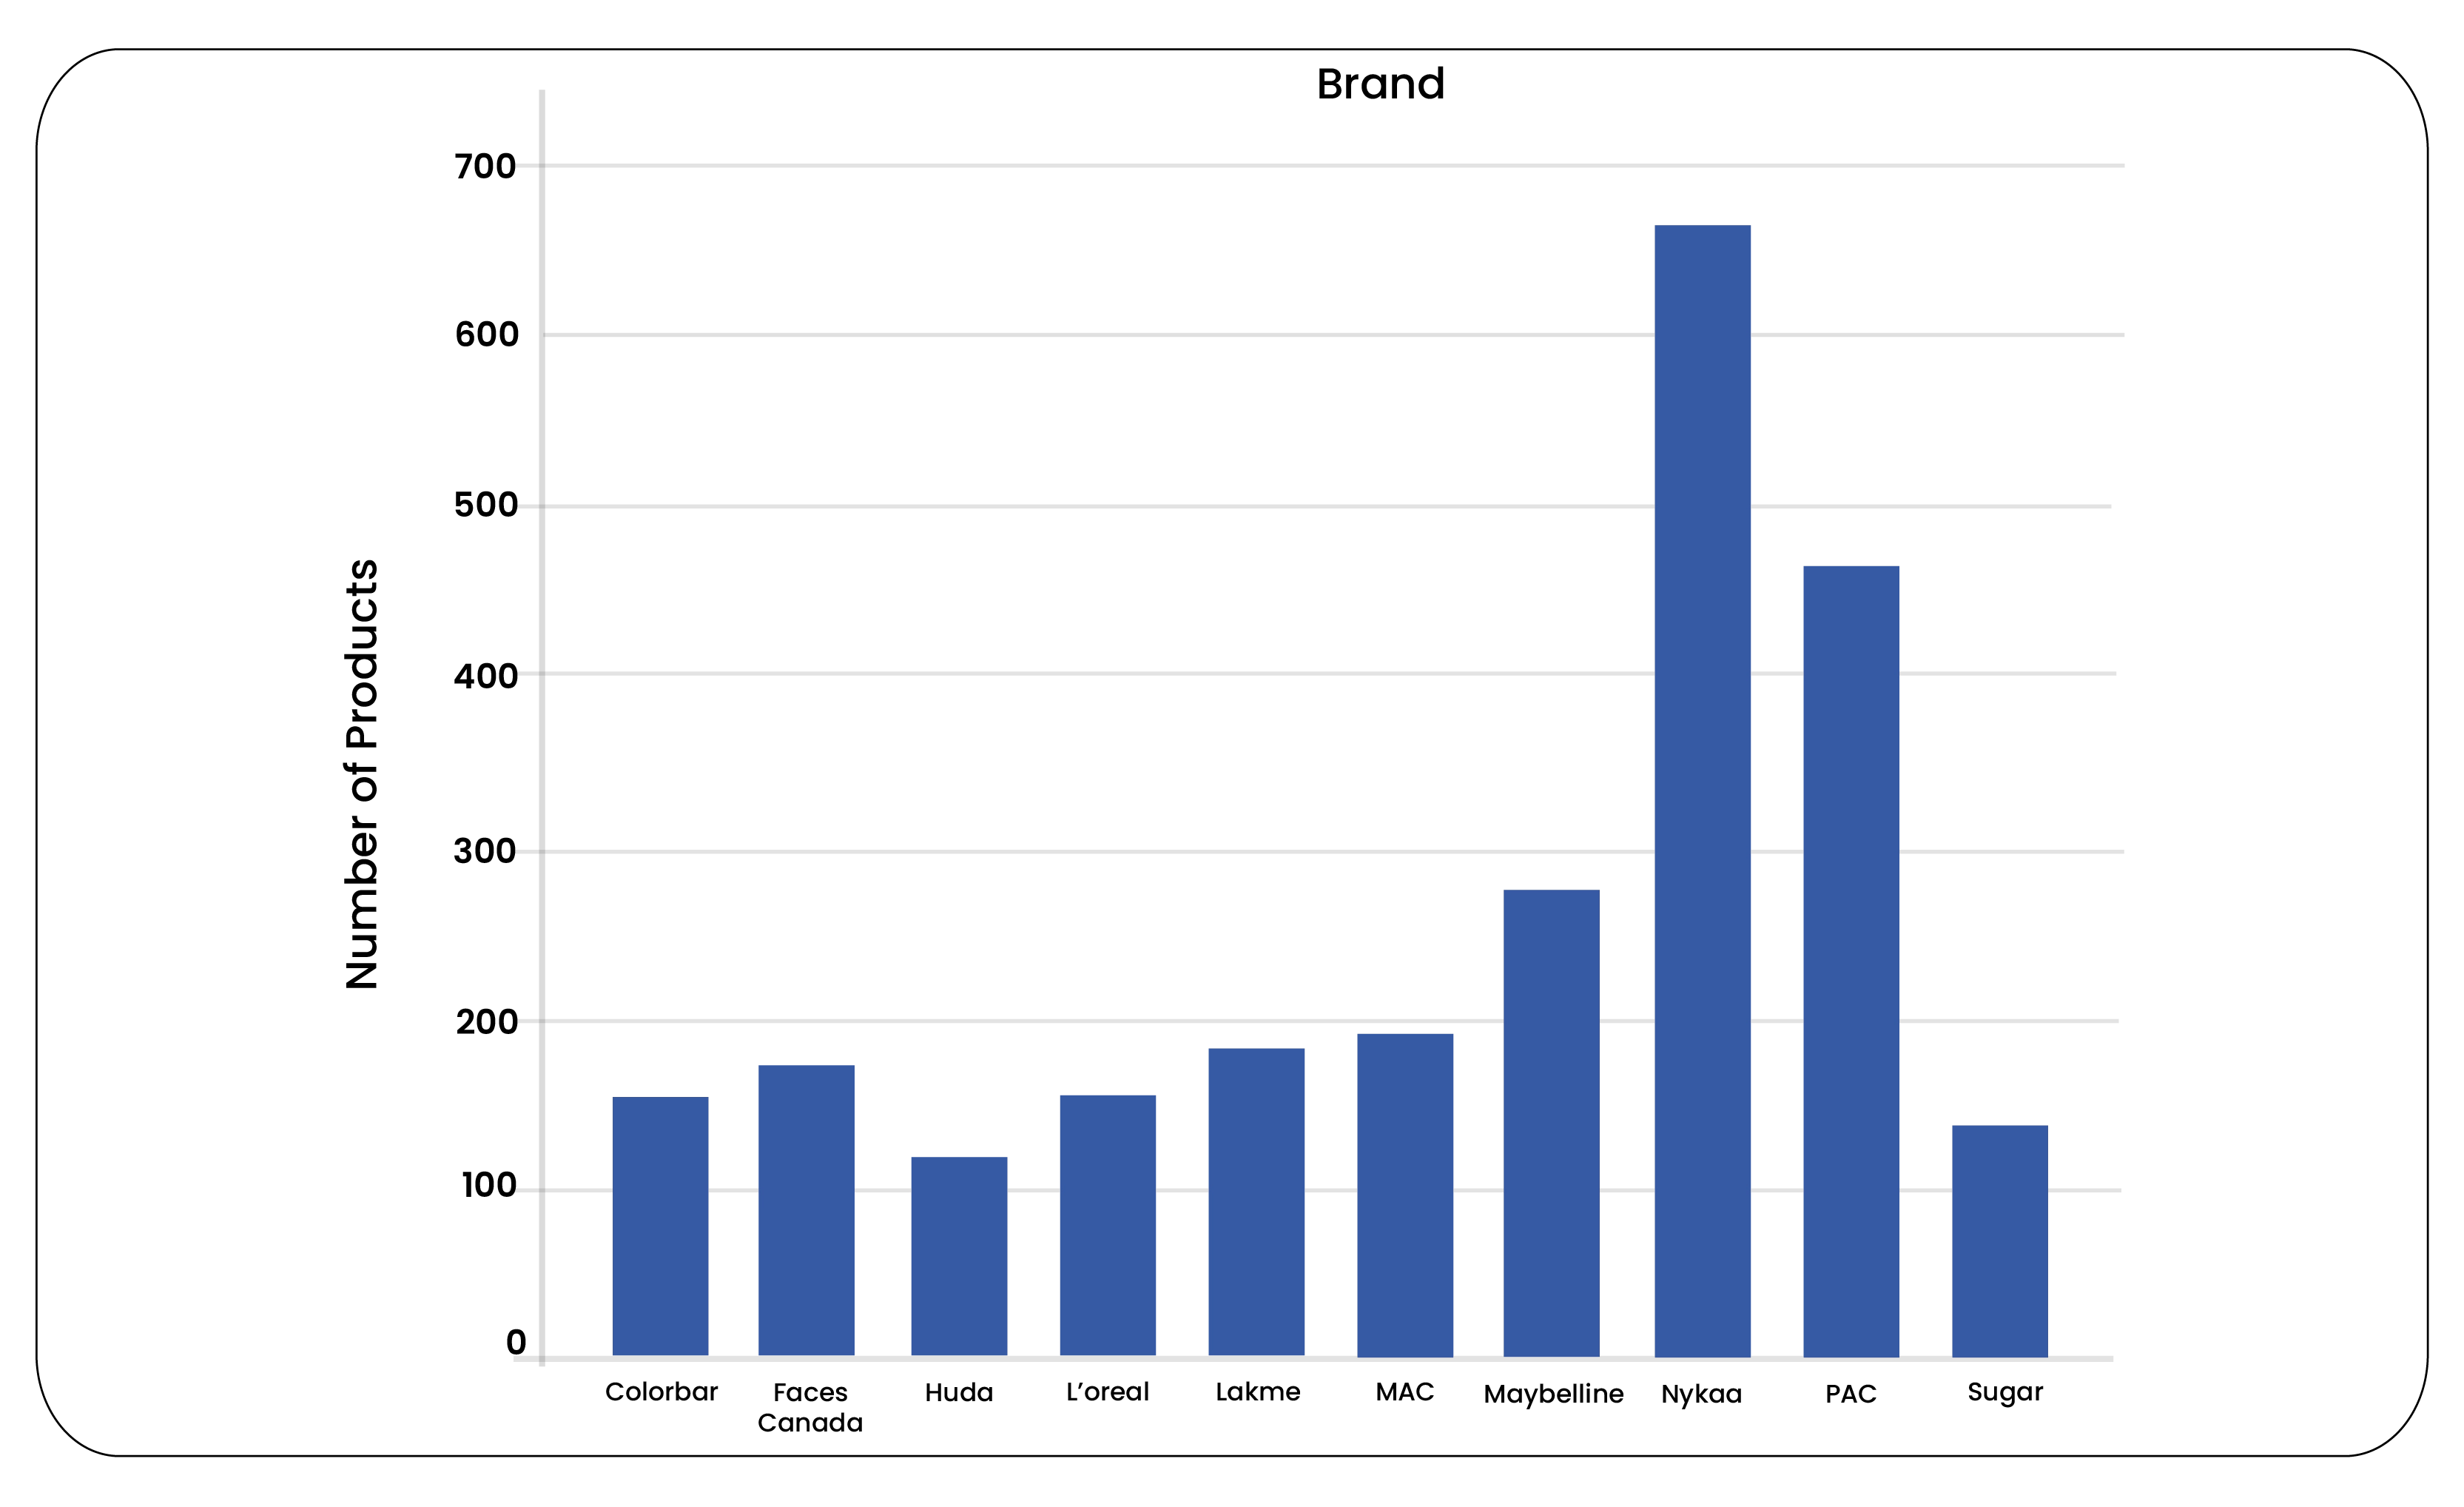
Our analysis revealed the top 10 makeup brands based on the product range available on the online retail platform, totaling over 15,000 products. Nykaa, Maybelline, L'Oreal Paris, Lakme, Sugar Cosmetics, Faces Canada, Colorbar, MAC, Huda Beauty, and PAC led this category. Nykaa topped the list with 687 products, PAC with 457, Maybelline with 276, and Colorbar with 200.
Explore an interactive visualization showcasing the product ranges of these top 10 makeup brands.
Discount Strategies Across Top Makeup Brands
Discounts are pivotal in enticing consumers to try new products and fostering brand loyalty within the competitive makeup industry. They catalyze hesitant buyers, offering them a risk-free opportunity to explore new products without the total financial commitment.
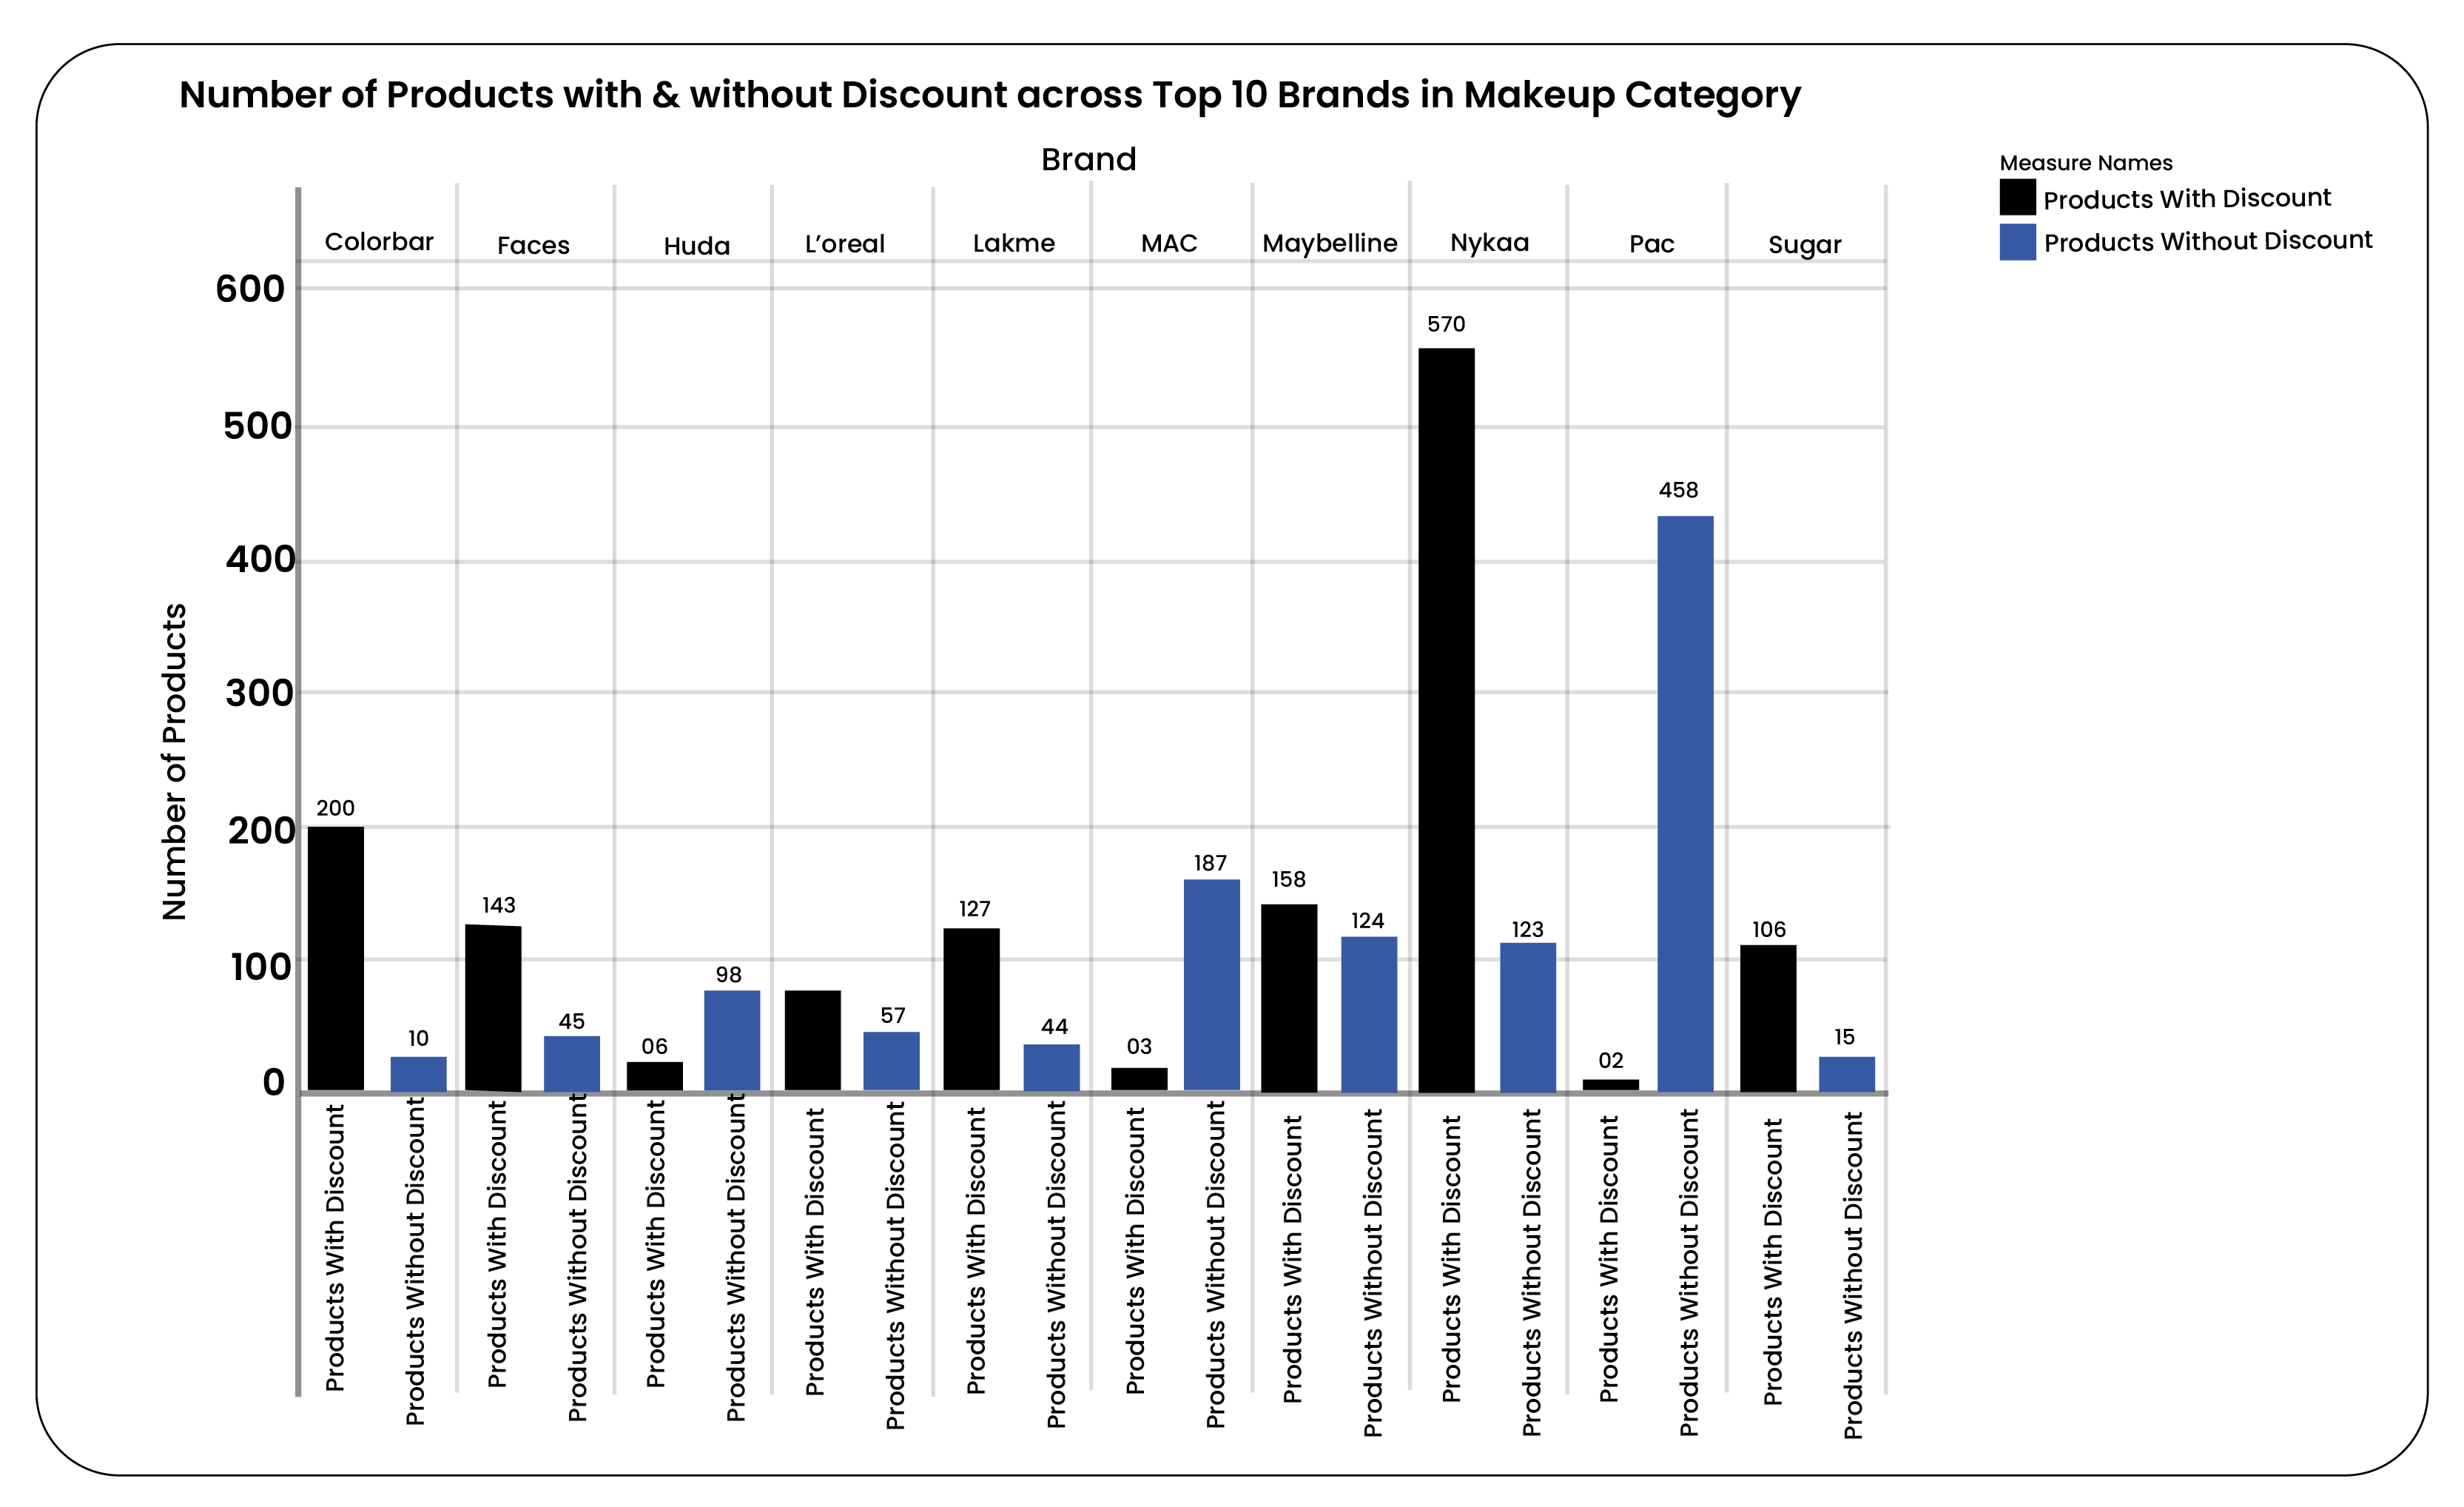
Our analysis focused on the prevalence of discounts among the top 10 makeup brands available on an online retail platform. Nykaa beauty product data scraping led the pack with 567 products on discount, accounting for 82% of its offerings. Colorbar beauty product data scraping followed closely, with 191 products discounted at 95.5%, and Maybelline beauty product data scraping, with 155 products discounted, representing 56.1% of its lineup.
Conversely, Pac beauty product data scraping enables thar it had the fewest discount products, with only 1 item, followed by MAC Cosmetics with two and Huda Beauty with 5. This diversity in discounting strategies highlights each brand's approach to attracting and retaining customers in a competitive market.
Explore our interactive visualization showcasing the distribution of discounted and non-discounted products across these top makeup brands.
Price Range Analysis Across Top 10 Makeup Brands
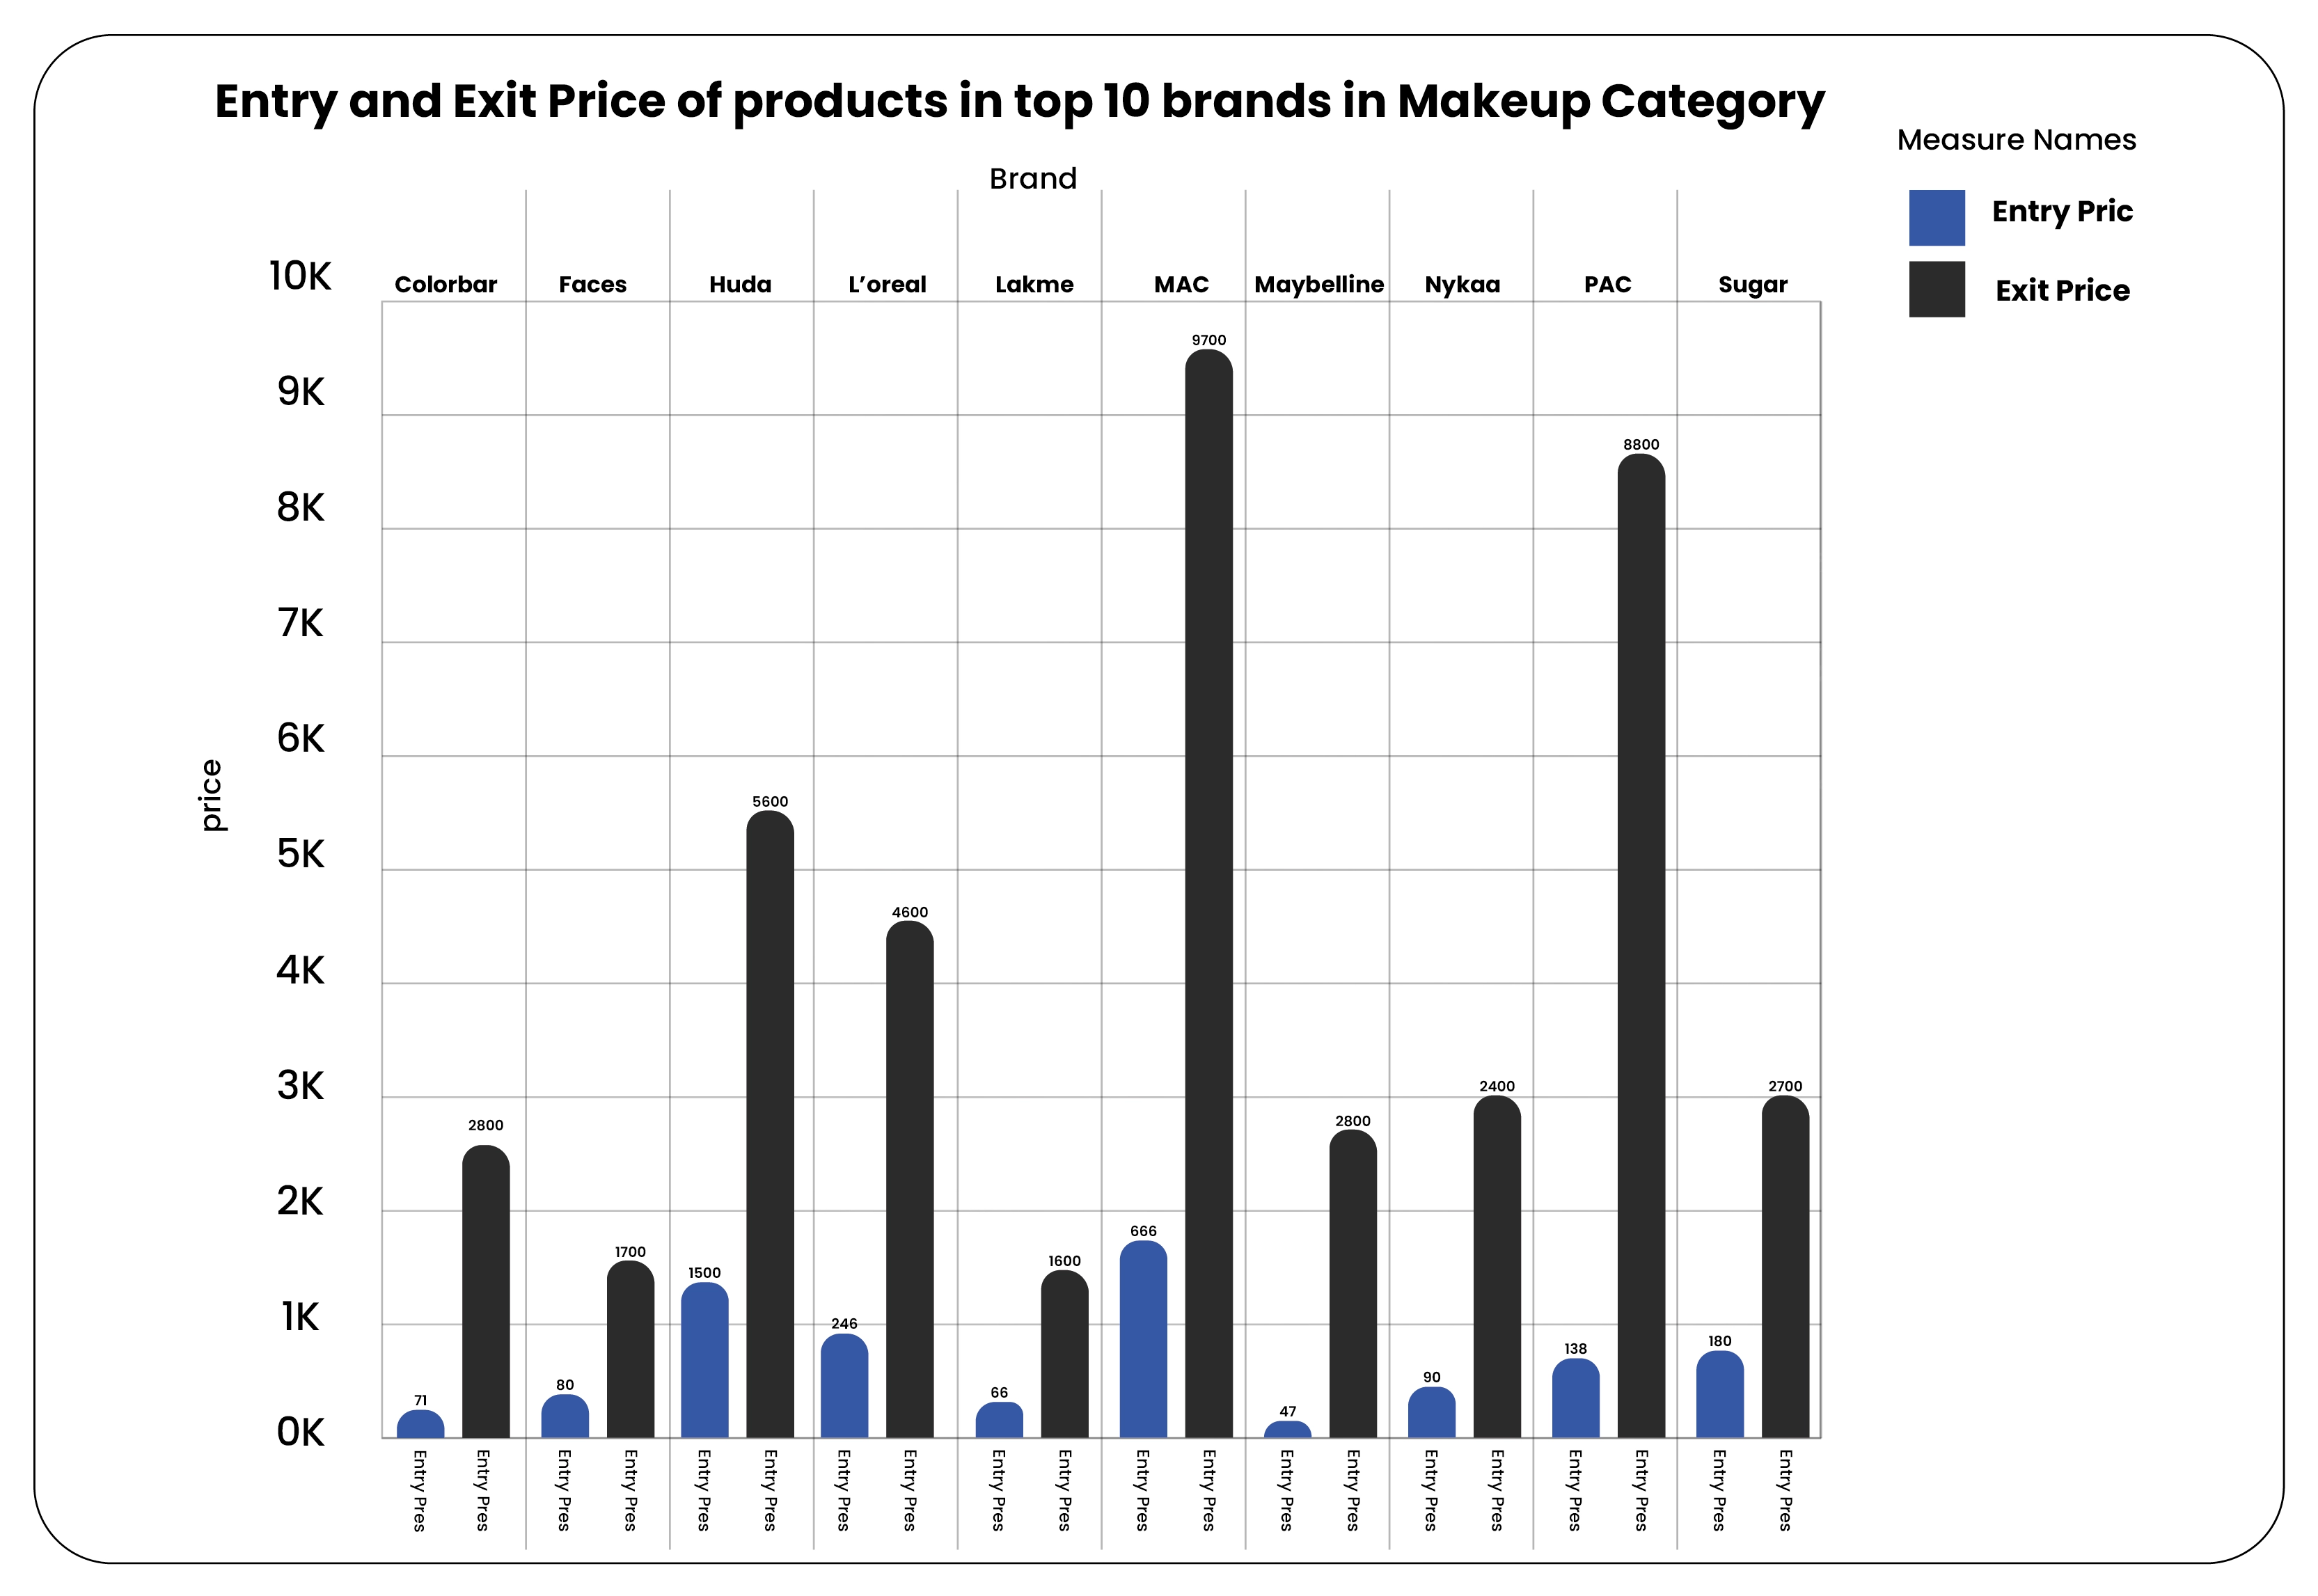
Understanding the price dynamics within the top 10 makeup brands reveals intriguing insights into consumer choices and brand positioning. We delved into the entry and exit prices across these brands, showcasing the range within which their products are priced.
Maybelline emerges with the most accessible entry price of just Rs 55, illustrating its commitment to affordability and accessibility for consumers.
On the other end of the spectrum, Huda Beauty leads with an entry price of Rs 1500, positioning itself as a premium brand with luxurious offerings right from the start.
Regarding exit prices, MAC commands the highest at Rs 9700, reflecting its status as a luxury brand with products at the upper end of the market. PAC follows closely with an exit price of Rs 8995, emphasizing its competitive positioning in the higher price segment.
Visualize the extensive price ranges of products within these leading makeup brands to gain deeper insights into their market strategies and consumer appeal.
Average Discount Strategies Across Top 10 Makeup Brands
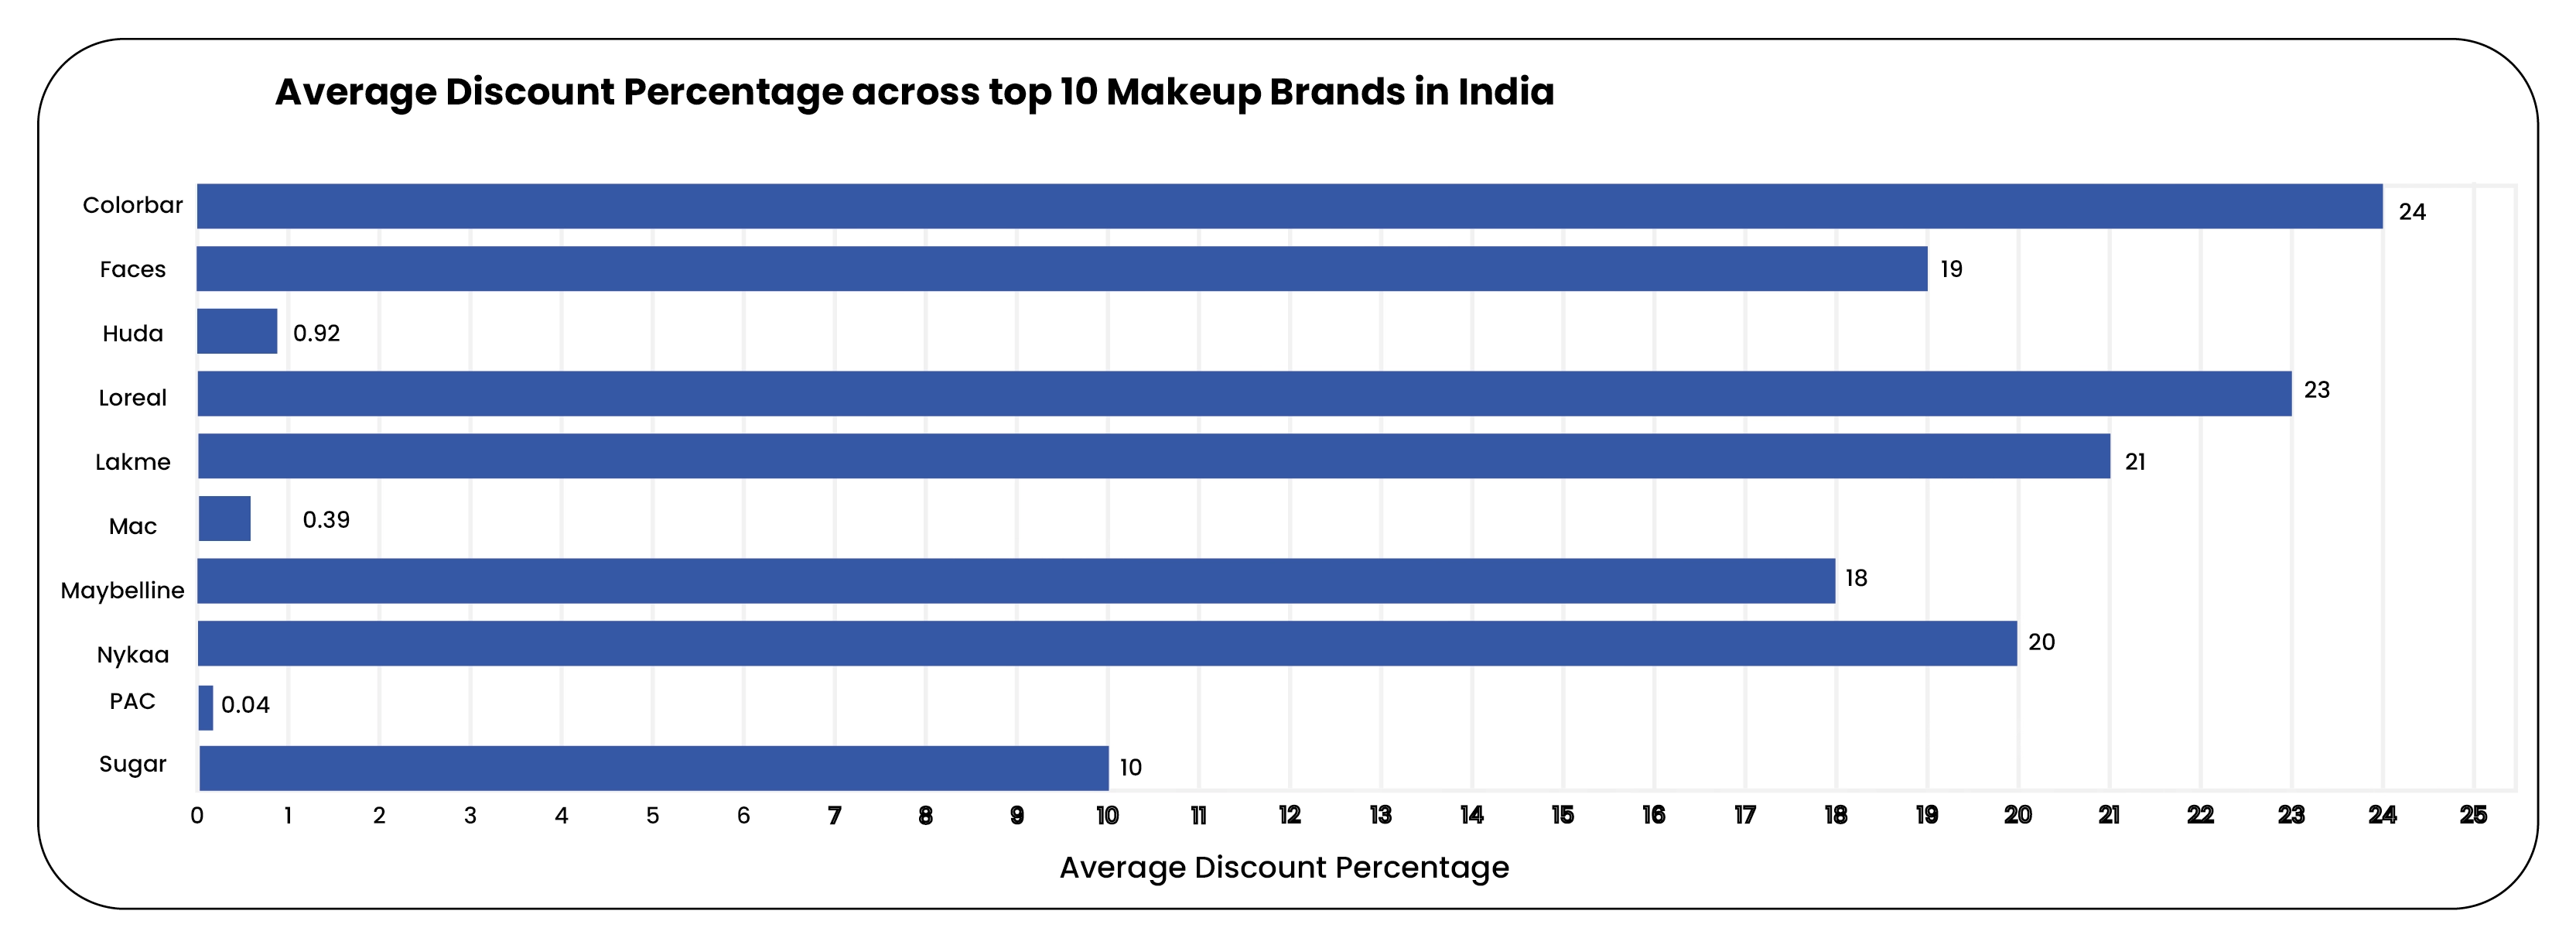
Understanding the average discount percentage across top makeup brands provides valuable insights into their promotional strategies and consumer engagement. This metric indicates the typical discount customers can expect, influencing their purchase decisions and brand loyalty.
Our analysis of the top 10 makeup brands reveals intriguing findings:
Colorbar leads with the highest average discount percentage at 24%, showcasing a robust strategy to attract and retain customers through competitive pricing.
Following closely is L’oreal Paris, offering an average discount of 23%, reinforcing its appeal with enticing promotional offers.
Conversely, PAC offers the lowest average discount percentage at just 0.04%, indicating a conservative approach to discounting within its market strategy.
Visualize the distribution of average discount percentages across these brands using Sugar beauty product data scraping to gain deeper insights into their pricing dynamics and competitive positioning in the makeup industry.
Rating Insights Across Top 10 Makeup Brands
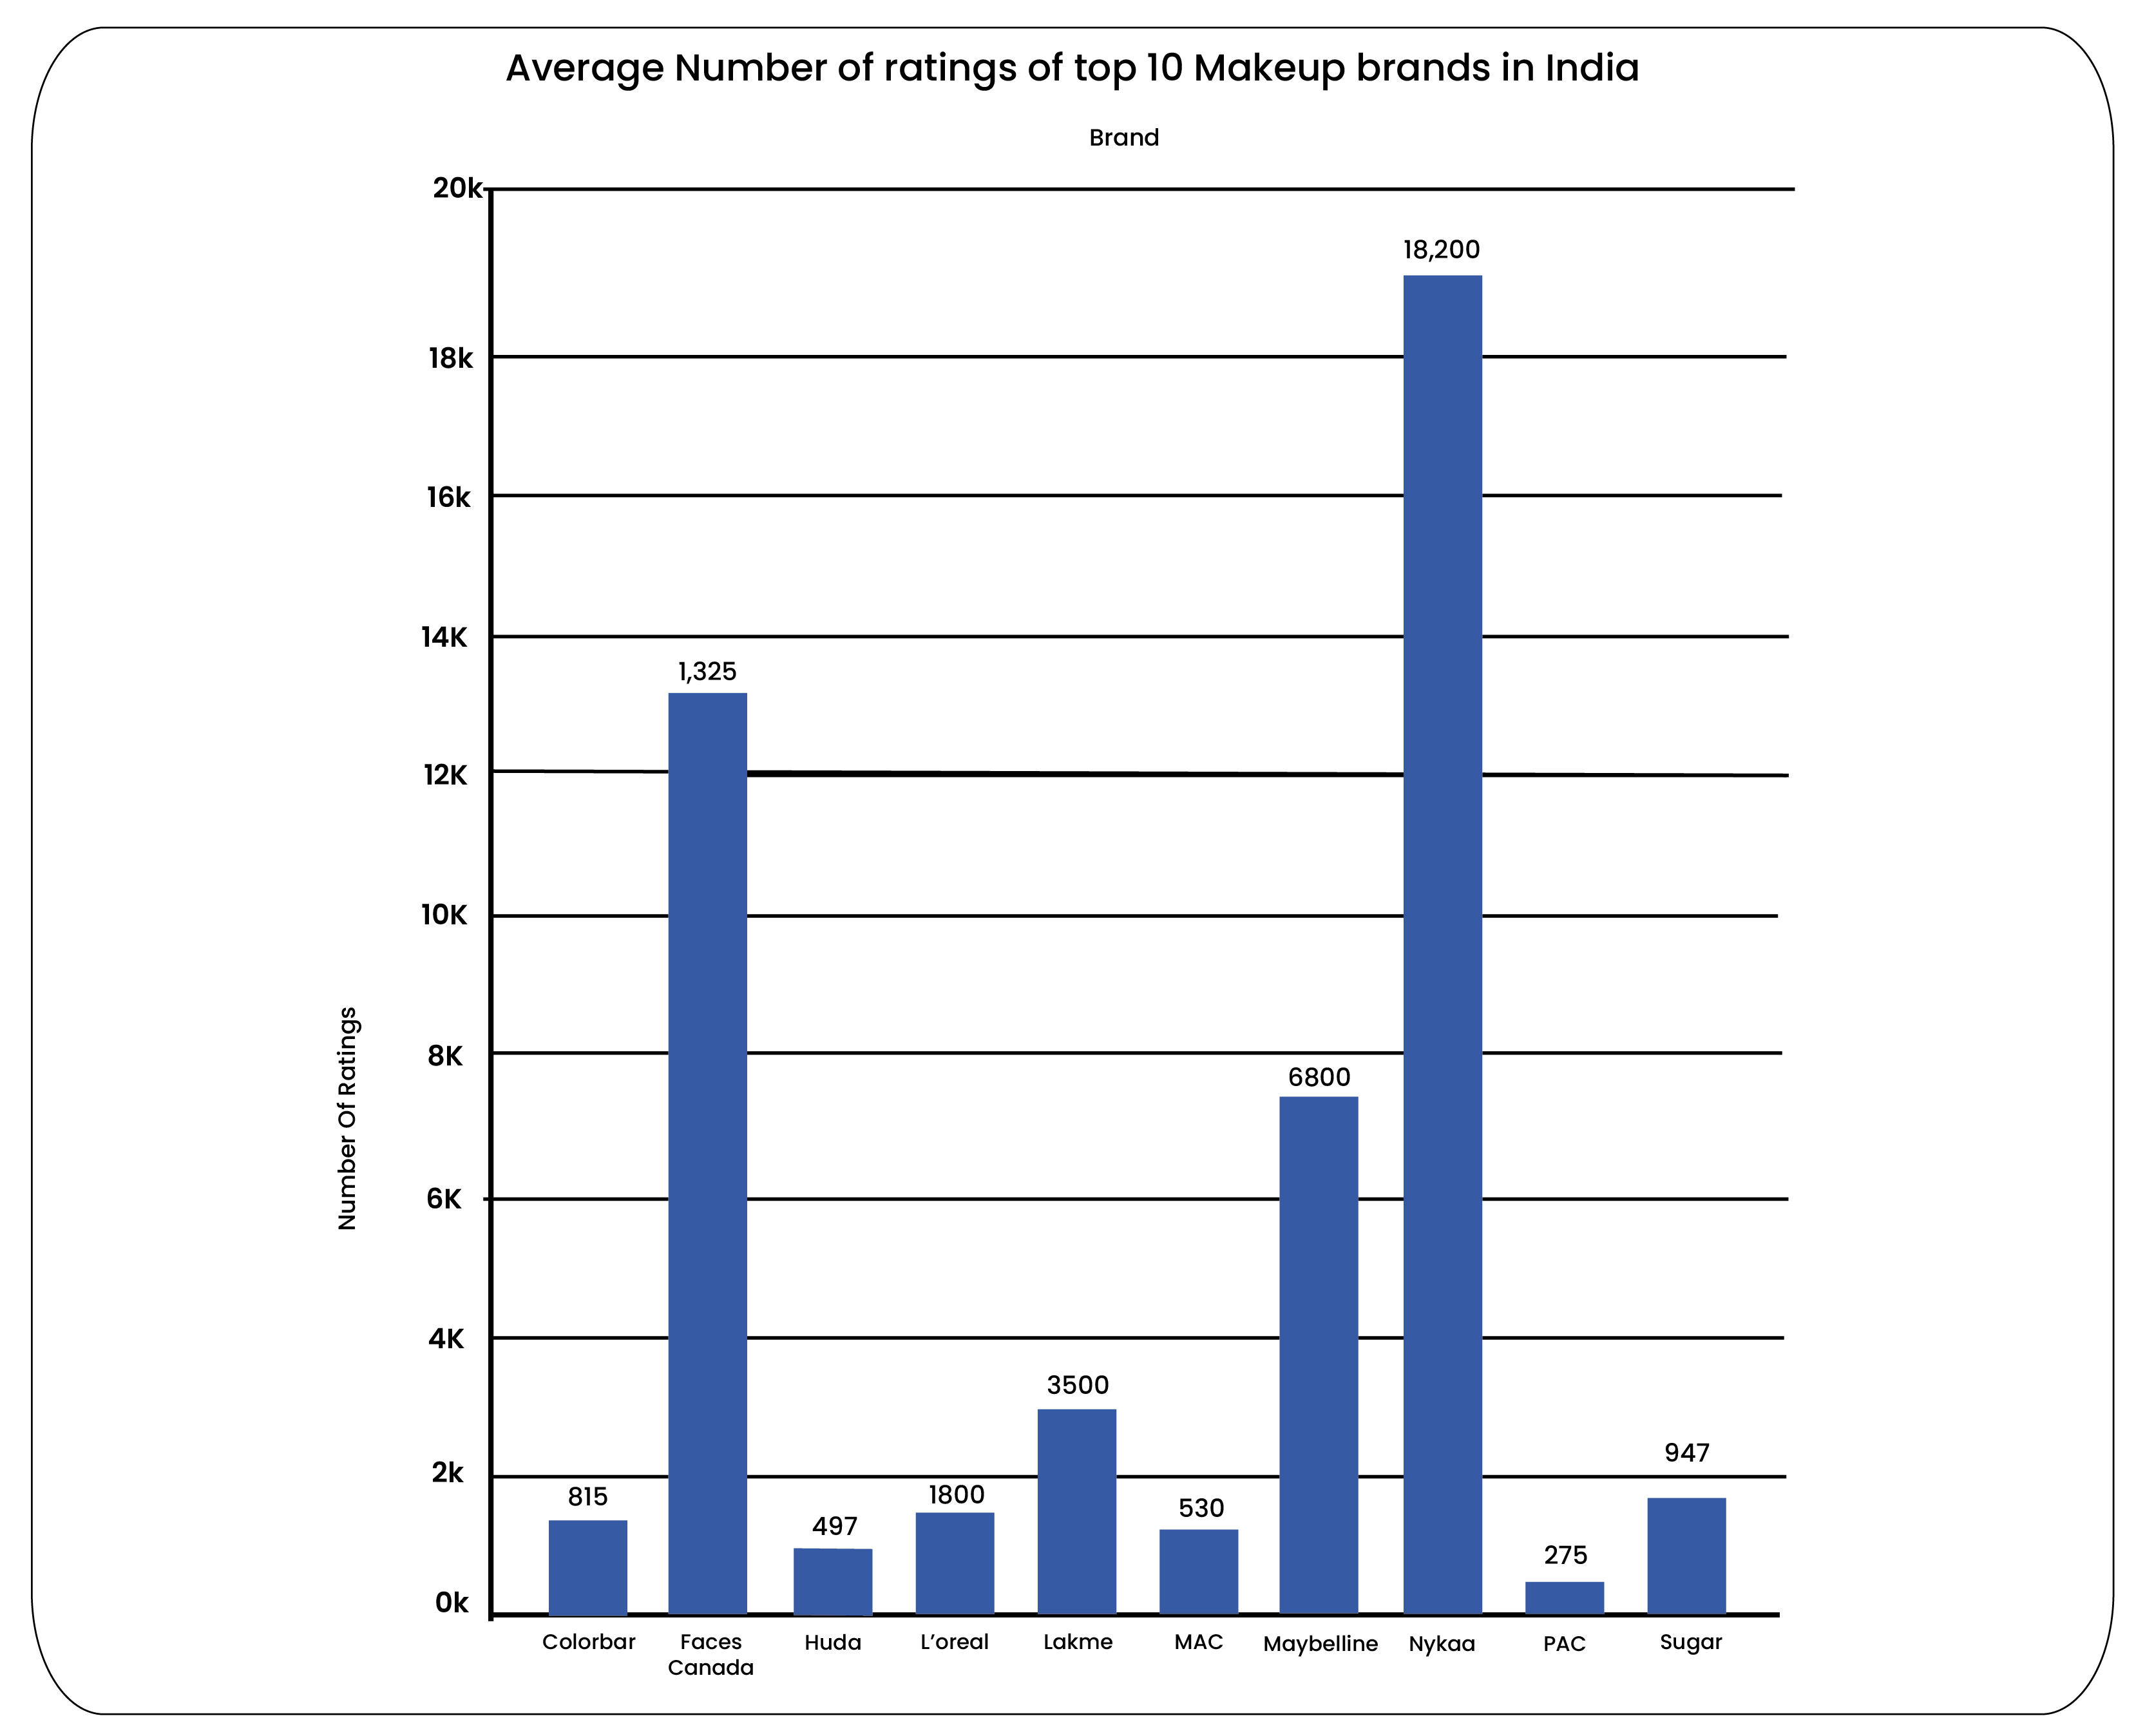
In the beauty industry, the number of customer ratings serves as a critical metric for assessing a brand's product performance and appeal. Ratings provide essential guidance to potential customers, influencing their purchasing decisions by reflecting product quality and customer satisfaction.
Our analysis of the top 10 makeup brands highlights significant findings:
Nykaa stands out with the highest customer ratings, totaling 18,200, underscoring its popularity and consumer trust.
Following Nykaa, Maybelline garners substantial feedback with 6,800 ratings, solidifying its position as a preferred choice among makeup enthusiasts.
In contrast, PAC records the lowest number of ratings at 275, indicating a more minor but potentially niche customer base.
Explore the visualization showcasing the distribution of customer ratings across these leading makeup brands to gain deeper insights into their market presence and consumer engagement.
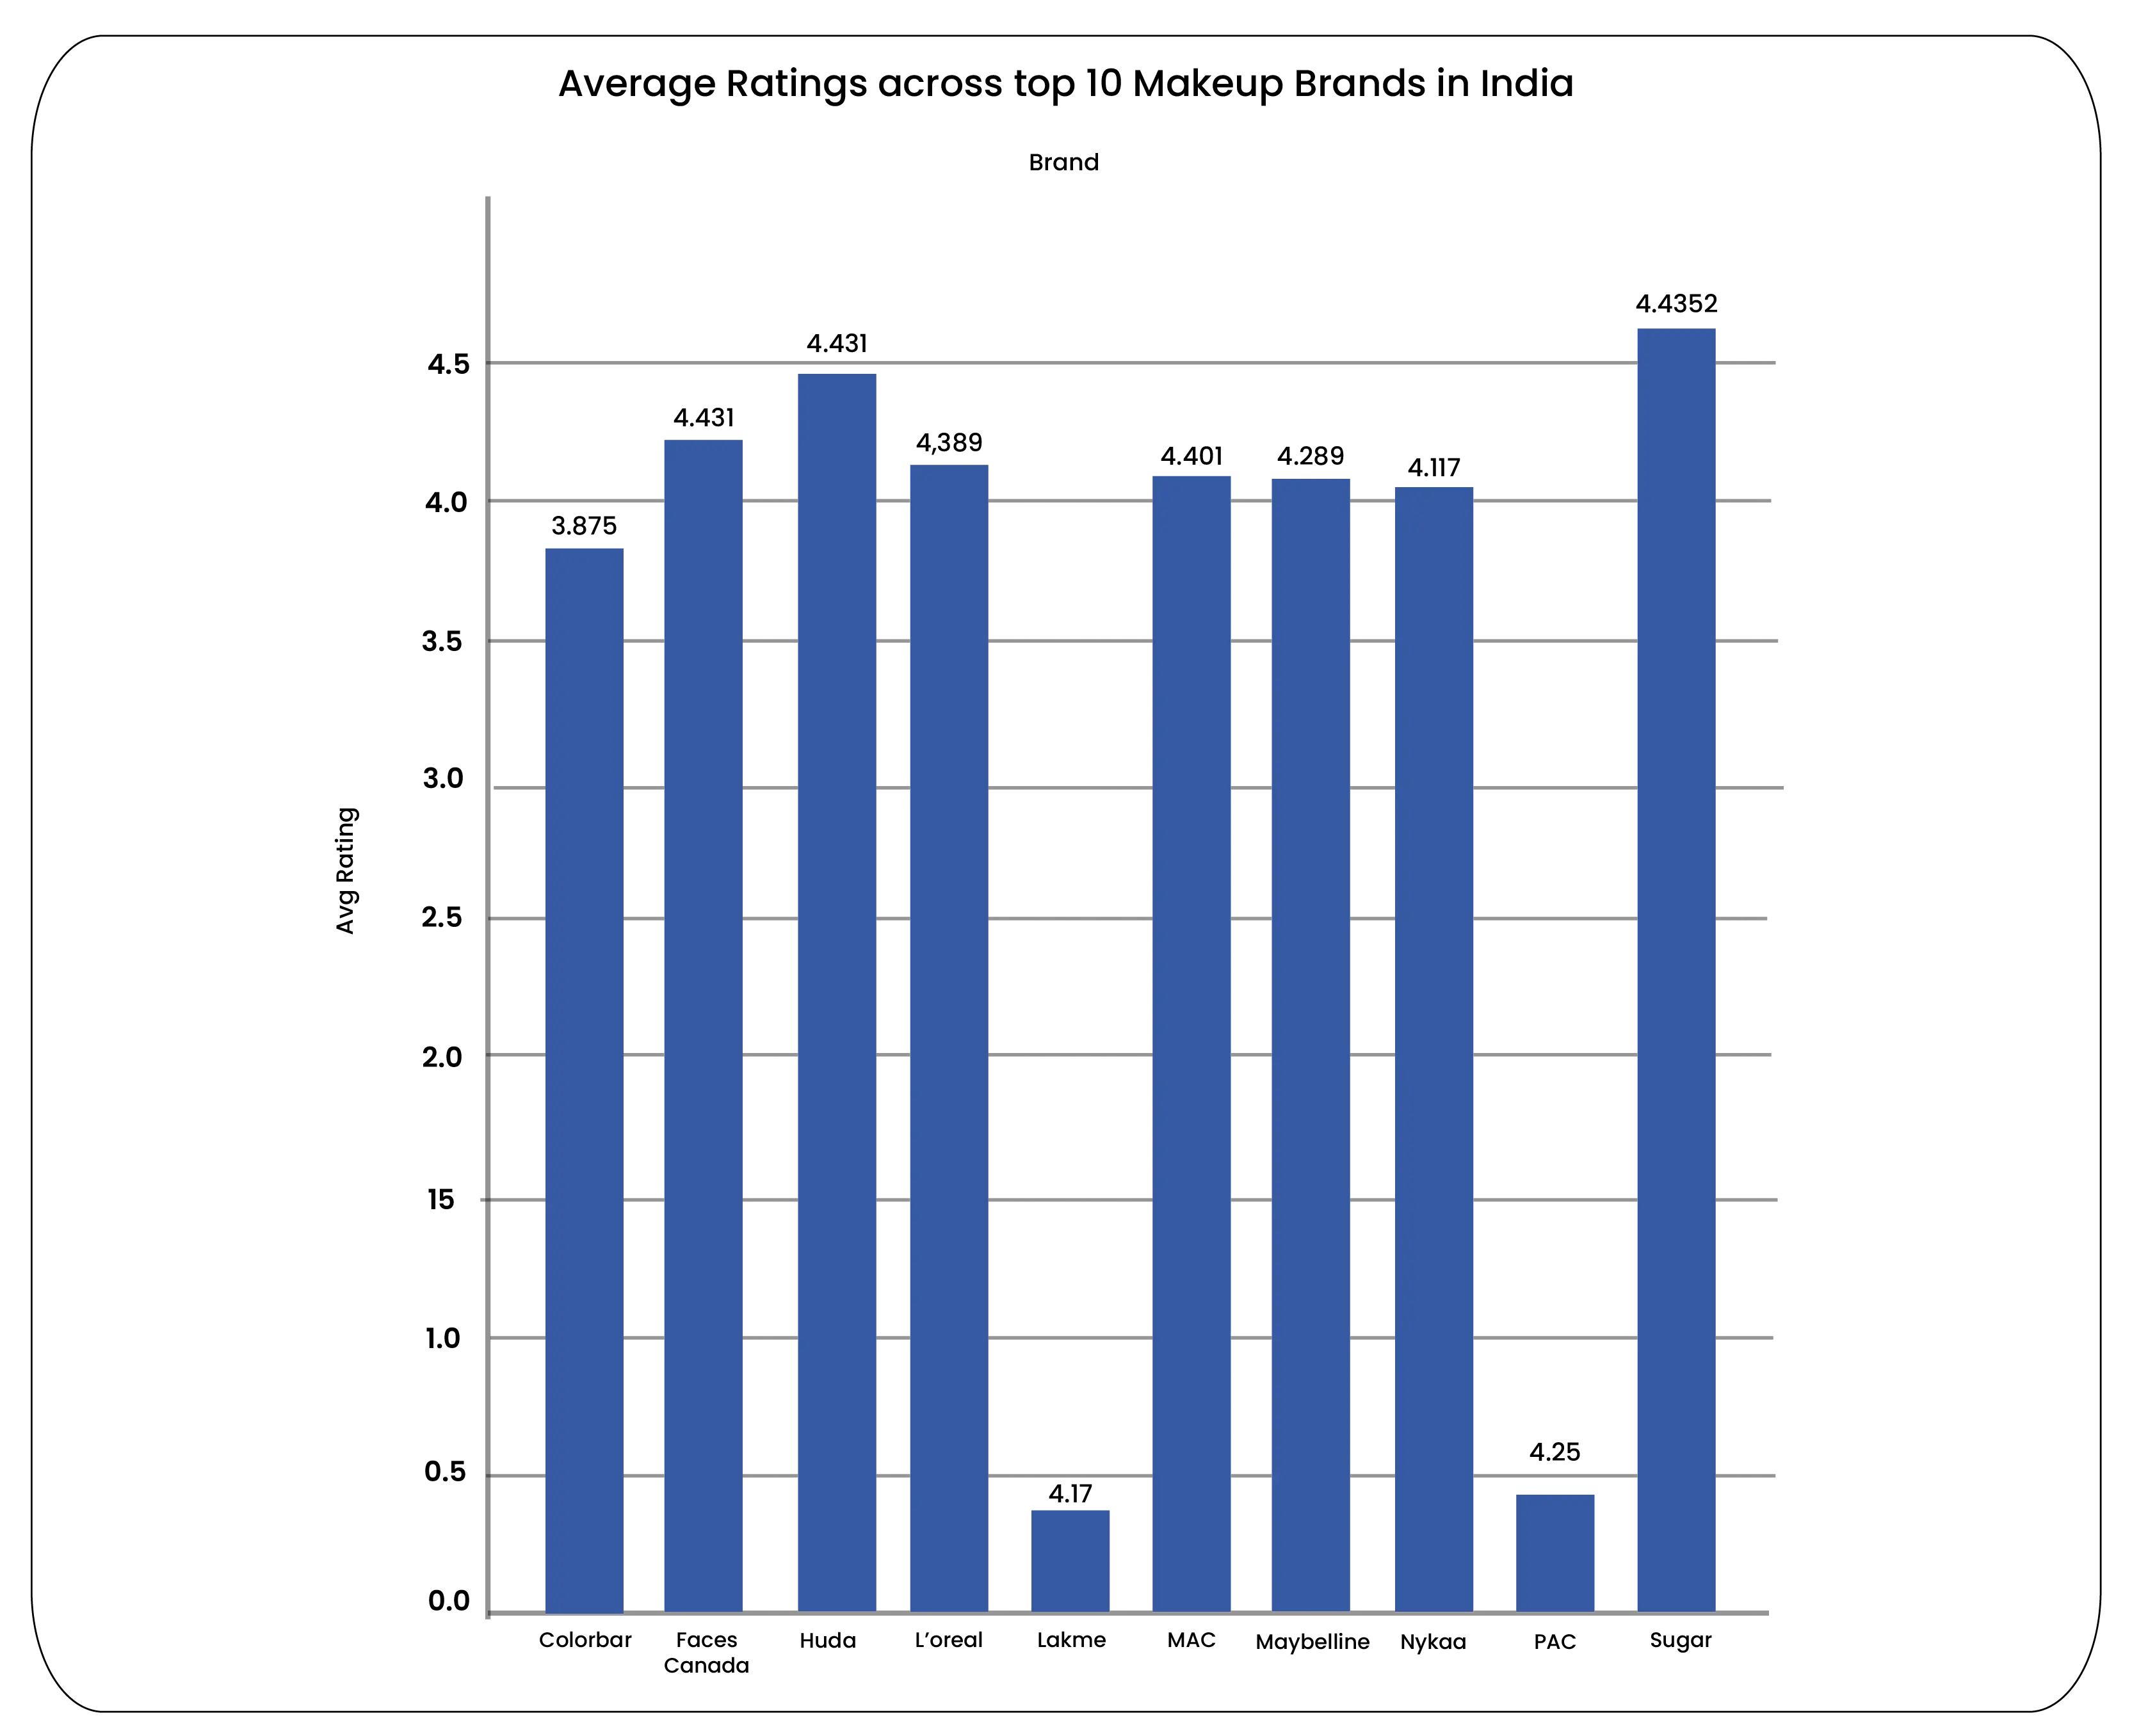
Insights into Average Ratings Across Top 10 Makeup Brands
Average ratings are pivotal for beauty brands, serving as a consolidated measure of customer satisfaction and product quality. These ratings guide consumers seeking assurance in purchasing decisions and provide brands valuable feedback for continuous improvement.
Our analysis of the top 10 makeup brands reveals compelling insights:
Huda Beauty leads with the highest average rating of 4.6, reflecting exceptional customer satisfaction and product acclaim within the beauty community.
Conversely, Colorbar holds the lowest average rating of 3.8, indicating variability in customer feedback across its product range.
Multiple brands, including L’Oreal Paris, MAC, Faces, and Sugar Cosmetics, have notably achieved an average rating of 4.4, showcasing consistent customer satisfaction across a diverse range of products.
Explore our visualization to understand the distribution of average ratings across these leading makeup brands, illuminating their strengths and customer preferences in the competitive beauty market.
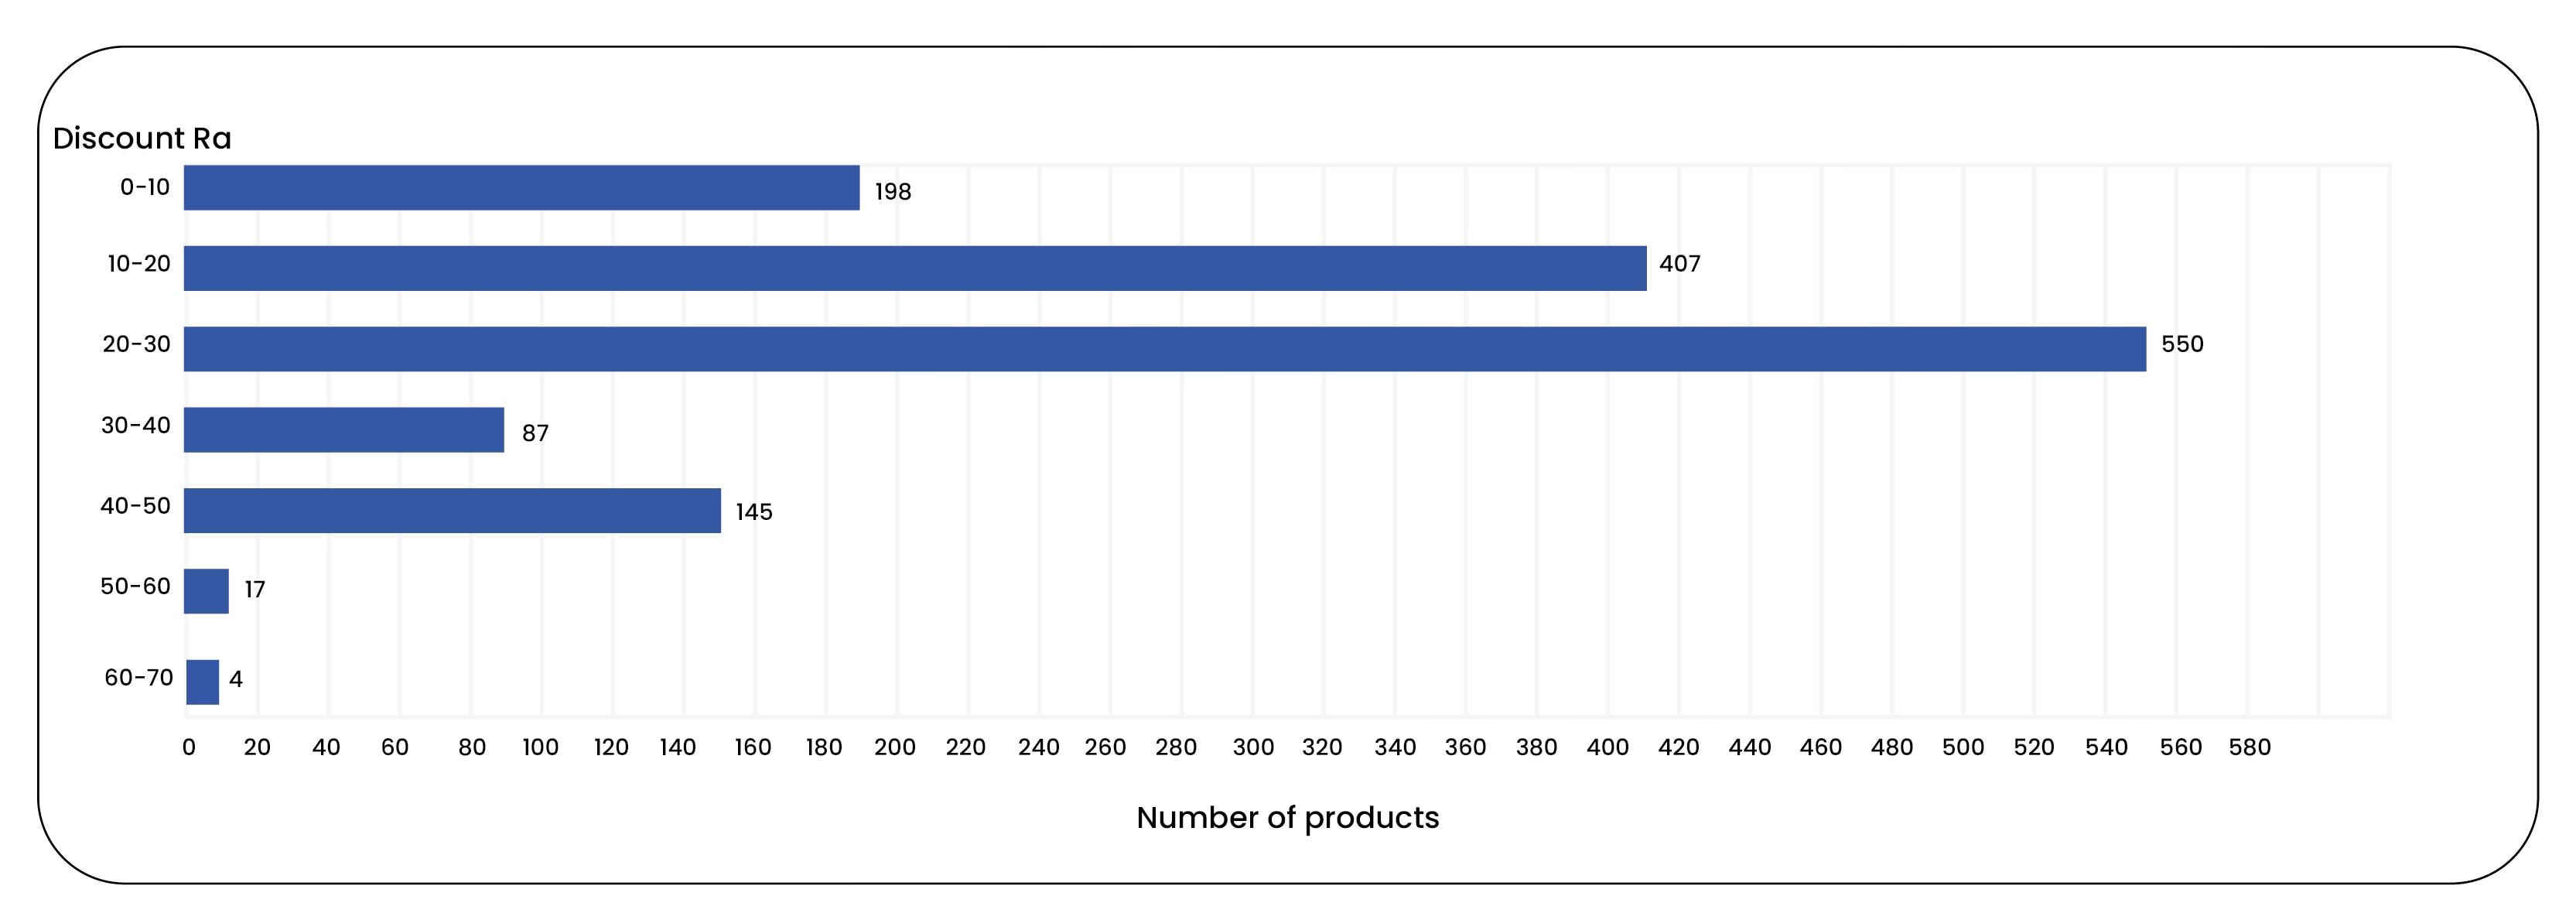
Insights into Discount Range Across Top 10 Makeup Brands
Understanding the discount range across products provides valuable insights into how brands strategically price their offerings to attract consumers. This metric highlights the discount variation, influencing consumer perceptions and purchase decisions.
In our analysis of the top 10 makeup brands, we uncovered the following insights:
Out of the 3,200 products surveyed, approximately 55% (1,760 products) were offered at their regular price without any discounts.
The most prevalent discount range observed was between 15% and 25%, encompassing 30% of all products (960 products), showcasing brands' strategic use of moderate discounts to stimulate sales.
Following closely, the 10% to 15% discount range accounted for 20% of products (640 products), indicating a common strategy among brands to offer modest discounts across their product lines.
The widest discount range observed was 50% to 60%, although only 5 products (0.2% of total) fell into this category, suggesting selective use of deep discounts by certain brands.
Explore our visualization to gain deeper insights into how discount ranges are distributed across these leading makeup brands, influencing consumer perceptions and brand positioning in the competitive beauty market.
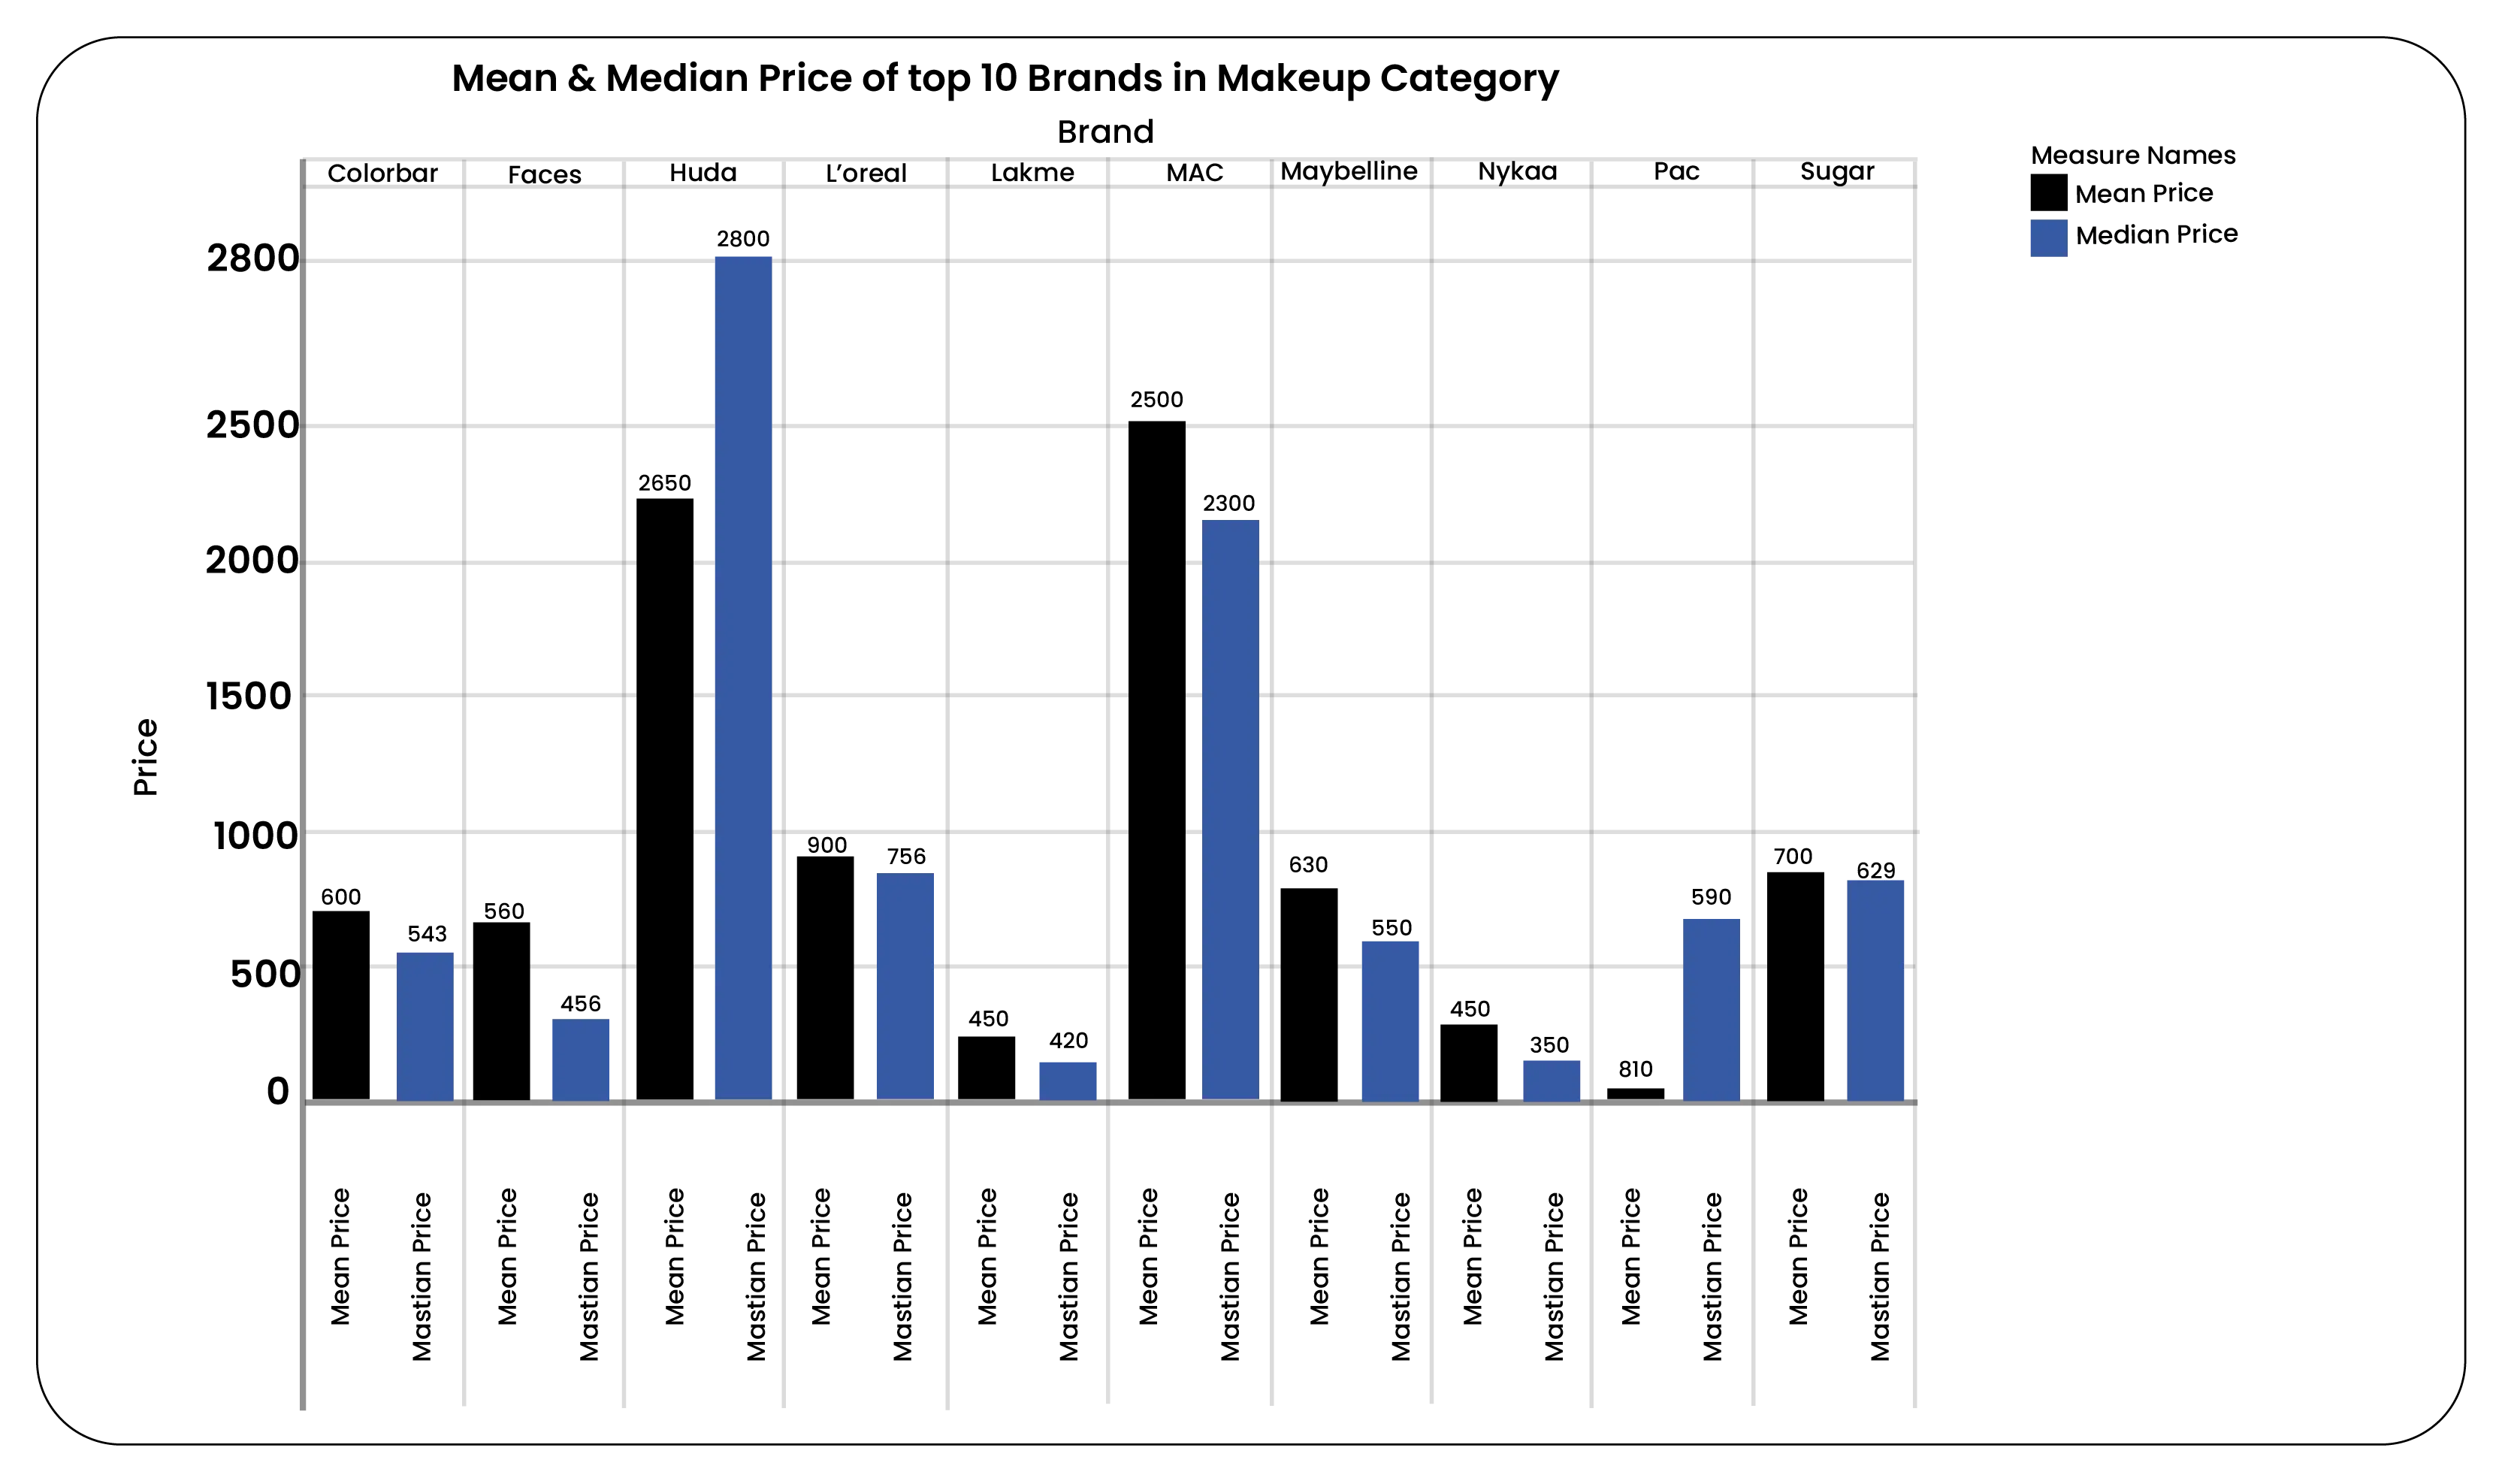
Insights into Mean and Median Prices Across Top 10 Makeup Brands
Understanding the mean and median prices across makeup brands provides valuable insights into their pricing strategies and product positioning within the market. These metrics offer distinct perspectives on their product offerings' average and middle-most prices.
In our analysis of the top 10 makeup brands, key findings emerged:
Huda Beauty commands the highest mean price at Rs 2650, reflecting its premium positioning in the luxury offerings market.
Conversely, Nykaa, with its lowest mean price of Rs 450, is a brand that is committed to inclusivity, offering affordable product options to a broader consumer base.
The median price comparison reveals that products from Huda Beauty have the highest median price at Rs 2800, underscoring consistent pricing in the higher range of its product lineup.
In contrast, Nykaa's products exhibit the lowest median price of Rs 350, indicating accessibility and competitive pricing in the market.
Explore our interactive visualization to learn more about the mean and median prices of these leading makeup brands. It offers insights into their pricing strategies and consumer appeal.
Conclusion: Welcome to our blog, dedicated to unraveling the complexities of India's vibrant makeup industry. This dynamic sector, valued at billions of dollars, continually sees new product launches that shape consumer preferences and market trends yearly.
Our mission is to provide you with a comprehensive understanding of this ever-evolving landscape. Through detailed analysis of past and future market trends, we aim to equip brands with actionable insights to navigate and thrive in this competitive market.
From understanding consumer demands to identifying emerging product trends, our blog is a compass for retailers looking to stay ahead of the curve. Whether you're a new entrant or a seasoned player, our data-driven approach offers valuable perspectives on capitalizing on opportunities and optimizing business strategies.
Join us as we delve into the nuances of the Indian makeup industry, offering practical insights and strategic advice to empower retailers nationwide. Let's uncover the trends, innovations, and strategies that will shape the future of makeup in India.
At Product Data Scrape, ethical principles are central to our operations. Whether it's Competitor Price Monitoring Services or Mobile App Data Scraping, transparency and integrity define our approach. With offices spanning multiple locations, we offer customized solutions, striving to surpass client expectations and foster success in data analytics.






.webp)


