Introduction
Predicting online food delivery demand has become one of the biggest challenges for brands,
restaurants, and delivery platforms operating in competitive urban markets. As cities expand and
customer preferences shift rapidly, businesses need structured data-driven methods to understand
demand patterns at a hyperlocal level. That’s where city clustering becomes a powerful
technique. By grouping localities with similar order behavior, cuisine preferences, pricing
sensitivity, and delivery density, businesses can optimize their decisions with greater
accuracy. In this guide, we explore how to extract foodpanda data for demand prediction and how
city clustering strategies help organizations identify trends, allocate resources, and stay
competitive in an ever-evolving digital food ecosystem. This blog breaks down key datasets,
advanced scraping methods, customer insight extraction, and the role of real-time data in
enhancing prediction accuracy. With a detailed breakdown of 2020–2025 trends, you’ll gain a
clear understanding of what to collect, how to structure your findings, and how to use them to
build powerful demand-forecasting models tailored for the online food delivery industry.
Market Dynamics for Restaurant & Delivery Patterns
Understanding restaurant and delivery patterns across different regions is essential for
building meaningful demand-forecasting models. Urban consumption behavior is deeply influenced
by cuisine trends, working hours, festive cycles, and local delivery availability. To conduct
accurate analysis, businesses often need to Extract foodpanda restaurant and delivery data that
provides insights into restaurant density, peak time orders, delivery shortages, and customer
wait-time patterns. Clustering cities based on these metrics helps identify regions with similar
order characteristics. For example, highly urbanized clusters show higher late-night orders,
whereas residential zones show peak activity between 6–9 PM. Analyzing delivery supply-demand
imbalance across clusters helps restaurants optimize staffing and delivery partners. Below is an
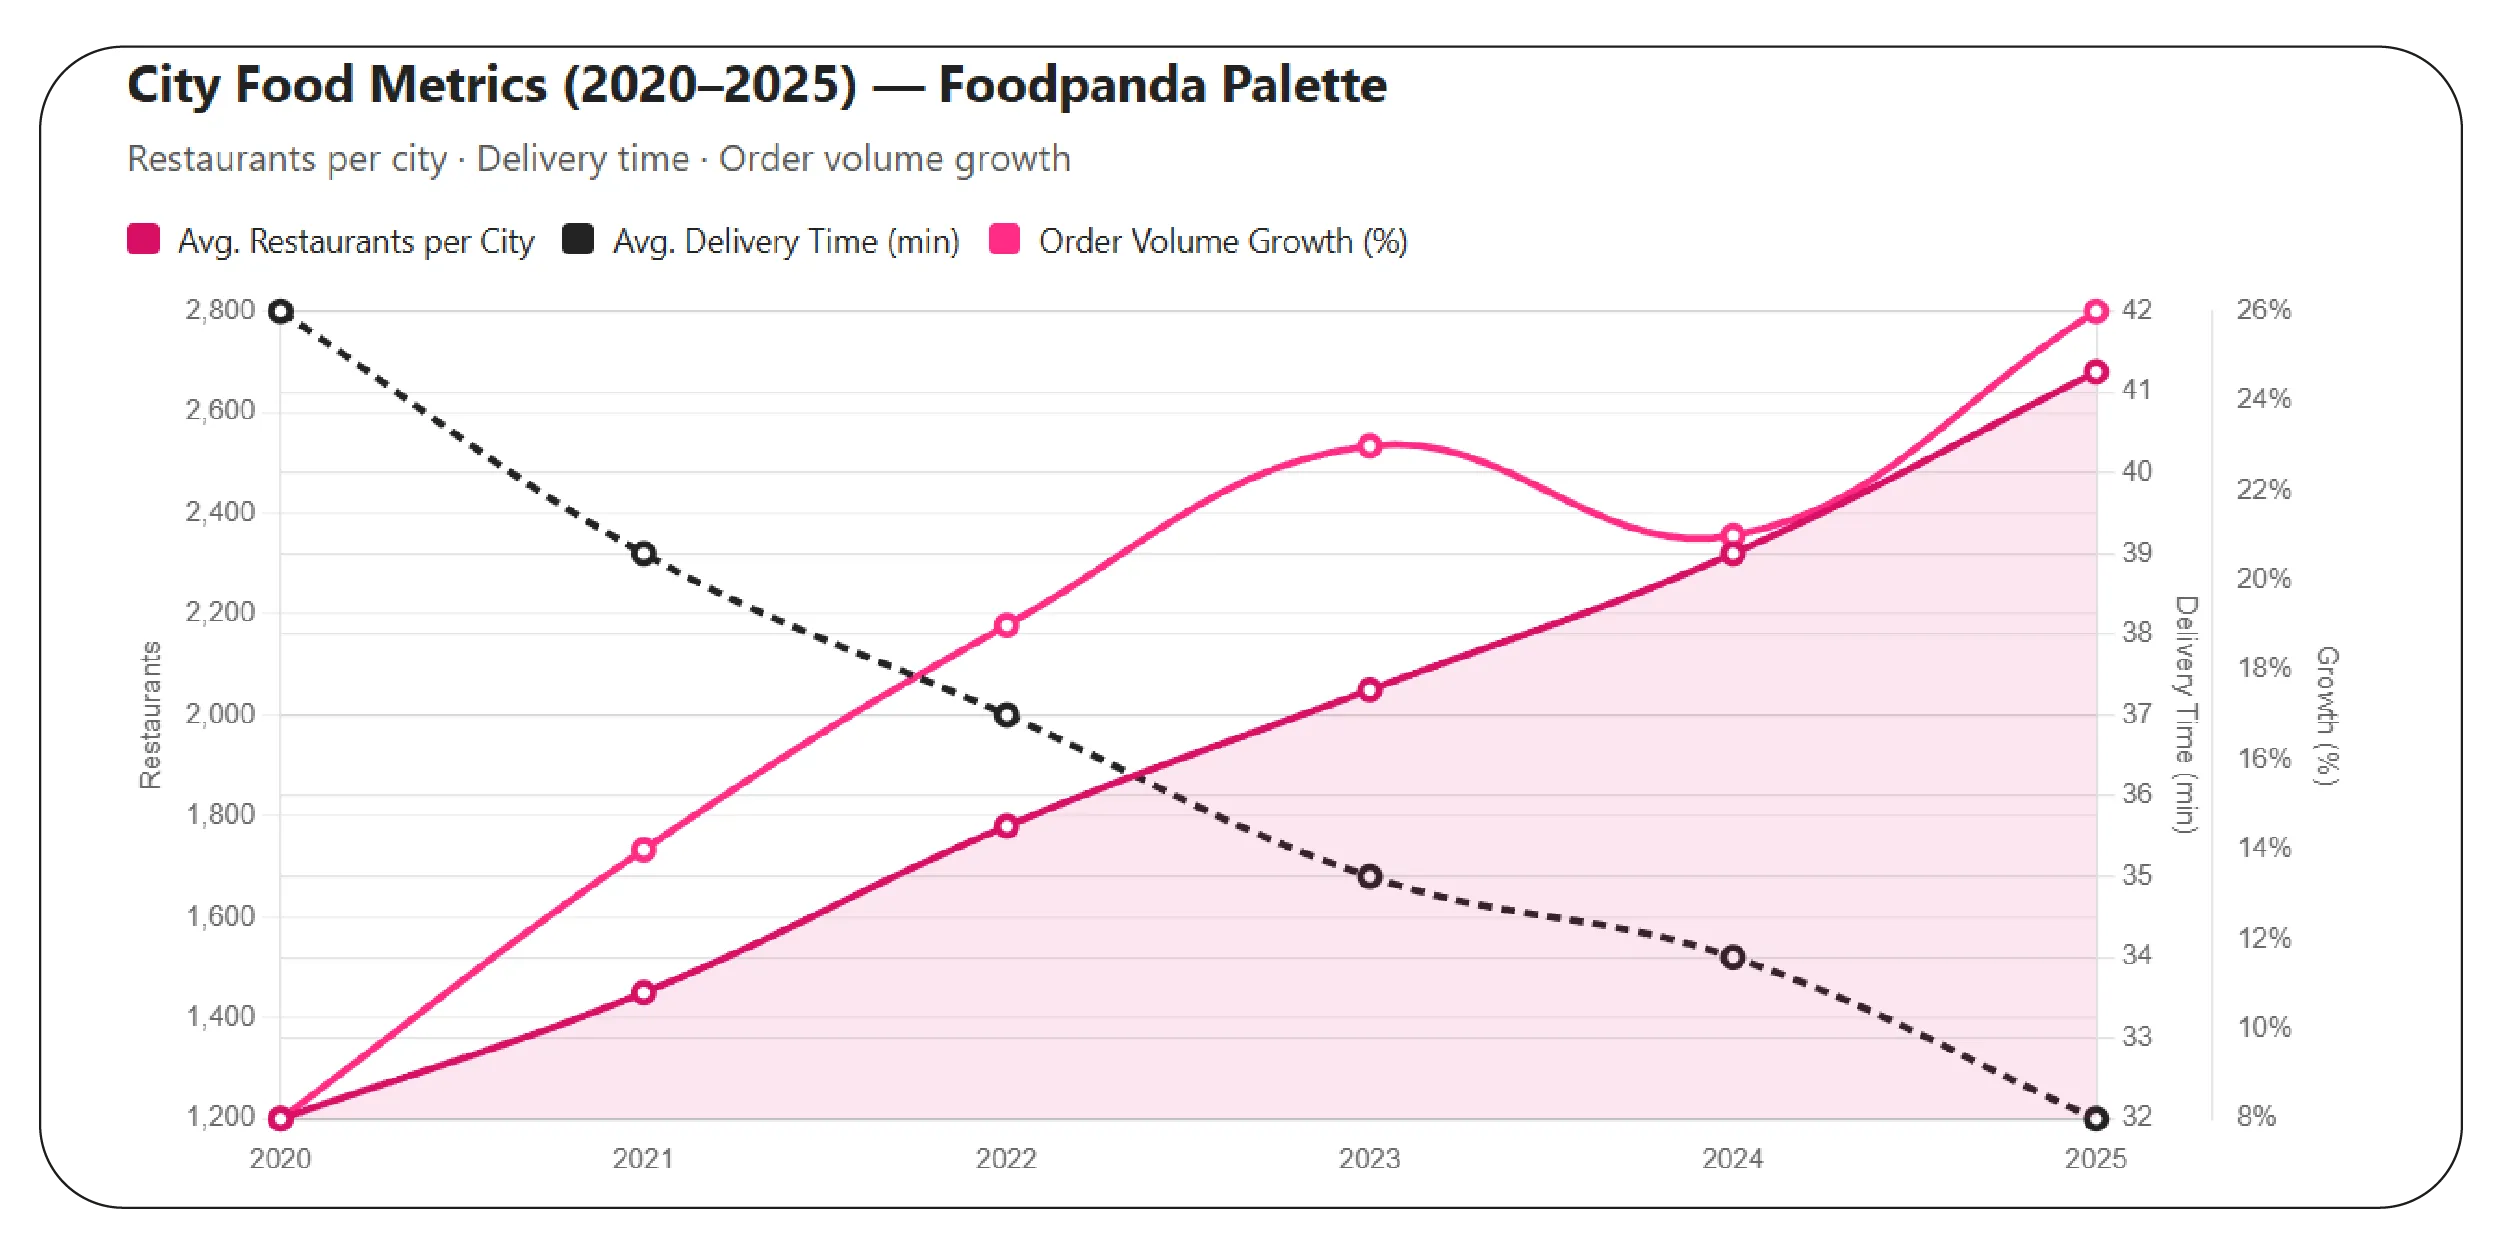
illustrative dataset summarizing restaurant activity trends from 2020–2025 that businesses use
for demand prediction:
| Year |
Avg. Restaurants per City |
Avg. Delivery Time (min) |
Order Volume Growth (%) |
| 2020 |
1,200 |
42 |
8% |
| 2021 |
1,450 |
39 |
14% |
| 2022 |
1,780 |
37 |
19% |
| 2023 |
2,050 |
35 |
23% |
| 2024 |
2,320 |
34 |
21% |
| 2025 |
2,680 |
32 |
26% |
This trend clearly shows steady restaurant expansion and reduced delivery times—key factors to
consider when clustering cities for more precise demand forecasting.
Understanding Behavioral Shifts Across Customer Segments
Customer behavior is a core component of accurate demand prediction, and understanding shifting
preferences requires structured data monitoring. Businesses often need to Scrape Foodpanda
Customer Insights For Data Analysis to understand what influences ordering frequency, cuisine
popularity, cart values, and reorder cycles. These insights help categorize cities based on
customer lifestyle patterns, spending capacity, and ordering triggers. For instance,
metropolitan clusters exhibit high demand for fast food and international cuisines, while tier-2
cities lean more toward regional and value-driven meals. Customer sentiment derived from reviews
also reveals pain points such as inconsistent delivery or limited restaurant choices in certain
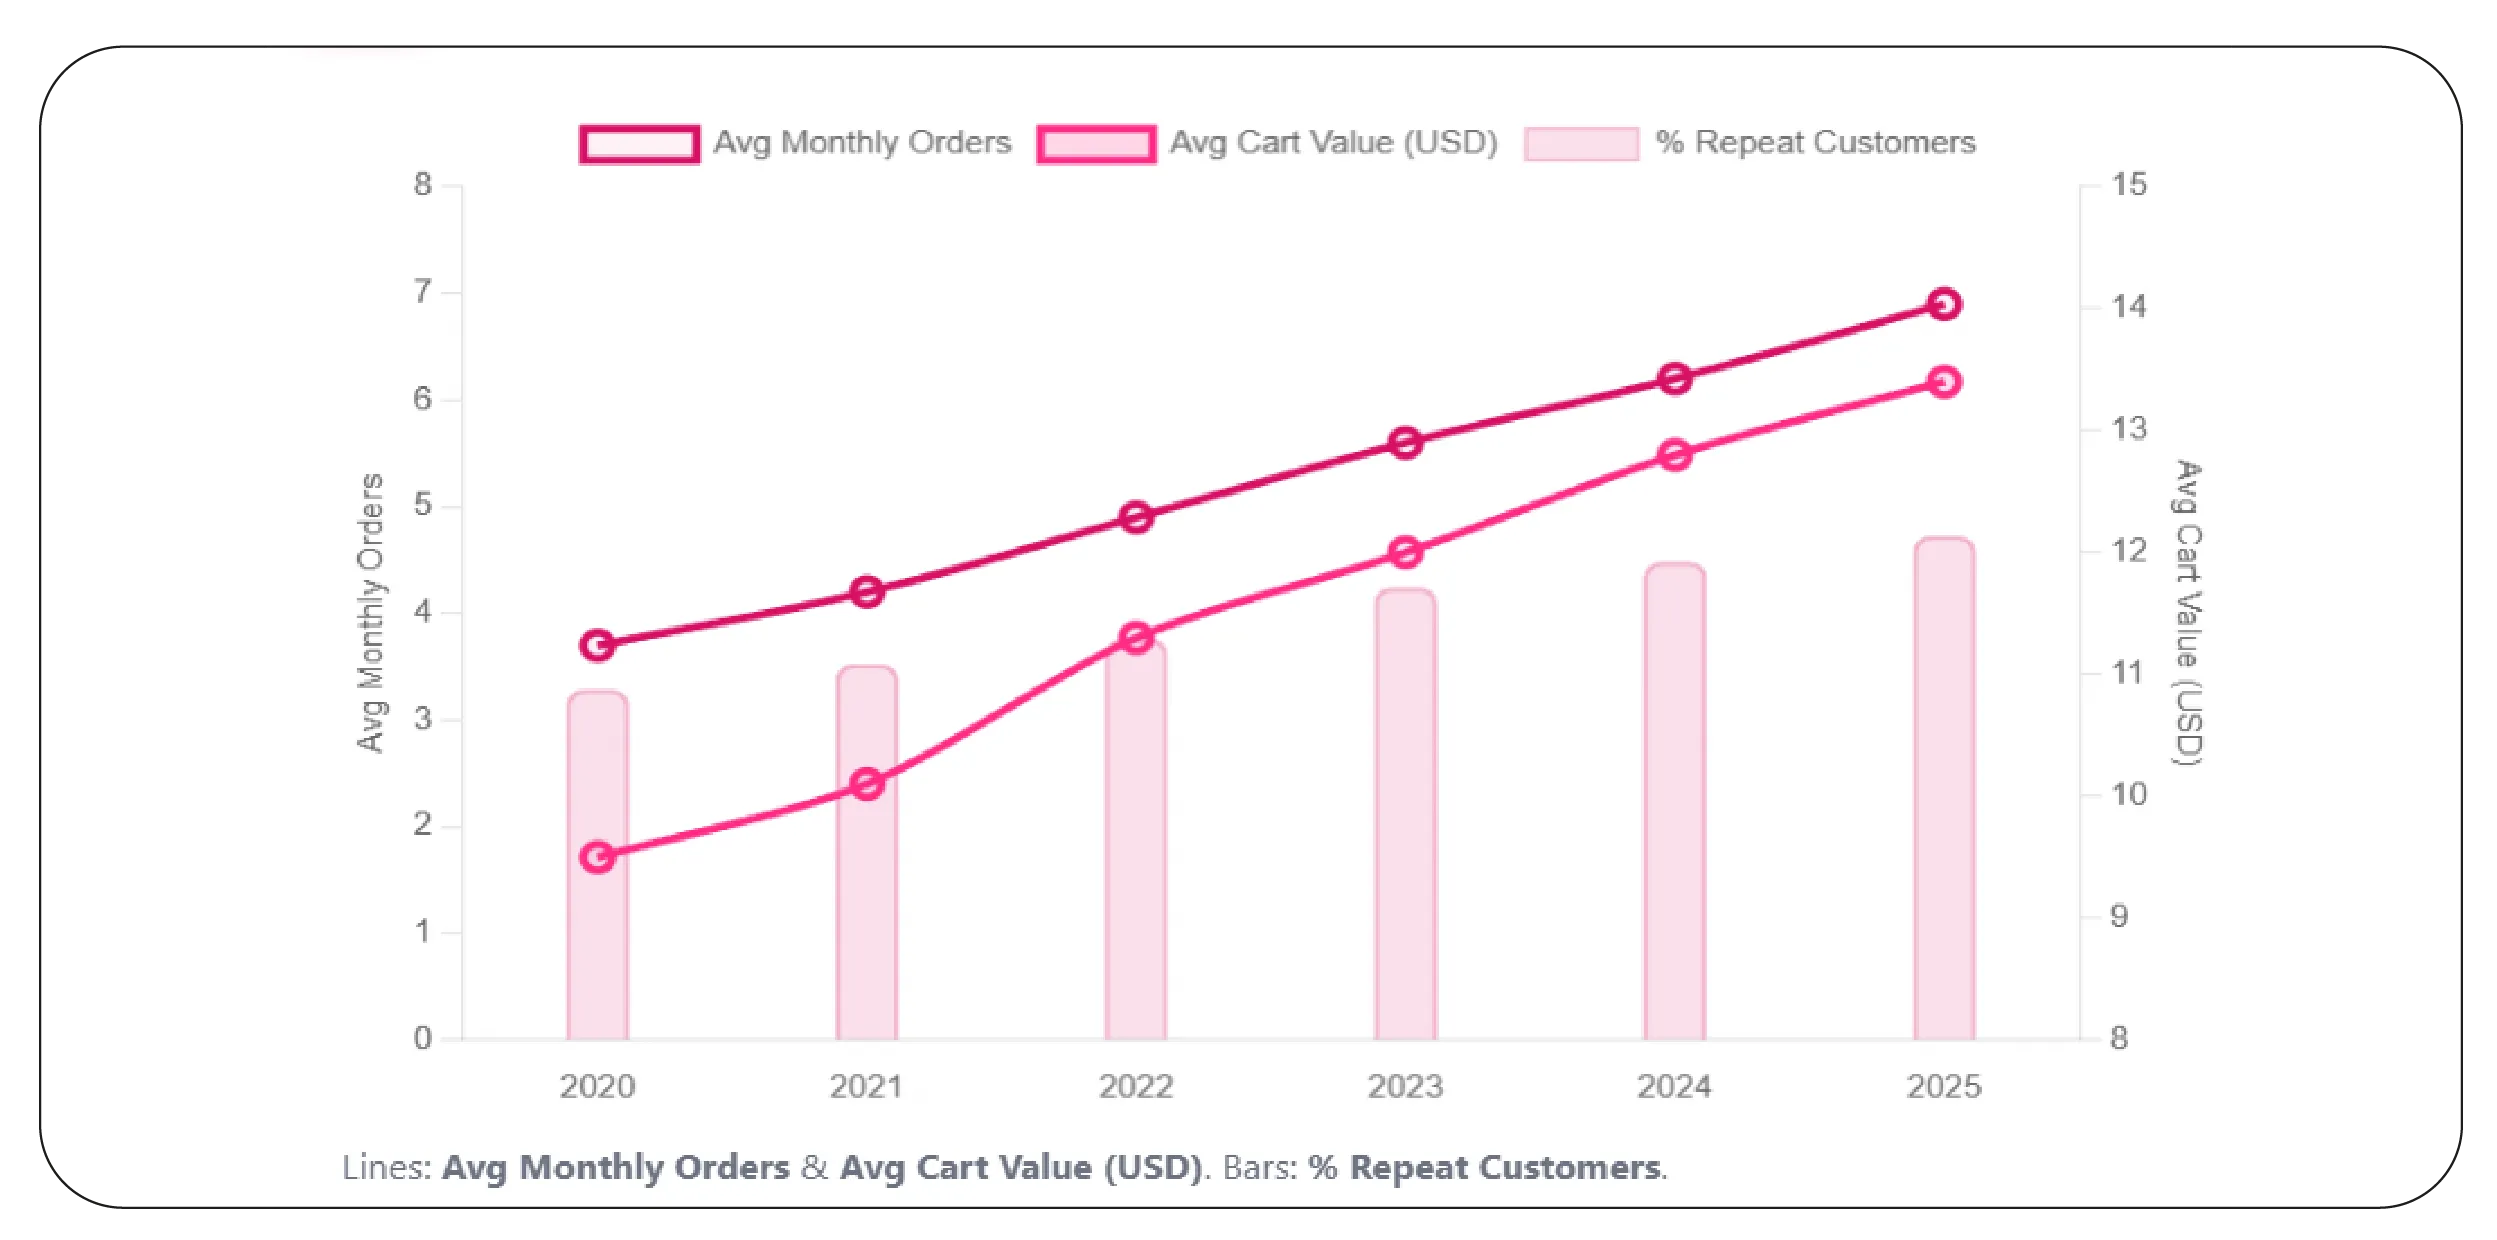
zones. By tracking changes from 2020 to 2025, brands can identify long-term behavioral cycles.
The table below highlights an example of customer-centric data extracted for clustering
analysis:
| Year |
Avg. Monthly Orders per User |
Popular Cuisine Rank 1 |
Avg. Cart Value (USD) |
% Repeat Customers |
| 2020 |
3.7 |
Fast Food |
9.5 |
41% |
| 2021 |
4.2 |
Fast Food |
10.1 |
44% |
| 2022 |
4.9 |
Asian |
11.3 |
47% |
| 2023 |
5.6 |
Asian |
12.0 |
53% |
| 2024 |
6.2 |
Asian |
12.8 |
56% |
| 2025 |
6.9 |
Healthy Bowls |
13.4 |
59% |
Such insights allow businesses to map customer clusters more effectively and tailor localized
marketing campaigns, pricing strategies, and menu recommendations.
Evaluating Location-Based Availability & Pricing Trends
City clustering requires granular evaluation of delivery availability, surge pricing behavior,
restaurant pricing variations, and service coverage. Businesses often compile a foodpanda
delivery availability and pricing dataset to assess how delivery operations differ between
high-density and low-density regions. Availability gaps highlight where delivery partners are
insufficient, while pricing patterns reflect market competitiveness. In high-traffic commercial
zones, frequent surge pricing indicates consistent demand pressure, whereas residential clusters
show more stable pricing throughout the day. Pricing sensitivity helps classify cities into
premium, mid-market, and budget segments. Below is a 2020–2025 snapshot illustrating delivery
availability and pricing trends used for cluster modeling:
| Year |
Avg. Delivery Availability (%) |
Surge Pricing Incidents per Month |
Avg. Meal Price (USD) |
| 2020 |
84% |
28 |
6.8 |
| 2021 |
88% |
24 |
7.3 |
| 2022 |
90% |
31 |
7.9 |
| 2023 |
93% |
34 |
8.4 |
| 2024 |
95% |
29 |
8.9 |
| 2025 |
96% |
26 |
9.4 |
These pricing and availability indicators help forecast peak demand zones and predict where
delivery delays or order surges are likely to occur.
Using Instant Data Streams for Live Decision-Making
Real-time data plays a critical role in predicting consumer demand, especially in fast-changing
market environments. Businesses utilize real-time foodpanda data extraction for analytics to
access live order spikes, rider availability, delivery time fluctuations, and fresh customer
feedback. Unlike static datasets, real-time streams reveal immediate shifts—such as sudden food
trends, local events, weather disruptions, and hyperlocal delivery bottlenecks. Clustering
cities based on real-time volatility helps classify regions into stable, semi-volatile, and
highly dynamic segments. This enables quicker decision-making for surge pricing, inventory
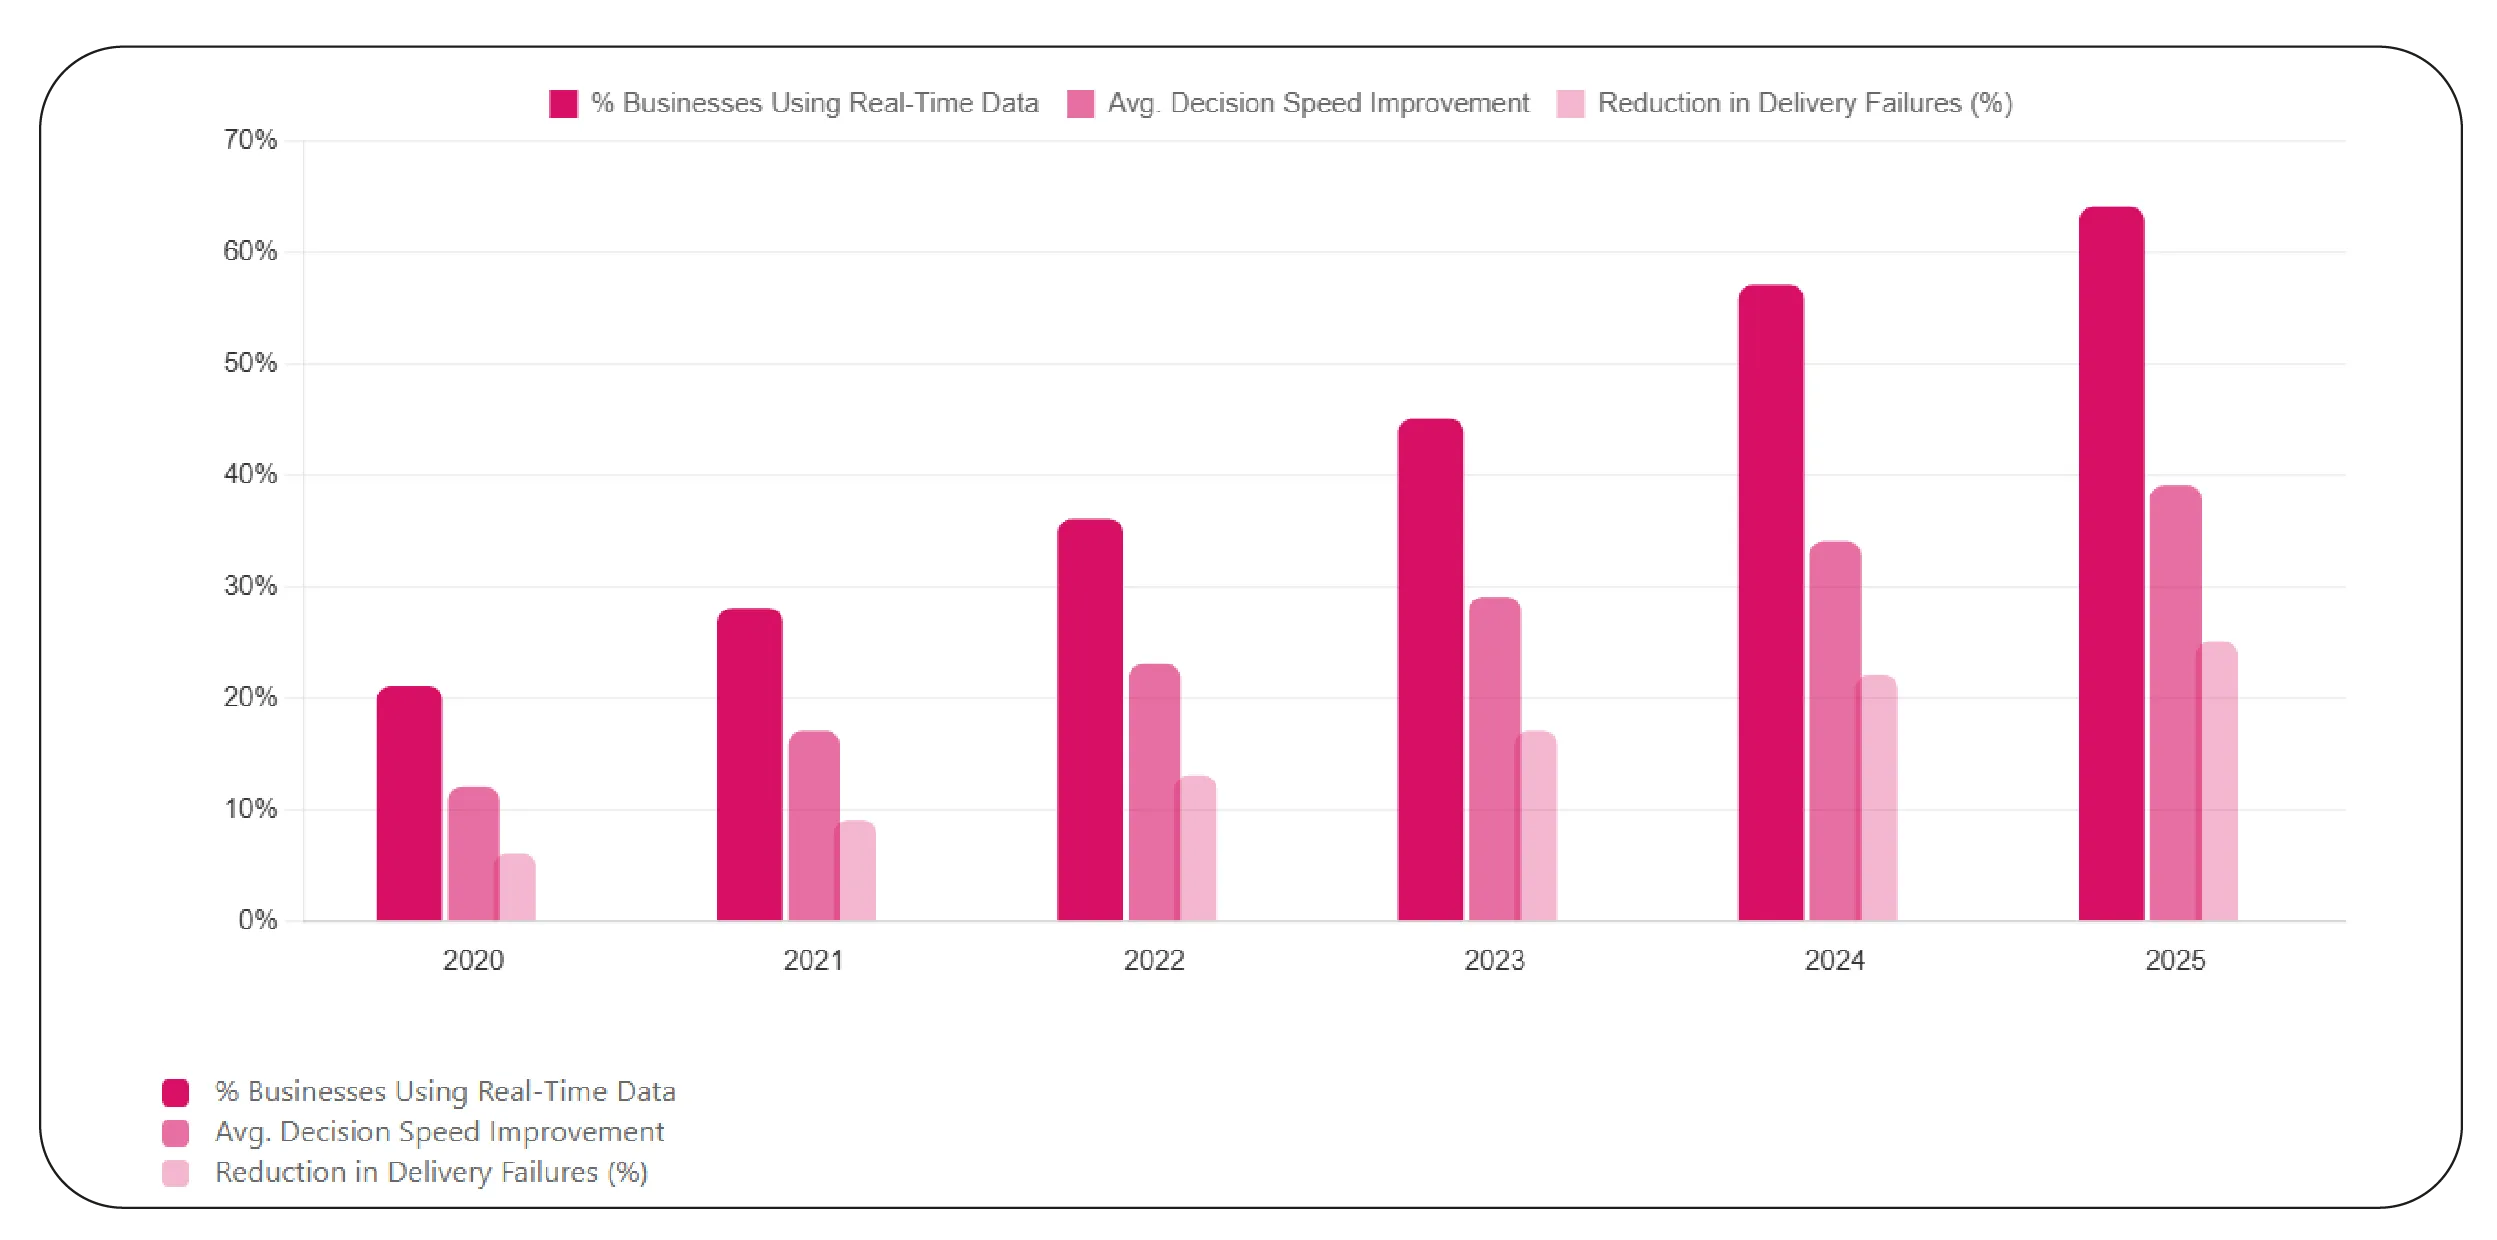
restocking, and delivery partner deployment. Between 2020 and 2025, instant data-based decision
systems became increasingly prevalent, as shown below:
| Year |
% Businesses Using Real-Time Data |
Avg. Decision Speed Improvement |
Reduction in Delivery Failures (%) |
| 2020 |
21% |
12% |
6% |
| 2021 |
28% |
17% |
9% |
| 2022 |
36% |
23% |
13% |
| 2023 |
45% |
29% |
17% |
| 2024 |
57% |
34% |
22% |
| 2025 |
64% |
39% |
25% |
Real-time clustering makes forecasting more responsive, accurate, and aligned with rapid market
shifts.
Tracking Price Movements Across Local Markets
Price fluctuations shape regional demand behavior, affecting everything from user order
frequency to average cart value. Businesses aiming for accurate forecasting need to Scrape
foodpanda Prices Data and study pricing trends across restaurants, cuisines, and time periods.
Price elasticity varies significantly between city clusters: premium clusters tolerate higher
price ranges, while value-focused regions respond strongly to offers and discounts. Monitoring
changes from 2020 to 2025 reveals how price sensitivity evolved. A structured table capturing
these pricing dynamics is provided below:
| Year |
Avg. Discount Usage (%) |
Avg. Menu Price Increase (%) |
Customer Sensitivity Score* |
| 2020 |
38% |
3% |
72 |
| 2021 |
42% |
4% |
69 |
| 2022 |
47% |
5% |
66 |
| 2023 |
51% |
6% |
62 |
| 2024 |
54% |
5% |
60 |
| 2025 |
58% |
4% |
57 |
*Sensitivity score represents customer responsiveness to price changes (higher = more
sensitive).
Expanding Beyond Food – Analyzing Q-Commerce Growth
Quick commerce has rapidly emerged as a major growth segment, influencing demand patterns across
food and non-food
products. Businesses analyze purchase cycles, delivery time expectations, and product assortment
by choosing to
Extract Quick Commerce Product Data from marketplaces that operate on short delivery windows.
Clustering cities based
on q-commerce performance reveals patterns in household essentials, snacks, beverages, and OTC
product demand.
From 2020 to 2025, q-commerce adoption saw exponential growth, which significantly influenced
delivery infrastructure
planning. Here’s a sample trend comparison:
| Year |
Q-Commerce Orders (M) |
Avg. Delivery Time (min) |
% Orders < 20 min |
| 2020 |
28 |
32 |
14% |
| 2021 |
41 |
27 |
22% |
| 2022 |
58 |
24 |
33% |
| 2023 |
74 |
21 |
41% |
| 2024 |
98 |
18 |
52% |
| 2025 |
121 |
16 |
64% |
These insights help businesses create cluster-based strategies for assortment planning, delivery
fleet allocation,
and real-time inventory management.
Why Choose Product Data Scrape?
Product Data Scrape specializes in building intelligent scraping solutions designed to support
high-quality predictive analytics for the food delivery and q-commerce industries. Whether you
need Foodpanda Quick Commerce Scraper solutions, city-level segmentation, or detailed
operational metrics, our tools deliver structured datasets with high accuracy. We also help
businesses extract foodpanda data for demand prediction, enabling them to uncover meaningful
insights and enhance marketing, pricing, and logistics strategies with confidence.
Conclusion
City clustering has proven to be one of the most effective analytical strategies for forecasting
demand in the online food delivery industry. With access to the right datasets—restaurants,
customers, pricing, availability, and q-commerce—businesses can build tailored prediction models
for every region. When you extract foodpanda data for demand prediction through automated,
scalable scraping systems, you gain the competitive advantage needed to make accurate decisions.
Ready to get started? Contact Product Data Scrape today to power your data-driven forecasting.
FAQs
1. Why is city clustering important for demand forecasting?
City clustering groups regions with similar behavior patterns, allowing businesses to predict
demand more accurately.
Instead of analyzing entire cities as a whole, clustering breaks them into manageable segments
where buying behavior,
delivery density, and pricing trends align. This approach results in better resource allocation,
improved marketing
targeting, and higher forecasting accuracy.
2. What types of Foodpanda data are useful for demand prediction?
Useful datasets include restaurant availability, customer ordering patterns, delivery times,
menu pricing, surge
events, and q-commerce product details. These combined metrics help identify when, where, and
why demand rises.
Structured datasets provide the foundational insights needed for building machine learning
models that forecast
real-world scenarios across different city clusters.
3. Can businesses rely on real-time data for improving demand forecasting?
Yes. Real-time data helps teams react instantly to order spikes, weather disruptions, holidays,
and operational
issues. When integrated with city clustering, real-time metrics allow brands to update
predictions dynamically.
This reduces delivery delays and enables smarter surge pricing, making operations more efficient
while improving
customer satisfaction.
4. How often should Foodpanda datasets be updated for accurate forecasting?
For high-demand urban markets, daily or hourly updates are recommended. Customer preferences and
delivery conditions
change rapidly, especially during holidays, weekends, and major events. Updated datasets ensure
the forecasting
model remains relevant, accurate, and aligned with real-time market behavior. For smaller
regions, weekly updates
may be sufficient.
5. How does Product Data Scrape support large-scale datasets?
Product Data Scrape builds automated pipelines capable of extracting millions of data points
across multiple
regions. Our systems support scalable crawling, structured formatting, and cluster-ready
segmentation. This ensures
businesses receive clean, real-time, and actionable datasets for forecasting, operational
planning, pricing analysis,
and cluster-based decision-making.


.webp)