Introduction
Yes. Businesses can improve pricing, product visibility, inventory planning, and customer engagement by leveraging Scrape Social Commerce Data. Real-time insights into products, sellers, consumer interactions, and marketplace trends help brands make faster, data-driven decisions and outperform competitors across social shopping platforms.
Industry Insight: Industry reports estimate that the global social commerce market will exceed USD 2 trillion by 2026, with platforms like TikTok Shop, Facebook Marketplace, Temu, and Whatnot driving significant growth. Businesses using marketplace intelligence consistently achieve higher customer engagement and stronger conversion rates.
Social commerce has transformed online shopping by combining social engagement with seamless purchasing experiences. Consumers no longer discover products only through traditional e-commerce websites. They now purchase directly from social platforms through live shopping events, creator recommendations, short-form videos, and marketplace listings.
Businesses that Scrape Social Commerce Data gain valuable visibility into pricing trends, seller performance, inventory availability, customer engagement, product popularity, and promotional campaigns. Combined with Every e-commerce data solution, these insights help retailers, brands, manufacturers, and marketplace analysts understand evolving consumer behavior while improving pricing strategies and digital shelf performance.
Real-time marketplace intelligence enables organizations to benchmark competitors, monitor trending products, optimize marketing campaigns, and forecast customer demand. Instead of relying on delayed reports, businesses can react immediately to changing market conditions and strengthen their competitive advantage across rapidly expanding social commerce ecosystems.
Why Is Social Commerce Growing So Quickly?
Consumers increasingly prefer interactive shopping experiences because they provide:
- Live product demonstrations
- Instant purchasing options
- Personalized recommendations
- Creator-driven product reviews
- Community engagement
- Limited-time promotions
- Faster buying decisions
- Higher shopping convenience
These features continue driving higher conversion rates across social commerce platforms.
What Business Teams Benefit from Social Commerce Analytics?
Real-time social commerce intelligence supports multiple departments.
| Team |
Business Benefit |
| Marketing |
Campaign optimization |
| Pricing |
Competitive pricing strategies |
| Merchandising |
Product assortment planning |
| Sales |
Demand forecasting |
| Product Management |
Trend identification |
| Executive Leadership |
Strategic planning |
How Has Social Commerce Expanded Since 2020?
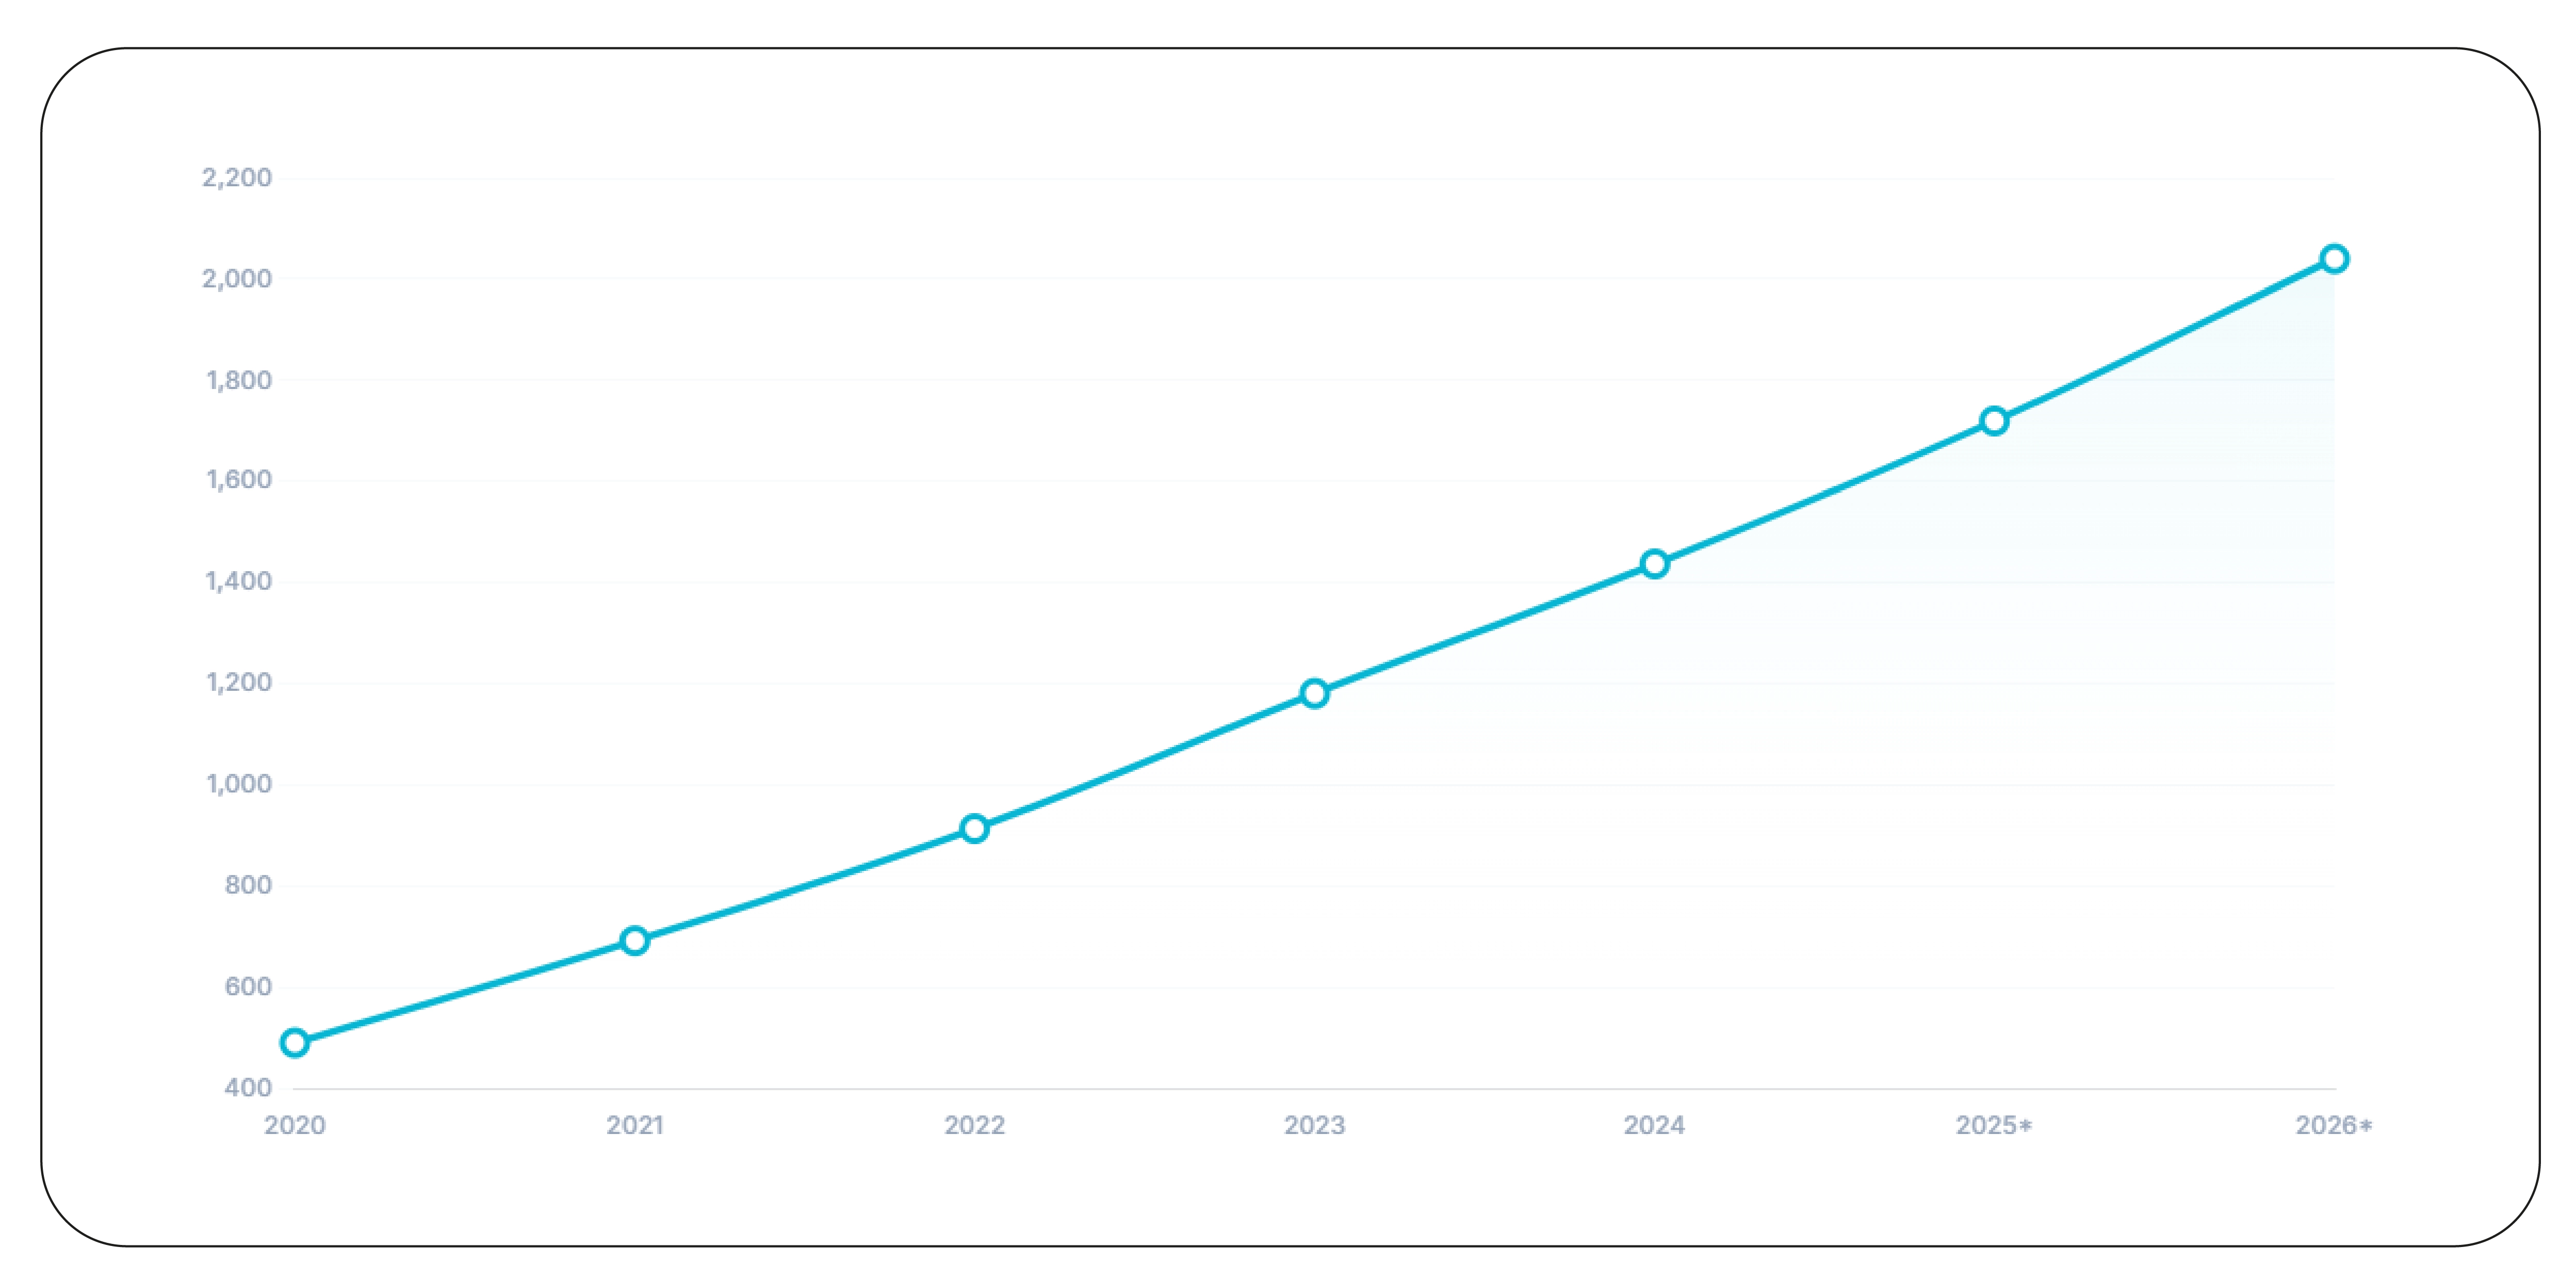
The rapid adoption of mobile commerce, creator marketing, and livestream shopping continues driving social commerce worldwide.
Social Commerce Market Growth (2020–2026)
| Year |
Global Social Commerce Market (USD Billion) |
Active Social Buyers (Millions) |
Annual Growth |
| 2020 |
492 |
870 |
24% |
| 2021 |
694 |
980 |
29% |
| 2022 |
915 |
1,110 |
32% |
| 2023 |
1,182 |
1,260 |
29% |
| 2024 |
1,438 |
1,410 |
22% |
| 2025* |
1,720 |
1,560 |
20% |
| 2026* |
2,040 |
1,730 |
19% |
*Projected industry estimates.
How Can Businesses Improve Marketplace Performance?
Organizations using marketplace analytics can:
- Track product popularity.
- Monitor seller performance.
- Analyze customer engagement.
- Compare pricing strategies.
- Measure promotional success.
- Forecast product demand.
- Improve inventory planning.
- Benchmark marketplace competitors.
Continuous monitoring enables faster and more informed decision-making.
How Can Businesses Identify Emerging Product Trends?
Consumer preferences shift rapidly across social commerce platforms. Products can become viral within hours due to livestream events, influencer promotions, or trending videos. Businesses therefore require continuous monitoring to identify high-performing products before competitors respond. Real-time catalog intelligence helps brands understand demand fluctuations while improving merchandising and inventory strategies.
Using Social Commerce Product Catalog Monitoring together with Whatnot livestream data, organizations can monitor product listings, assortment changes, pricing updates, inventory availability, and livestream performance across social shopping platforms. Businesses gain visibility into which products generate the highest engagement, how frequently catalogs change, and which categories experience the strongest sales growth. Livestream analytics also reveal viewer engagement, product popularity, and purchasing behavior during live selling events.
These insights support smarter assortment planning, promotional optimization, and product launch strategies. Marketing teams can identify trending products earlier, while merchandising teams optimize inventory using real-time marketplace intelligence. Continuous catalog monitoring reduces manual research and enables businesses to react quickly to changing consumer demand.
Product Catalog Trends (2020–2026)
| Year |
Products Monitored |
Livestream Events |
Catalog Updates per Day |
Engagement Index |
| 2020 |
420K |
32K |
18K |
68 |
| 2021 |
610K |
49K |
27K |
73 |
| 2022 |
890K |
71K |
38K |
79 |
| 2023 |
1.28M |
98K |
54K |
85 |
| 2024 |
1.74M |
126K |
71K |
90 |
| 2025* |
2.16M |
151K |
89K |
94 |
| 2026* |
2.63M |
179K |
108K |
97 |
Key Benefits
- Track product assortment changes.
- Monitor livestream shopping performance.
- Detect trending products faster.
- Improve inventory planning.
- Optimize promotional timing.
- Benchmark marketplace competitors.
Why Should Brands Monitor Seller Performance?
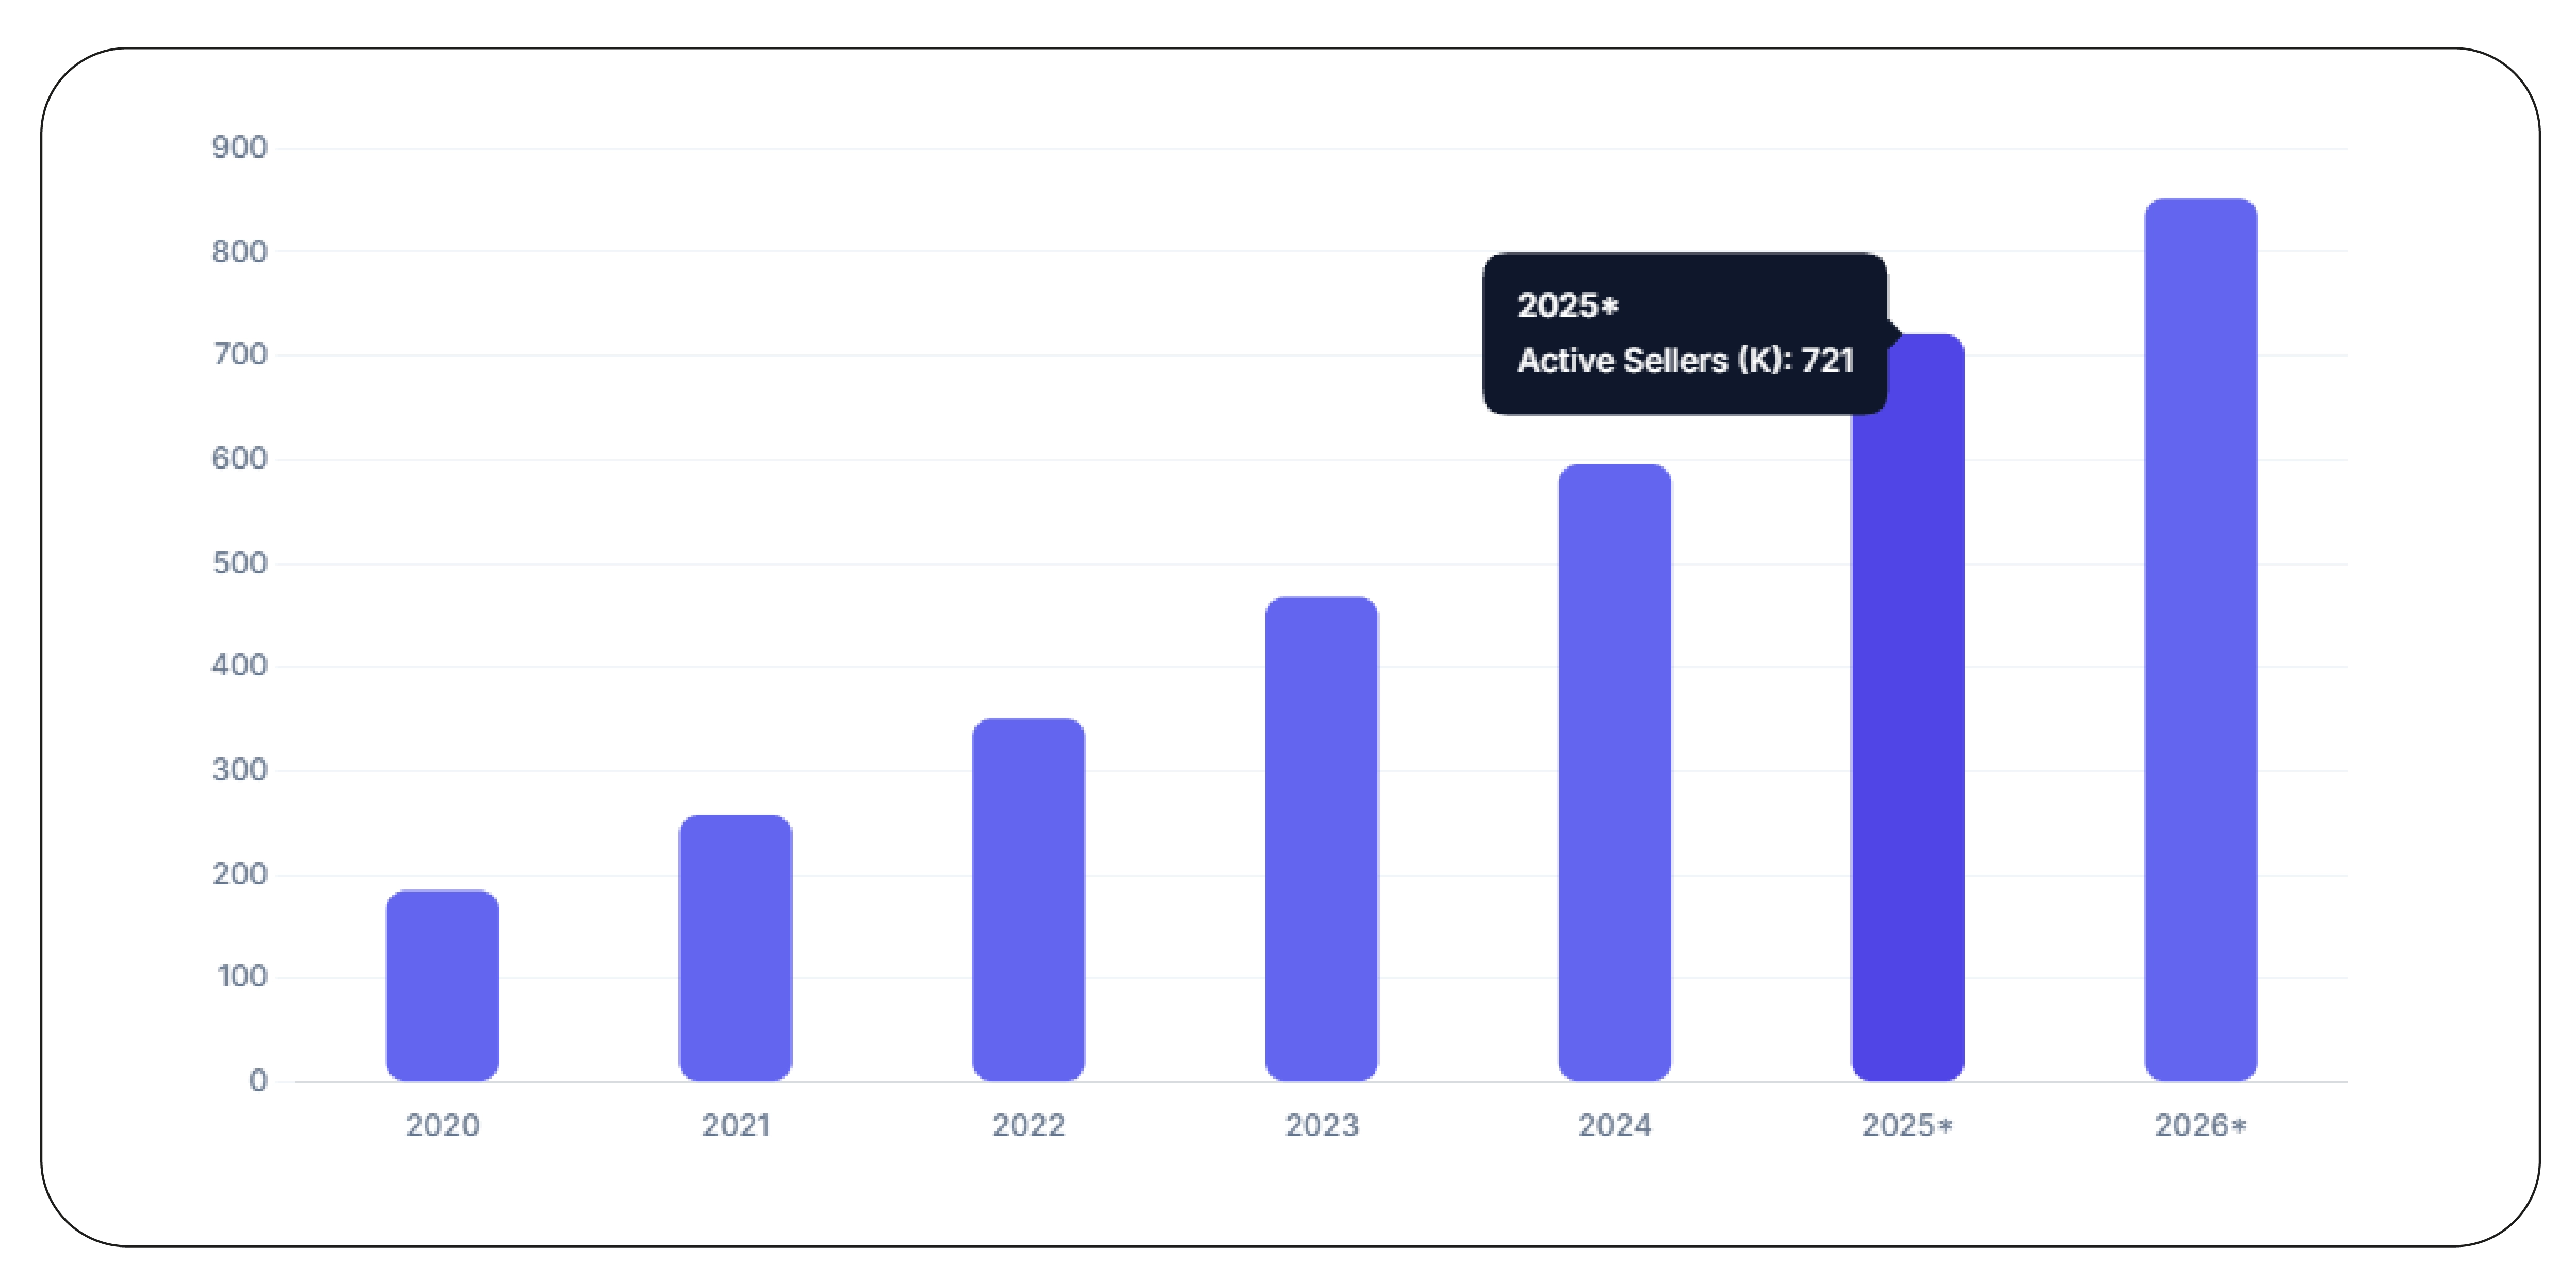
Seller performance directly influences customer trust, product visibility, and marketplace success. High-performing sellers consistently maintain competitive pricing, fast fulfillment, positive customer feedback, and reliable inventory. Monitoring these factors enables businesses to benchmark leading sellers while identifying opportunities for operational improvement.
With Social Commerce Seller Analytics, brands can evaluate seller ratings, order fulfillment efficiency, pricing consistency, customer engagement, repeat purchases, and promotional effectiveness. These analytics help identify top-performing sellers, measure competitive positioning, and understand which selling strategies generate the highest customer satisfaction. Businesses can also monitor seller growth across multiple social commerce platforms and compare performance by category or region.
Continuous seller intelligence improves pricing strategies, enhances marketplace partnerships, and supports better supplier selection. Marketing teams gain visibility into successful promotional tactics, while category managers identify sellers driving category growth. As social commerce competition increases, comprehensive seller analytics become essential for making informed strategic decisions.
Seller Performance Trends (2020–2026)
| Year |
Active Sellers Tracked |
Average Seller Rating |
Repeat Customer Rate |
Marketplace Visibility |
| 2020 |
185K |
4.2 |
34% |
66 |
| 2021 |
258K |
4.3 |
38% |
72 |
| 2022 |
351K |
4.4 |
43% |
78 |
| 2023 |
468K |
4.5 |
48% |
84 |
| 2024 |
596K |
4.6 |
53% |
89 |
| 2025* |
721K |
4.7 |
58% |
94 |
| 2026* |
852K |
4.8 |
63% |
97 |
Business Advantages
- Identify top-performing sellers.
- Compare seller pricing strategies.
- Monitor customer satisfaction.
- Improve supplier benchmarking.
- Strengthen marketplace partnerships.
- Support data-driven growth strategies.
How Can Businesses Unlock Better Marketplace Intelligence?
Social commerce marketplaces generate enormous amounts of product, pricing, and seller data every day. Businesses that collect and analyze this information gain a competitive advantage by understanding customer demand, identifying high-performing products, and monitoring marketplace activity across regions. Automated data extraction enables organizations to replace manual research with real-time intelligence.
Using Social Commerce Seller Data Extraction alongside Temu data, businesses can collect comprehensive information on product listings, seller profiles, prices, discounts, inventory levels, customer reviews, shipping options, and promotional campaigns. These insights help brands evaluate competitor strategies, benchmark top-performing sellers, and identify emerging product categories that attract the highest customer engagement.
Automated seller intelligence also supports product launch planning, pricing optimization, and assortment expansion. Marketing teams can evaluate promotional effectiveness, while merchandising teams monitor product availability and category growth across marketplaces. Historical marketplace data further improves demand forecasting by identifying recurring purchasing trends and seasonal buying behavior. Continuous seller monitoring enables organizations to make proactive decisions that improve profitability and strengthen their marketplace position.
Seller Intelligence Trends (2020–2026)
| Year |
Sellers Monitored |
Products Indexed |
Daily Data Updates |
Data Accuracy |
| 2020 |
240K |
810K |
145K |
89% |
| 2021 |
335K |
1.16M |
214K |
91% |
| 2022 |
458K |
1.61M |
306K |
93% |
| 2023 |
612K |
2.18M |
428K |
95% |
| 2024 |
785K |
2.91M |
565K |
97% |
| 2025* |
948K |
3.68M |
702K |
98% |
| 2026* |
1.14M |
4.45M |
856K |
99% |
*Projected industry estimates.
Business Benefits
- Monitor seller performance continuously.
- Benchmark competitor pricing.
- Analyze inventory movement.
- Improve assortment planning.
- Forecast demand using historical data.
- Identify high-growth product categories.
- Support faster strategic decisions.
- Increase marketplace competitiveness.
Why Is TikTok Shop Becoming a Retail Powerhouse?
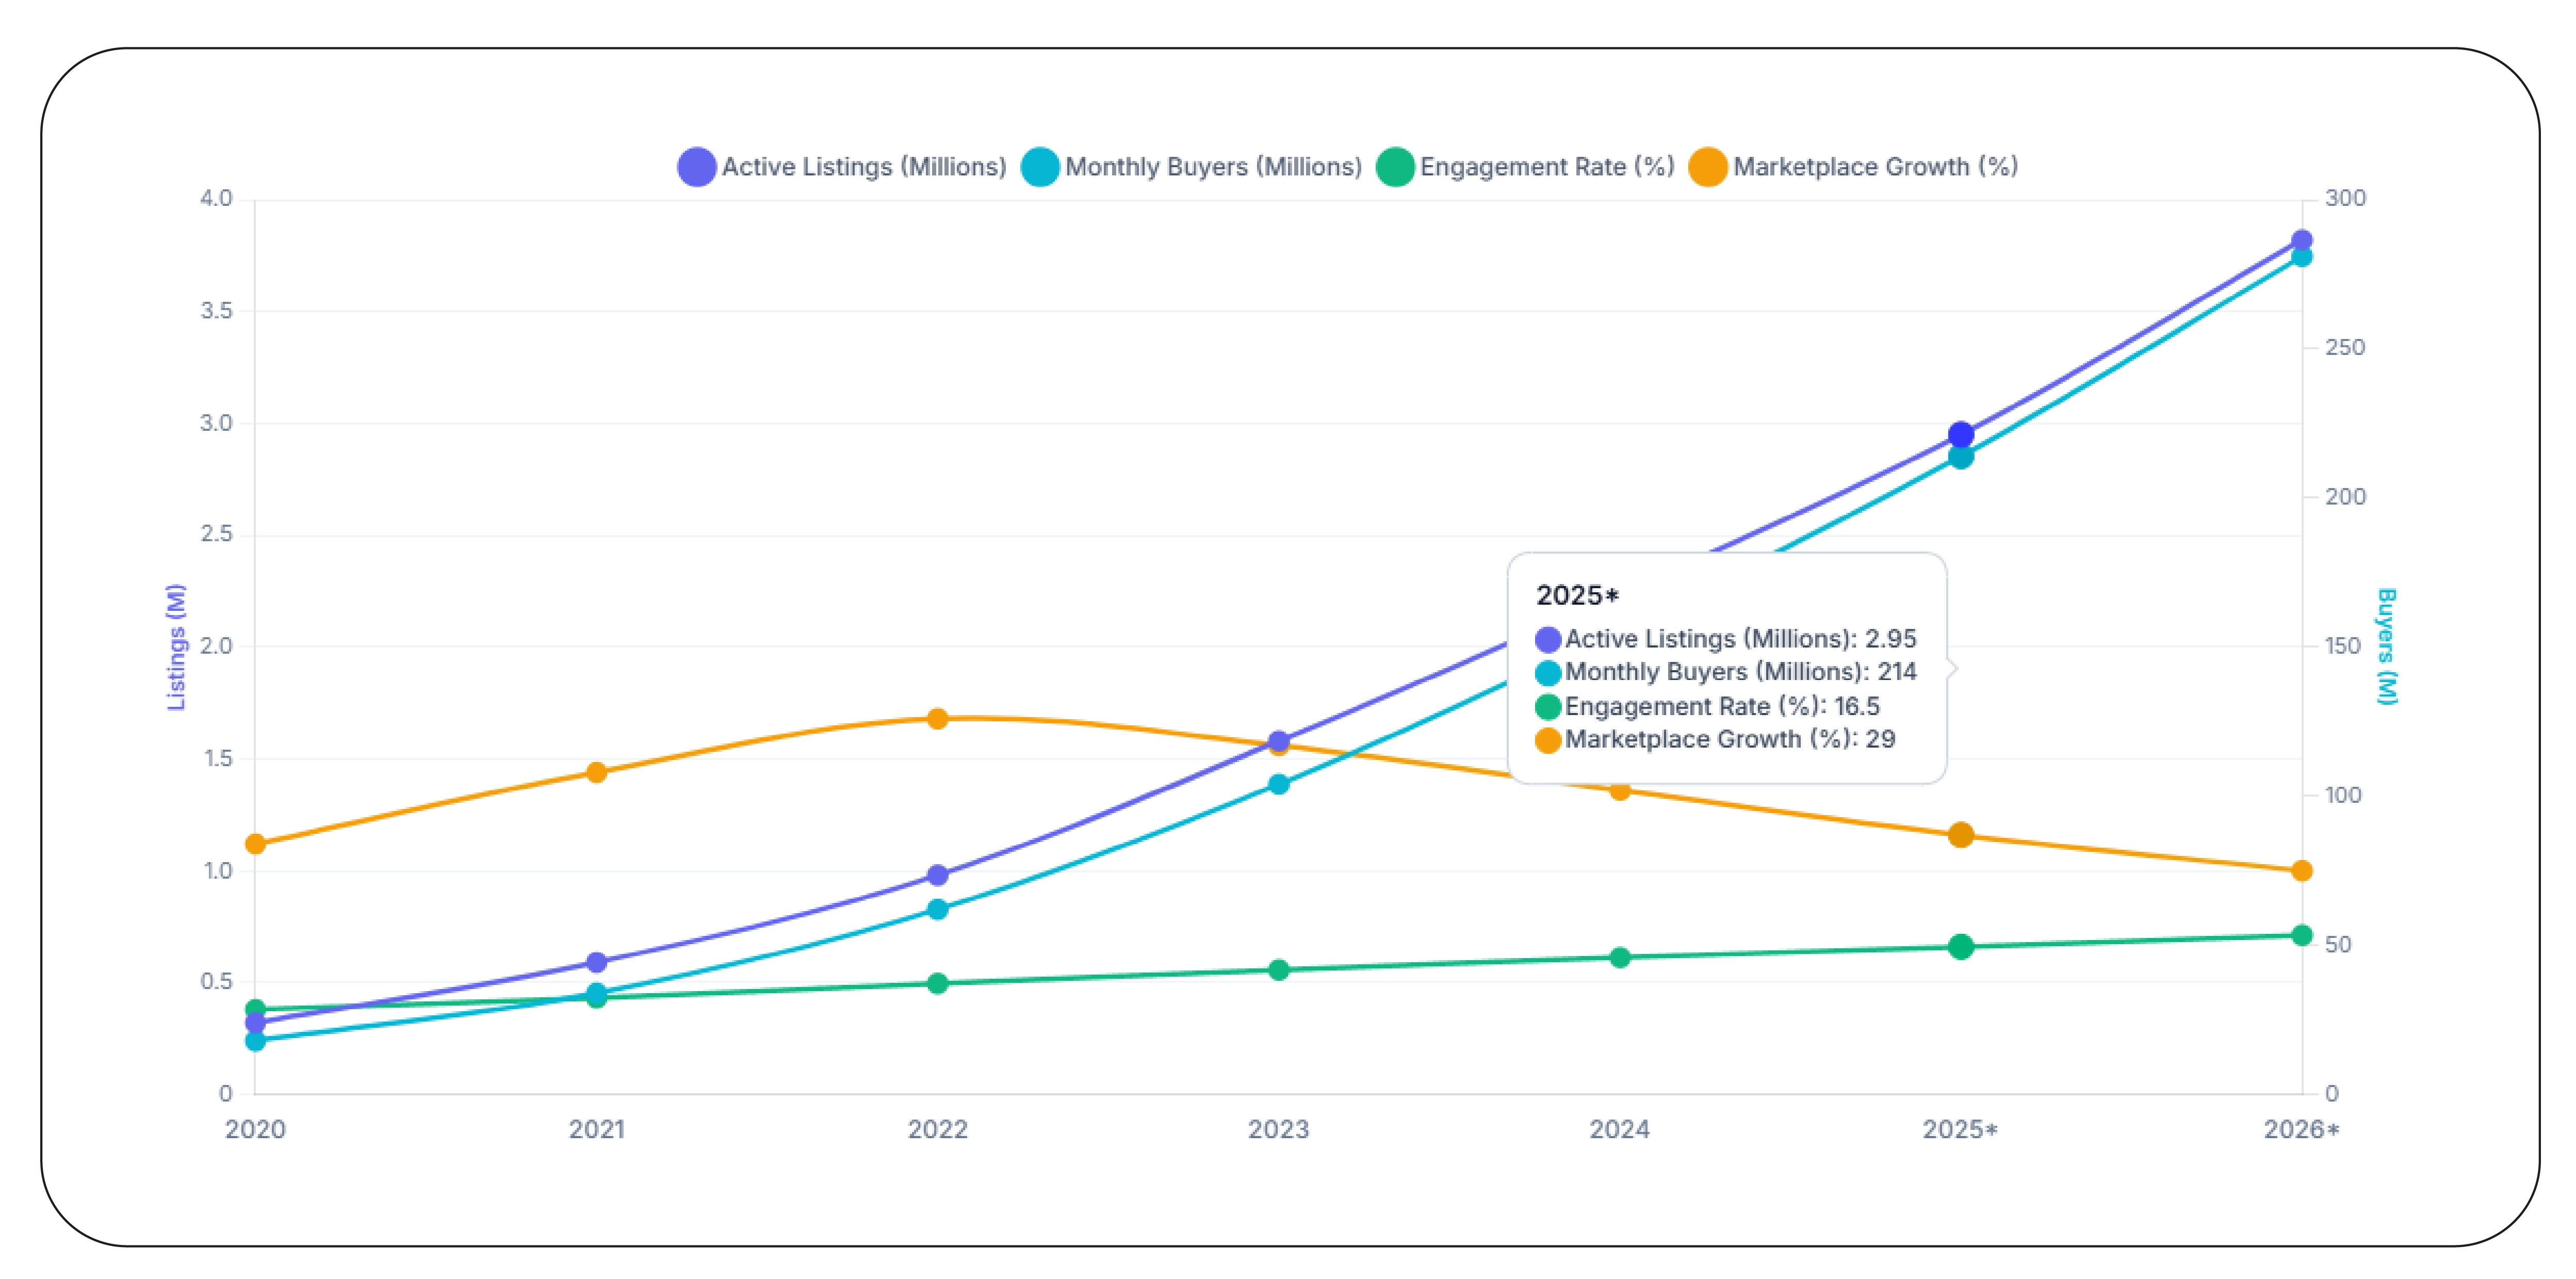
Short-form video has fundamentally changed how consumers discover and purchase products. TikTok Shop combines engaging content with instant purchasing capabilities, creating a highly interactive shopping experience. Viral trends, creator endorsements, and livestream shopping events can generate significant sales within hours, making continuous marketplace monitoring essential.
Leveraging TikTok Shop data scraping enables businesses to track product listings, pricing updates, seller rankings, customer engagement, promotional campaigns, inventory availability, and trending products in real time. Retailers gain visibility into which products achieve viral success, how creator partnerships influence purchasing behavior, and which promotional strategies generate the highest conversion rates.
These insights help businesses optimize marketing investments, improve product launches, and respond quickly to changing consumer preferences. Brands can benchmark competitors, identify emerging categories, and monitor pricing consistency across sellers. Historical trend analysis also supports inventory forecasting by revealing recurring demand patterns tied to seasonal events, shopping festivals, and influencer campaigns.
TikTok Shop Marketplace Trends (2020–2026)
| Year |
Active Product Listings |
Monthly Buyers (Millions) |
Average Engagement Rate |
Marketplace Growth |
| 2020 |
320K |
18 |
9.5% |
28% |
| 2021 |
590K |
34 |
10.8% |
36% |
| 2022 |
980K |
62 |
12.4% |
42% |
| 2023 |
1.58M |
104 |
13.9% |
39% |
| 2024 |
2.24M |
156 |
15.3% |
34% |
| 2025* |
2.95M |
214 |
16.5% |
29% |
| 2026* |
3.82M |
281 |
17.8% |
25% |
*Projected industry estimates.
Key Takeaways
- Viral content accelerates product discovery.
- Livestream shopping drives higher conversion rates.
- Creator influence shapes purchasing decisions.
- Real-time monitoring supports faster pricing adjustments.
- Historical trends improve inventory planning.
- Data-driven insights strengthen marketplace performance.
How Can Marketplace Data Improve Cross-Platform Retail Strategies?
Selling across multiple social commerce platforms requires brands to monitor product listings, pricing, customer engagement, and inventory continuously. Every marketplace has unique consumer behavior, promotional strategies, and seller dynamics. Businesses that compare marketplace performance gain better visibility into product demand and identify opportunities to improve pricing and merchandising decisions.
Using Whatnot marketplace data extraction together with E-commerce data scraping, businesses can collect structured information from livestream marketplaces and online retail platforms. This includes product listings, pricing, discounts, inventory availability, seller rankings, customer reviews, transaction trends, and promotional campaigns. By combining these datasets, organizations create a unified view of marketplace performance across multiple channels.
Cross-platform intelligence helps brands identify best-selling products, compare marketplace pricing, monitor promotional effectiveness, and optimize inventory allocation. Marketing teams can evaluate which platforms generate the highest engagement, while category managers benchmark assortment performance across regions. Automated data collection reduces manual effort, improves reporting accuracy, and enables businesses to make faster strategic decisions in an increasingly competitive digital commerce environment.
Cross-Platform Marketplace Trends (2020–2026)
| Year |
Marketplaces Monitored |
Products Tracked |
Daily Listing Updates |
Data Accuracy |
| 2020 |
12 |
680K |
120K |
89% |
| 2021 |
18 |
960K |
185K |
91% |
| 2022 |
25 |
1.42M |
276K |
93% |
| 2023 |
33 |
2.05M |
398K |
95% |
| 2024 |
42 |
2.83M |
548K |
97% |
| 2025* |
51 |
3.67M |
695K |
98% |
| 2026* |
60 |
4.61M |
864K |
99% |
*Projected industry estimates.
Business Advantages
- Compare multiple marketplaces simultaneously.
- Track product performance across channels.
- Monitor seller competition.
- Improve pricing consistency.
- Optimize inventory allocation.
- Benchmark promotional campaigns.
- Enhance customer experience.
- Support faster business decisions.
Why Is Facebook Marketplace Still Important for Retail Intelligence?
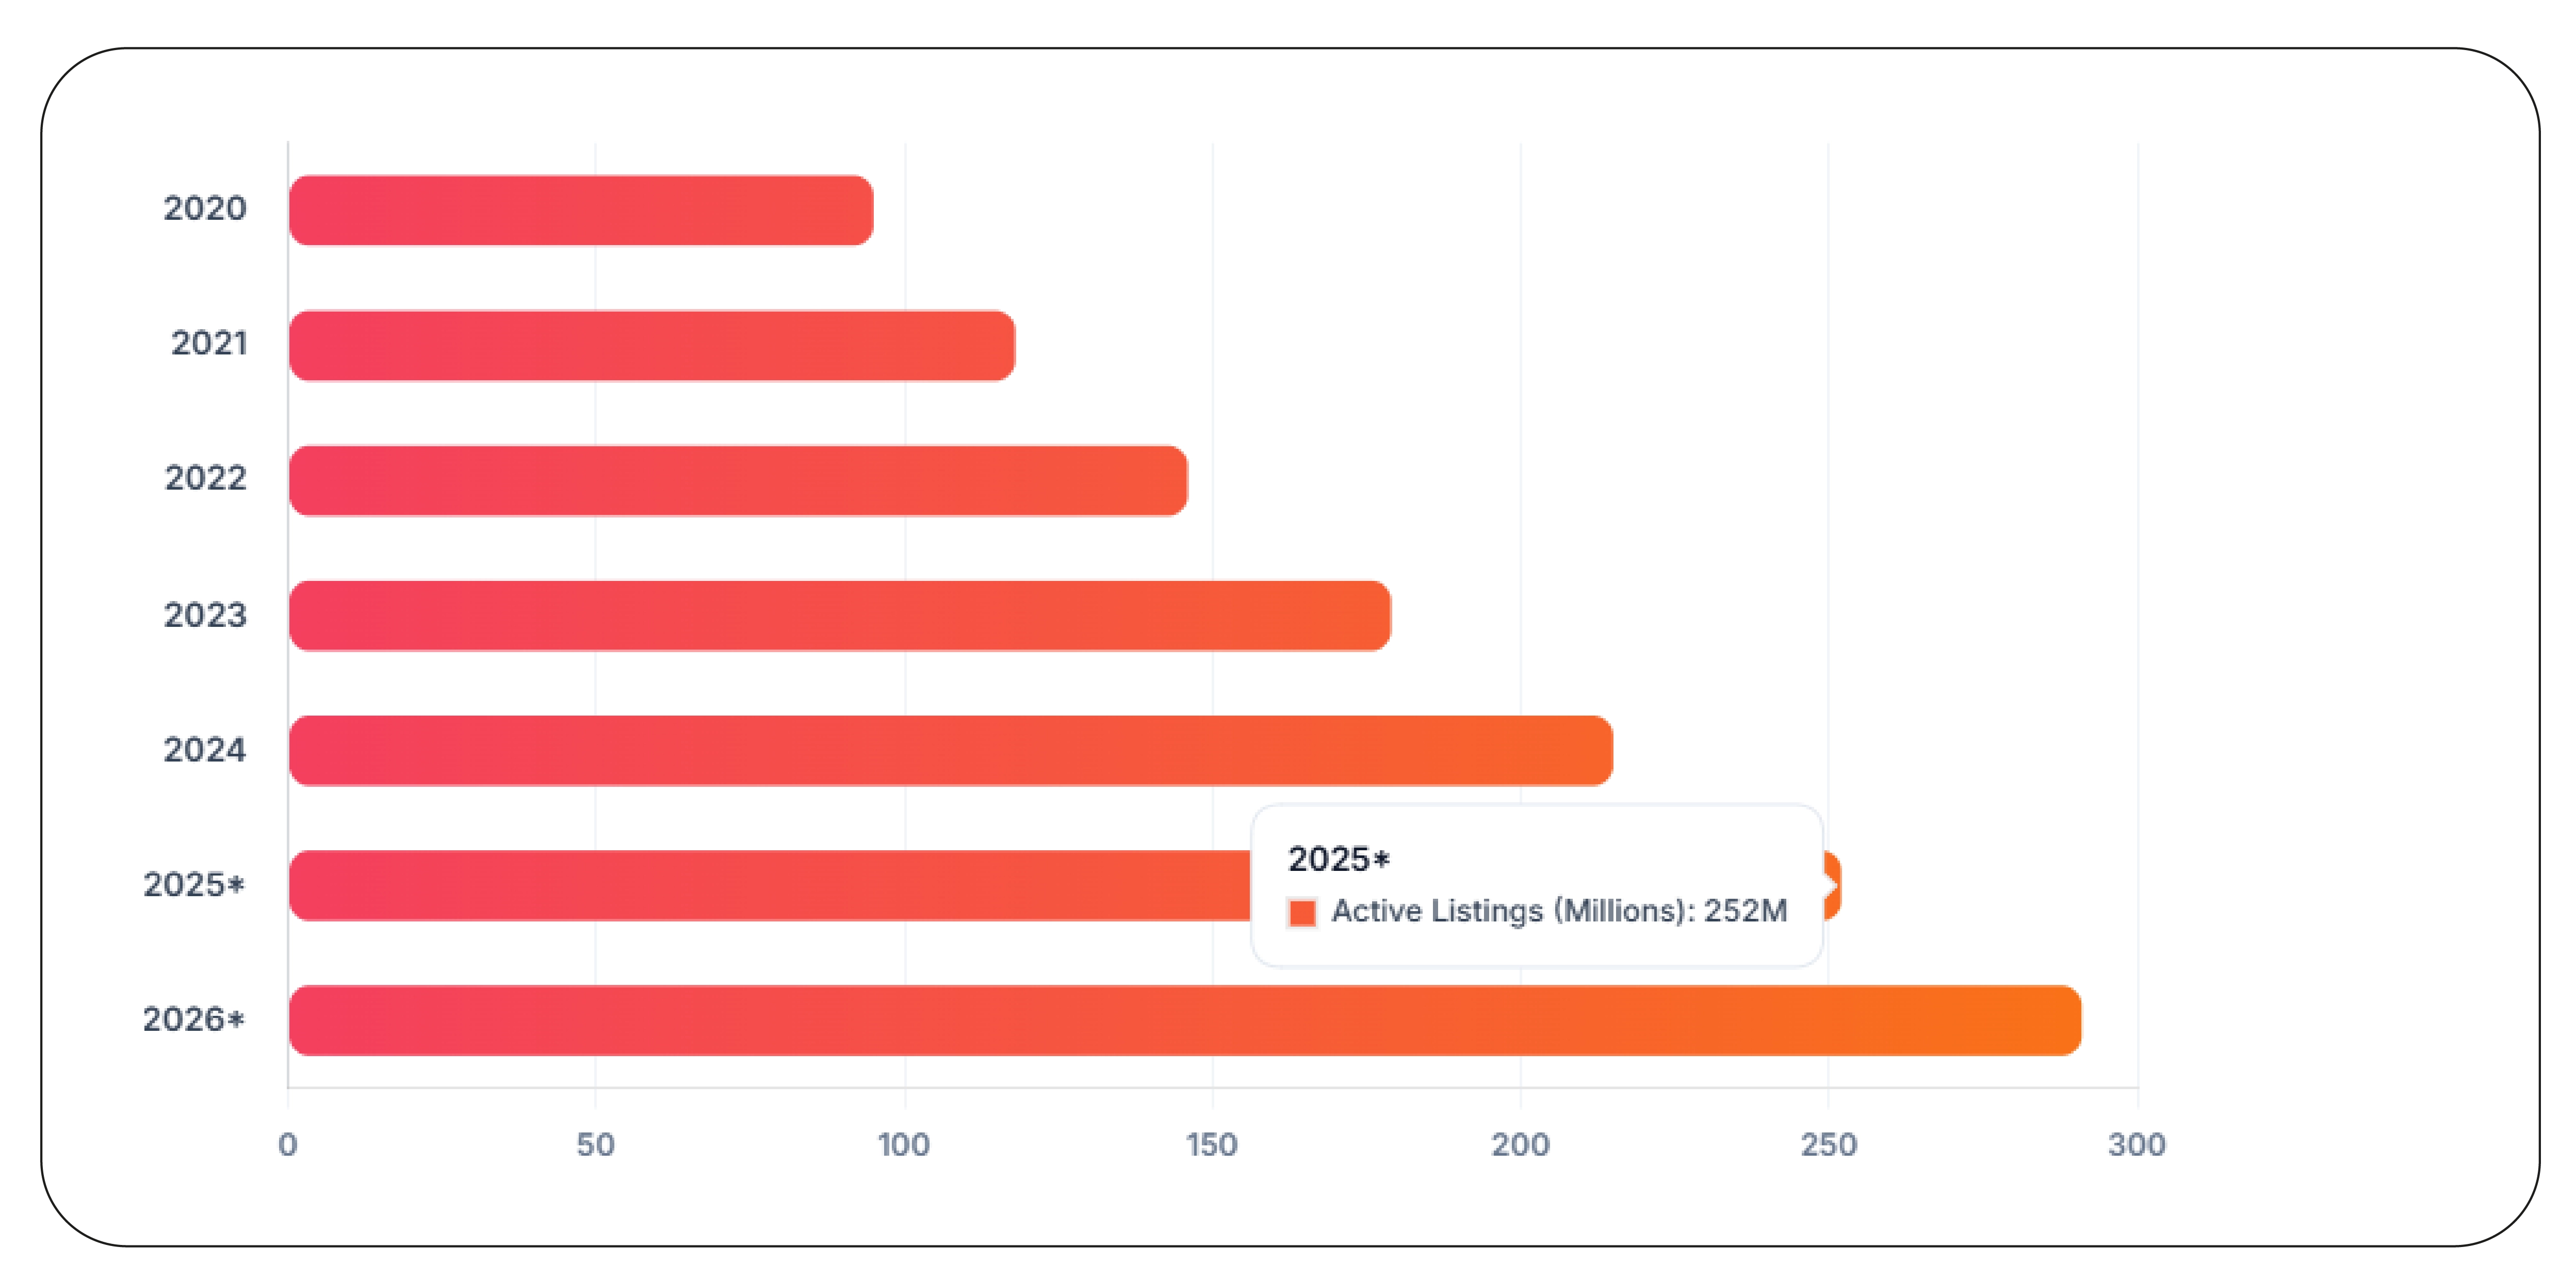
Facebook Marketplace remains one of the world's largest peer-to-peer and business selling platforms. Millions of buyers browse products daily across categories such as electronics, home goods, fashion, furniture, vehicles, and consumer products. Its extensive reach makes it a valuable source of marketplace intelligence for brands, retailers, and market researchers.
Leveraging Facebook Marketplace data scraping enables businesses to monitor product listings, pricing trends, seller activity, inventory availability, customer engagement, and regional demand patterns. Continuous data collection helps organizations understand local buying behavior, identify high-performing product categories, and benchmark competitor pricing across different geographic markets.
Marketplace intelligence also improves forecasting and merchandising decisions. Businesses can detect emerging demand trends, evaluate pricing fluctuations, monitor listing frequency, and analyze seasonal purchasing behavior. Marketing teams benefit from localized insights, while pricing analysts identify opportunities to strengthen competitiveness. Automated monitoring provides accurate and timely data that supports strategic planning across multiple retail categories.
Facebook Marketplace Growth Trends (2020–2026)
| Year |
Active Listings (Millions) |
Monthly Buyers (Millions) |
Average Seller Growth |
Consumer Engagement |
| 2020 |
95 |
420 |
16% |
67% |
| 2021 |
118 |
465 |
19% |
71% |
| 2022 |
146 |
518 |
22% |
75% |
| 2023 |
179 |
579 |
25% |
80% |
| 2024 |
215 |
638 |
28% |
84% |
| 2025* |
252 |
702 |
30% |
88% |
| 2026* |
291 |
770 |
33% |
91% |
*Projected industry estimates.
Key Insights
- Monitor regional pricing trends.
- Identify high-demand product categories.
- Benchmark local competitors.
- Track inventory and listing growth.
- Analyze customer engagement.
- Improve forecasting accuracy.
- Support localized marketing strategies.
- Strengthen marketplace competitiveness.
Why Choose Product Data Scrape?
Modern businesses need accurate marketplace intelligence to stay ahead in the rapidly evolving social commerce landscape. Product Data Scrape provides scalable solutions for collecting and analyzing Social commerce data across leading platforms worldwide. Our advanced Scrape Social Commerce Data capabilities deliver real-time insights into product listings, pricing, seller performance, customer engagement, inventory availability, and promotional activities. With automated data collection, customized reporting, and actionable analytics, businesses can optimize pricing strategies, monitor competitors, improve product visibility, forecast demand, and make smarter decisions that accelerate growth across today's dynamic social commerce ecosystem.
Conclusion
Social commerce continues reshaping online retail by combining content, community, and instant purchasing experiences. Leveraging TikTok Shop data together with Scrape Social Commerce Data enables businesses to monitor marketplace trends, optimize pricing, improve inventory planning, and strengthen customer engagement across multiple social platforms. Organizations adopting real-time marketplace intelligence gain faster decision-making, stronger competitive positioning, and sustainable business growth.
Ready to transform your social commerce strategy? Partner with Product Data Scrape today to unlock real-time marketplace intelligence, optimize digital commerce performance, and stay ahead with accurate, data-driven insights!
FAQs
1. What is social commerce data scraping?
Social commerce data scraping collects product listings, prices, seller information, customer engagement, reviews, inventory, and promotional data from social shopping platforms for business intelligence and competitive analysis.
2. Which businesses benefit from social commerce analytics?
Brands, retailers, manufacturers, distributors, agencies, and market research firms benefit by monitoring product trends, pricing strategies, seller performance, customer behavior, and marketplace competition across social commerce platforms.
3. How often should social commerce data be updated?
Businesses should update marketplace data several times daily to capture product launches, pricing changes, inventory updates, promotions, and customer engagement trends as they happen.
4. Can social commerce data improve demand forecasting?
Yes. Historical and real-time marketplace insights help businesses identify seasonal buying patterns, trending products, pricing movements, and customer preferences, improving forecasting accuracy and inventory planning.
5. How does Product Data Scrape support social commerce intelligence?
Product Data Scrape delivers automated marketplace data extraction, real-time monitoring, competitive benchmarking, customized analytics, and scalable reporting that help businesses make faster, data-driven decisions across social commerce platforms.


 Singapore
 EMAIL
EMAIL
 PHONE
PHONE


.webp)
.webp "thumb")
.webp "thumb")













.webp)






