Introduction
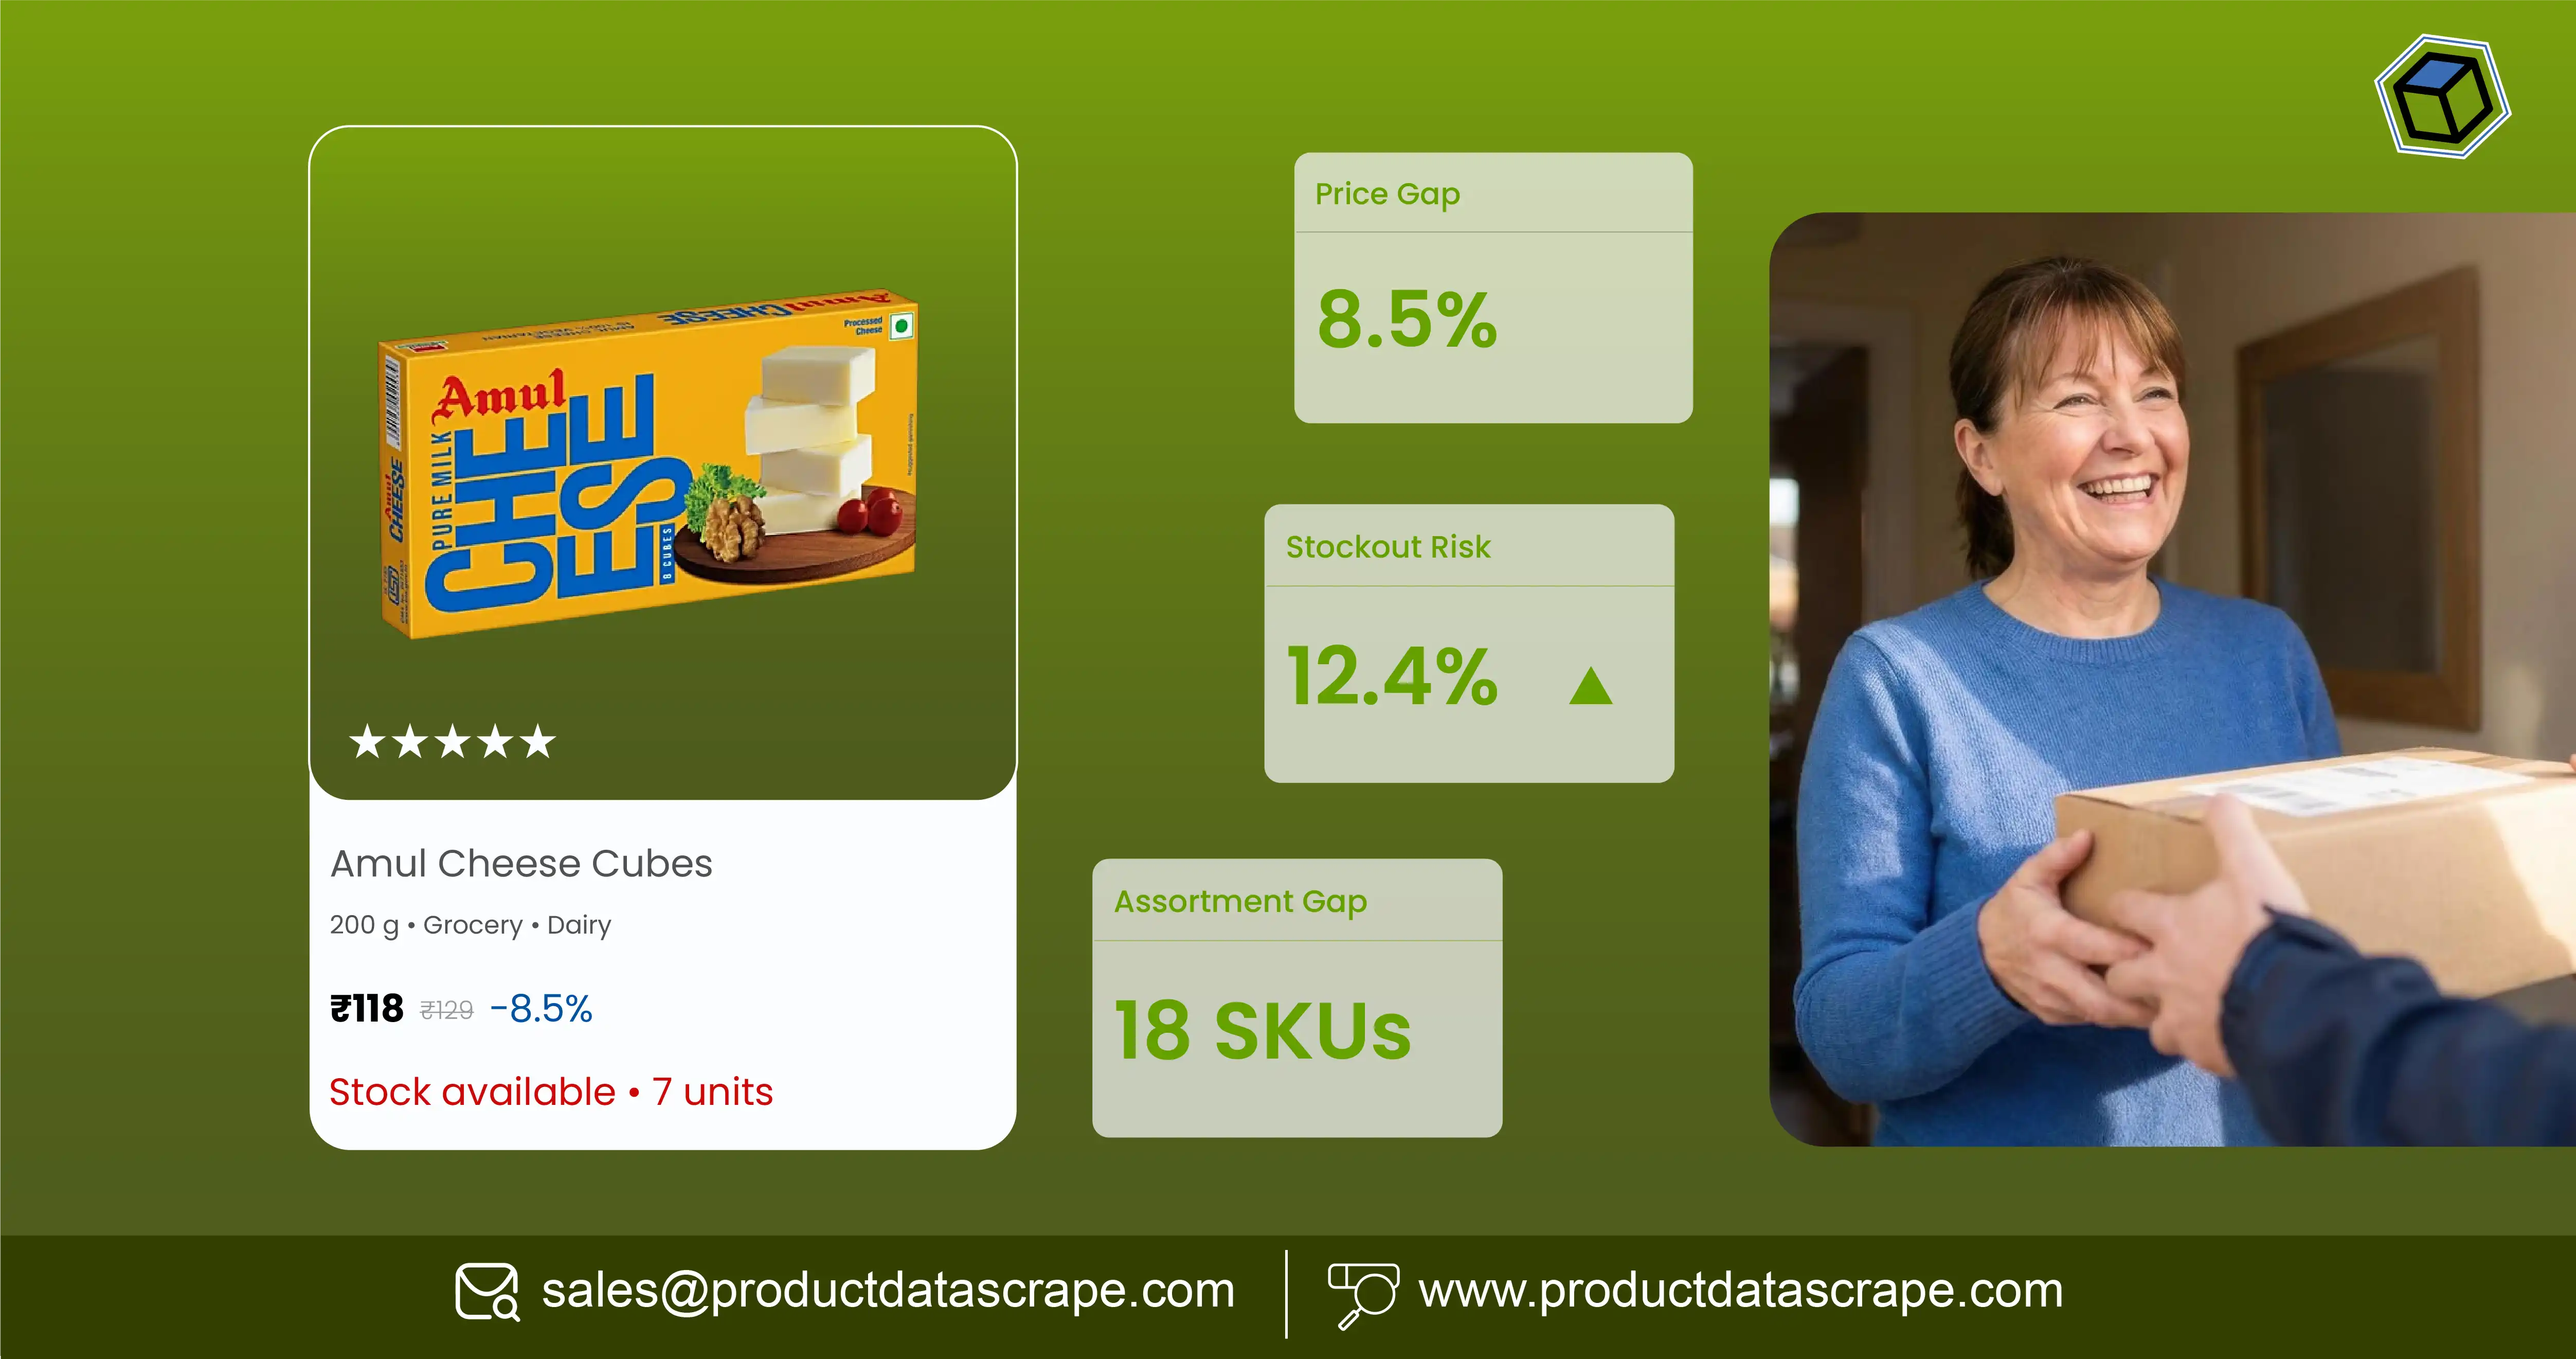
Retailers can solve pricing, stock, and assortment challenges by continuously monitoring SKU-level prices, availability, promotions, and competitor catalogues across quick-commerce platforms. Quick Commerce Data Scraping in India converts fast-changing marketplace information into structured intelligence for pricing, inventory, and category teams.
India's quick-commerce market has moved from a pandemic-era convenience service into a major retail channel. Current estimates vary by methodology, but Statista projects India's quick-commerce revenue at US$5.58 billion in 2026, while Mordor Intelligence estimates the 2026 market at US$3.65 billion. Mordor also reports that grocery and staples represented 61.33% of the category in 2025.
The difference between these estimates reflects varying definitions and measurement methods, but both indicate substantial market activity.
For retailers and FMCG brands, the operational problem is more specific: prices change, promotions disappear, SKUs go out of stock, and competitor assortments evolve quickly. A monthly spreadsheet cannot reliably capture these movements.
A structured Scrape Real-Time Quick Commerce Data strategy can capture product names, brands, prices, MRP, discounts, pack sizes, stock status, ratings, sellers, categories, locations, and timestamps. These observations can then be transformed into dashboards and analytical datasets.
| Year |
Market development |
Retail implication |
| 2020 |
Pandemic accelerates online grocery adoption |
Digital grocery becomes strategically important |
| 2021 |
Quick-commerce models expand |
Delivery speed becomes a differentiator |
| 2022 |
Rapid dark-store expansion |
Local assortment becomes more important |
| 2023 |
Competitive intensity increases |
Pricing and promotions require closer monitoring |
| 2024 |
Broader category adoption |
Non-grocery categories gain relevance |
| 2025 |
Scale and profitability become priorities |
Store productivity and assortment matter |
| 2026 |
Market enters more disciplined expansion |
Data-driven optimization becomes critical |
A 2026 market study estimates that the Indian quick-commerce sector reached US$3.65 billion and could reach US$6.64 billion by 2031 at a 12.74% CAGR.
For retailers, the question is no longer whether quick-commerce data matters. The question is how to use it to identify actionable pricing, stock, and assortment opportunities.
How Can Retailers Compare Grocery Assortments Across Leading Platforms?
Retailers need visibility into what competitors sell, how products are positioned, and which SKUs are consistently available. Grocery Product Data Across Blinkit Zepto Instamart can help category managers build comparable catalogues across major quick-commerce platforms.
The objective is not simply to count products. Retailers should map products by brand, category, pack size, variant, price, promotion, and availability. This reveals assortment overlaps and gaps.
For example, if a competing platform carries 20 variants within a beverage category while another carries 12, the difference can indicate an assortment opportunity. However, the comparison should account for location because quick-commerce catalogues can differ by serviceable area.
| Comparison metric |
Retail question |
| SKU count |
How broad is the assortment? |
| Brand count |
Which brands receive visibility? |
| Price range |
What are entry and premium price points? |
| Pack sizes |
Which consumer needs are covered? |
| Availability |
Which products are consistently in stock? |
| Promotions |
Which SKUs receive discounts? |
| New listings |
Which products are entering the market? |
The scale of the channel makes manual comparison difficult. A 2026 public mapping project identified 5,625 dark stores across 408 Indian cities and 26 states, although its figures represent publicly observable locations rather than an official industry census.
This geographic expansion increases the value of location-aware data. A retailer can identify whether a competitor's assortment is broader nationally or only in selected cities.
For category managers, the most useful output is an assortment-gap matrix showing products sold by competitors but absent from their own catalogue. The same dataset can identify duplicate products, discontinued SKUs, premiumization opportunities, and emerging categories.
How Does Continuous Data Collection Improve Pricing Decisions?
Pricing teams need current competitor information because quick-commerce platforms can change displayed prices and promotions frequently. Real-Time Quick Commerce Data Extraction creates a recurring stream of observations that can reveal these changes instead of relying on occasional manual checks.
The process should capture a product's current price alongside its previous observations. This makes it possible to calculate price movement, discount depth, price volatility, and competitor price gaps.
| Pricing indicator |
What it reveals |
| Current selling price |
Latest consumer-facing price |
| Previous price |
Direction of movement |
| MRP |
Discount positioning |
| Discount percentage |
Promotional intensity |
| Unit price |
Normalized comparison |
| Competitor price gap |
Relative positioning |
| Price frequency |
Stability or volatility |
For instance, a retailer could monitor 5,000 SKUs daily and flag products where competitor prices fall by more than a predefined threshold. Category teams can then investigate whether the change is promotional, permanent, or location-specific.
Market growth makes such monitoring increasingly relevant. PayNXT360 estimated that India's quick-commerce market grew at a 71.2% CAGR between 2020 and 2024 and projected continued growth from 2025 through 2029.
The data also supports promotional analysis. A 30% discount displayed on one day may not represent a permanent pricing change. Historical observations help determine whether the discount is part of a recurring promotion.
For FMCG brands, this intelligence can reveal whether retailers are maintaining recommended prices or discounting aggressively. For marketplaces, it can identify categories where price competition is intensifying.
The key is frequency. Real-time does not necessarily mean collecting every second. It means collecting often enough for the business problem, preserving timestamps, and making changes visible before they become commercially significant.
What Can SKU-Level Monitoring Reveal About Stock and Demand?
A product can have a competitive price and still lose sales if it is unavailable. Quick Commerce SKU-Level Data Tracking allows retailers to monitor whether individual products remain visible, purchasable, and consistently stocked across selected markets.
Stock monitoring becomes more useful when it is combined with pricing and assortment information. If a competitor repeatedly runs out of a high-demand SKU, a retailer may have an opportunity to increase availability or promote an alternative.
| SKU signal |
Potential action |
| In stock consistently |
Maintain replenishment |
| Repeated stockouts |
Investigate demand or supply |
| Price increase + stockout |
Possible supply pressure |
| Discount + rapid disappearance |
Monitor promotion impact |
| New SKU |
Track adoption |
| Discontinued listing |
Review assortment strategy |
| Regional stockout |
Adjust local inventory |
The expansion of dark-store infrastructure demonstrates why SKU-level monitoring must account for geography. Bernstein data reported by Moneycontrol in 2026 indicated that Blinkit had more than 2,222 dark stores across 243 cities, while Zepto had around 1,255 across 61 cities and Instamart roughly 1,181 across 128 cities.
These figures are not directly comparable with every market dataset because company definitions and reporting periods can differ. Still, they demonstrate the scale and geographic complexity of the channel.
Retailers can convert availability observations into an availability rate: the percentage of monitored checks during which a SKU is purchasable. They can also calculate competitor stockout frequency by city or category.
This helps answer practical questions: Which products are frequently unavailable? Which locations have the weakest availability? Are stockouts associated with promotions? Which competing SKUs could substitute for unavailable products?
Such analysis connects digital shelf visibility with inventory planning.
How Can Zepto Data Help Retailers Benchmark Prices and Products?
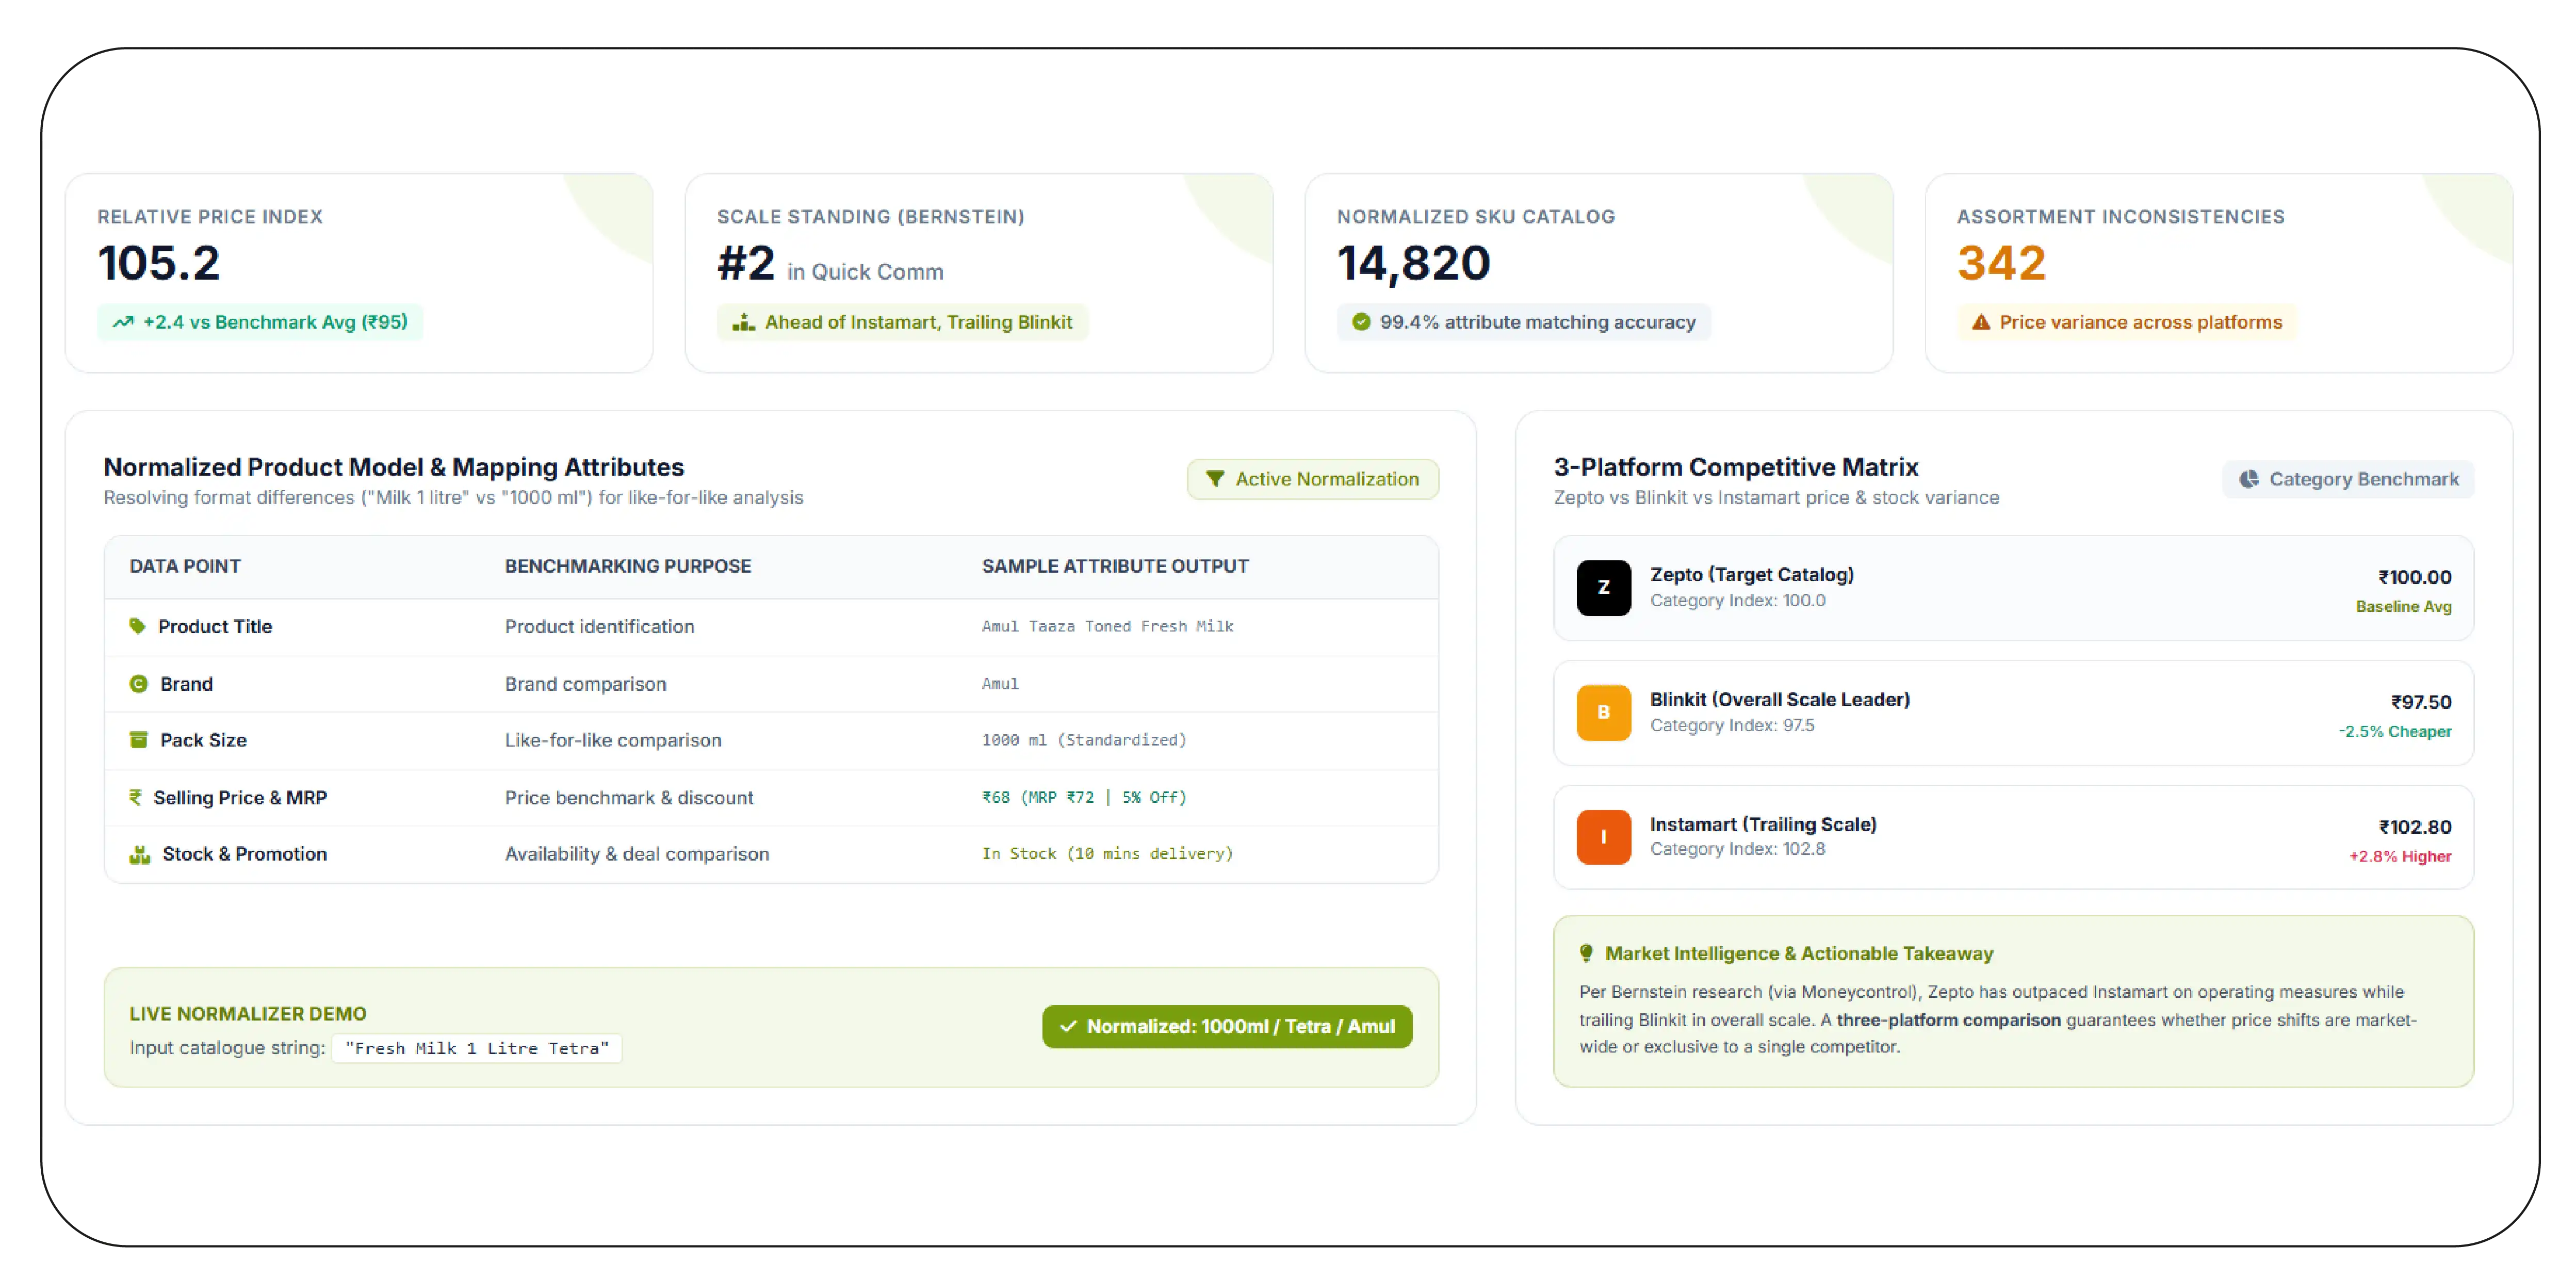
Competitor benchmarking becomes more actionable when products are compared using identical attributes. Zepto Scraping Product and Pricing Data can support analysis of product names, brands, variants, pack sizes, prices, discounts, availability, and other publicly visible attributes.
The biggest challenge is product matching. "Milk 1 litre," "Milk 1000 ml," and different pack descriptions may refer to comparable products but appear differently in catalogues. A normalized product model should therefore combine brand, product type, size, variant, and other identifying attributes.
| Data point |
Benchmarking purpose |
| Product title |
Product identification |
| Brand |
Brand comparison |
| Pack size |
Like-for-like comparison |
| Selling price |
Price benchmark |
| MRP |
Discount calculation |
| Stock status |
Availability benchmark |
| Promotion |
Deal comparison |
| Category |
Category-level analysis |
Retailers can then create price-index calculations. If their average comparable price is ₹100 and the benchmark competitor average is ₹95, the relative price index is 105.2. Such a metric makes large SKU datasets easier for executives to interpret.
The competitive environment is intense. Moneycontrol's reporting on Bernstein research indicates that Zepto has moved ahead of Instamart on several operating measures while remaining behind Blinkit on overall scale.
This means retailers should not benchmark against only one platform. A three-platform comparison can identify whether a price movement is market-wide or specific to one competitor.
The same dataset can support assortment analysis. If a brand's products appear across multiple platforms but at different prices or stock levels, the retailer can identify inconsistencies and prioritize investigation.
For pricing teams, the strongest benchmark is therefore SKU-specific, location-aware, and time-stamped rather than a simple platform-wide average.
How Can Retailers Monitor Competitive Prices, Stock, and Assortment?
Retailers require a unified view because price, stock, and assortment are interconnected. Blinkit Price and Stock Monitoring can reveal whether competitors are changing prices while simultaneously experiencing stock movements. Assortment and availability monitoring adds another layer by showing which products are present and purchasable.
Consider a simple scenario: a competitor reduces the price of a popular snack by 15%, but the SKU becomes unavailable shortly afterward. A price-only dashboard may classify the event as aggressive competition. A combined dashboard could reveal that the promotion was temporary or inventory-constrained.
| Combined signal |
Possible interpretation |
| Price ↓ + availability stable |
Active price competition |
| Price ↓ + availability ↓ |
Promotion or demand surge |
| Price ↑ + availability ↓ |
Potential supply pressure |
| New SKU + frequent availability |
Successful assortment addition |
| New SKU + persistent stockout |
Strong demand or supply constraint |
| SKU disappears |
Delisting or assortment change |
Quick-commerce operators are also operating increasingly large networks. A Q4 FY26 dataset compiled from company disclosures and research estimated 2,243 active Blinkit stores, 1,143 Instamart stores, and 1,139 Zepto stores at quarter-end.
The exact figures should be treated as period-specific because dark-store counts change continuously.
For retailers, this reinforces the importance of location-level monitoring. A product may be available in one city and unavailable in another. Likewise, a promotion may exist in one catchment but not another.
A unified monitoring framework should therefore track SKU, retailer, location, price, discount, availability, timestamp, and category together. This gives category managers the context required to distinguish genuine competitive threats from temporary marketplace fluctuations.
What Can Indian Quick-Commerce Data Reveal About Retail Competition?
India's quick-commerce ecosystem is becoming larger, more geographically distributed, and more competitive. Blinkit data scraping can help retailers understand one major competitor's product, pricing, and availability movements, while Quick Commerce Data Scraping in India can provide a broader cross-platform view.
The business case extends beyond grocery. Current market research identifies grocery and staples as the largest quick-commerce product category, while electronics and accessories are among the faster-growing areas. Mordor Intelligence estimates that grocery and staples held 61.33% of the market in 2025.
| Year |
Key market signal |
Data priority |
| 2020 |
Online grocery adoption accelerates |
Product discovery |
| 2021 |
Quick delivery models expand |
Price and assortment |
| 2022 |
Competition intensifies |
SKU and promotion tracking |
| 2023 |
More categories enter quick commerce |
Category intelligence |
| 2024 |
Platforms scale infrastructure |
Location monitoring |
| 2025 |
Profitability and density become important |
Store-level benchmarking |
| 2026 |
Market continues disciplined expansion |
Automated competitive intelligence |
Statista projects India's quick-commerce revenue at US$5.58 billion in 2026, while Mordor Intelligence projects US$3.65 billion using a different market methodology. These differences highlight why businesses should define their own measurement framework rather than relying on a single market-size number.
For retailers, the actionable dataset is ultimately more important than the headline valuation. Monitoring can reveal competitor assortment gaps, pricing opportunities, recurring stockouts, regional differences, promotional intensity, and newly introduced products.
The best approach is to create a normalized historical dataset rather than isolated snapshots. Once historical observations accumulate, teams can calculate trends and identify recurring competitive patterns.
Why Should Retailers Choose Product Data Scrape?
Retailers need structured data that can support decisions across pricing, inventory, merchandising, and competitive strategy. Product Data Scrape provides a practical framework for transforming publicly available marketplace information into organized datasets.
The approach can capture product attributes, prices, promotions, availability, categories, and timestamps across selected platforms and locations. This makes it easier for teams to compare thousands of SKUs without depending entirely on manual research.
For category managers, the benefit is clearer assortment visibility. For pricing teams, it is competitive benchmarking. For inventory teams, it is availability intelligence. For strategy teams, it is historical market evidence.
Zepto price monitoring can be incorporated into broader competitor benchmarking alongside other quick-commerce platforms, helping businesses understand not only what competitors charge but also how their prices and availability change over time.
The result is a repeatable data foundation for faster, more evidence-based retail decisions.
Conclusion
The fastest way to solve quick-commerce pricing, stock, and assortment challenges is to replace periodic manual checks with structured, time-stamped marketplace intelligence. Global quick commerce data provides broader context, but India-specific SKU, location, price, and availability observations are what enable practical retail decisions.
India's quick-commerce market is projected to continue expanding through the end of the decade, although market estimates differ depending on methodology.
Quick Commerce Data Scraping in India enables retailers to benchmark competitors, identify assortment gaps, detect stockouts, monitor promotions, and understand local pricing movements.
Partner with Product Data Scrape to build a structured quick-commerce intelligence pipeline and turn changing marketplace data into smarter pricing, stock, and assortment decisions!
FAQs
1. What is quick-commerce data scraping?
Quick-commerce data scraping collects publicly visible product, pricing, promotion, availability, and assortment information from relevant platforms for structured competitive and market analysis.
2. Why should retailers monitor quick-commerce prices?
Retailers can identify competitor price changes, promotion patterns, pricing gaps, and category movements, enabling faster responses to market conditions and improving pricing decisions.
3. Can quick-commerce data help with stock monitoring?
Yes. Historical availability observations can identify recurring stockouts, regional availability gaps, promotional stock depletion, and products that require closer inventory attention.
4. How does Product Data Scrape support quick-commerce analysis?
Product Data Scrape helps organize marketplace observations into structured datasets that businesses can use for SKU benchmarking, assortment analysis, pricing intelligence, and availability monitoring.
5. Which quick-commerce platforms can businesses compare?
Businesses can compare relevant platforms such as Blinkit, Zepto, and Swiggy Instamart, depending on their target markets, categories, monitoring requirements, and data coverage.


 Singapore
 EMAIL
EMAIL
 PHONE
PHONE



.webp "thumb")













.webp)






