Introduction
India Spices and Pulses launch Market Research helps FMCG brands, food manufacturers, retailers, and marketplace sellers evaluate demand, pricing, product assortment, regional preferences, and competitor activity before launching products. Businesses can use structured marketplace data from Amazon, Flipkart, and quick-commerce channels to reduce launch uncertainty and make better decisions.
Industry data point: India's food and grocery sector continues to shift toward organized retail, e-commerce, and quick commerce. For brands, this creates more digital product signals but also increases the need for frequent pricing and assortment monitoring.
The core challenge is simple. Brands need to know what consumers want before investing in a new product. They also need to understand what competitors already sell, how products are priced, which pack sizes dominate, and where assortment gaps exist.
This guide targets FMCG brands, spice manufacturers, pulse processors, D2C food companies, category managers, marketplace sellers, and market research teams.
What Can Brands Learn Before a Product Launch?
Businesses can examine:
- Product and brand presence.
- Price ranges.
- Pack sizes.
- Ratings and reviews.
- Category depth.
- Regional demand signals.
- Promotional activity.
- Availability patterns.
- Quick-commerce assortment.
- Competitor positioning.
A structured approach helps brands Estimate your sales performance before committing significant launch budgets. It does not guarantee sales. Instead, it creates a stronger evidence base for forecasting, pricing, assortment, and positioning decisions.
How Can FMCG Brands Understand the Indian Pulses Opportunity?
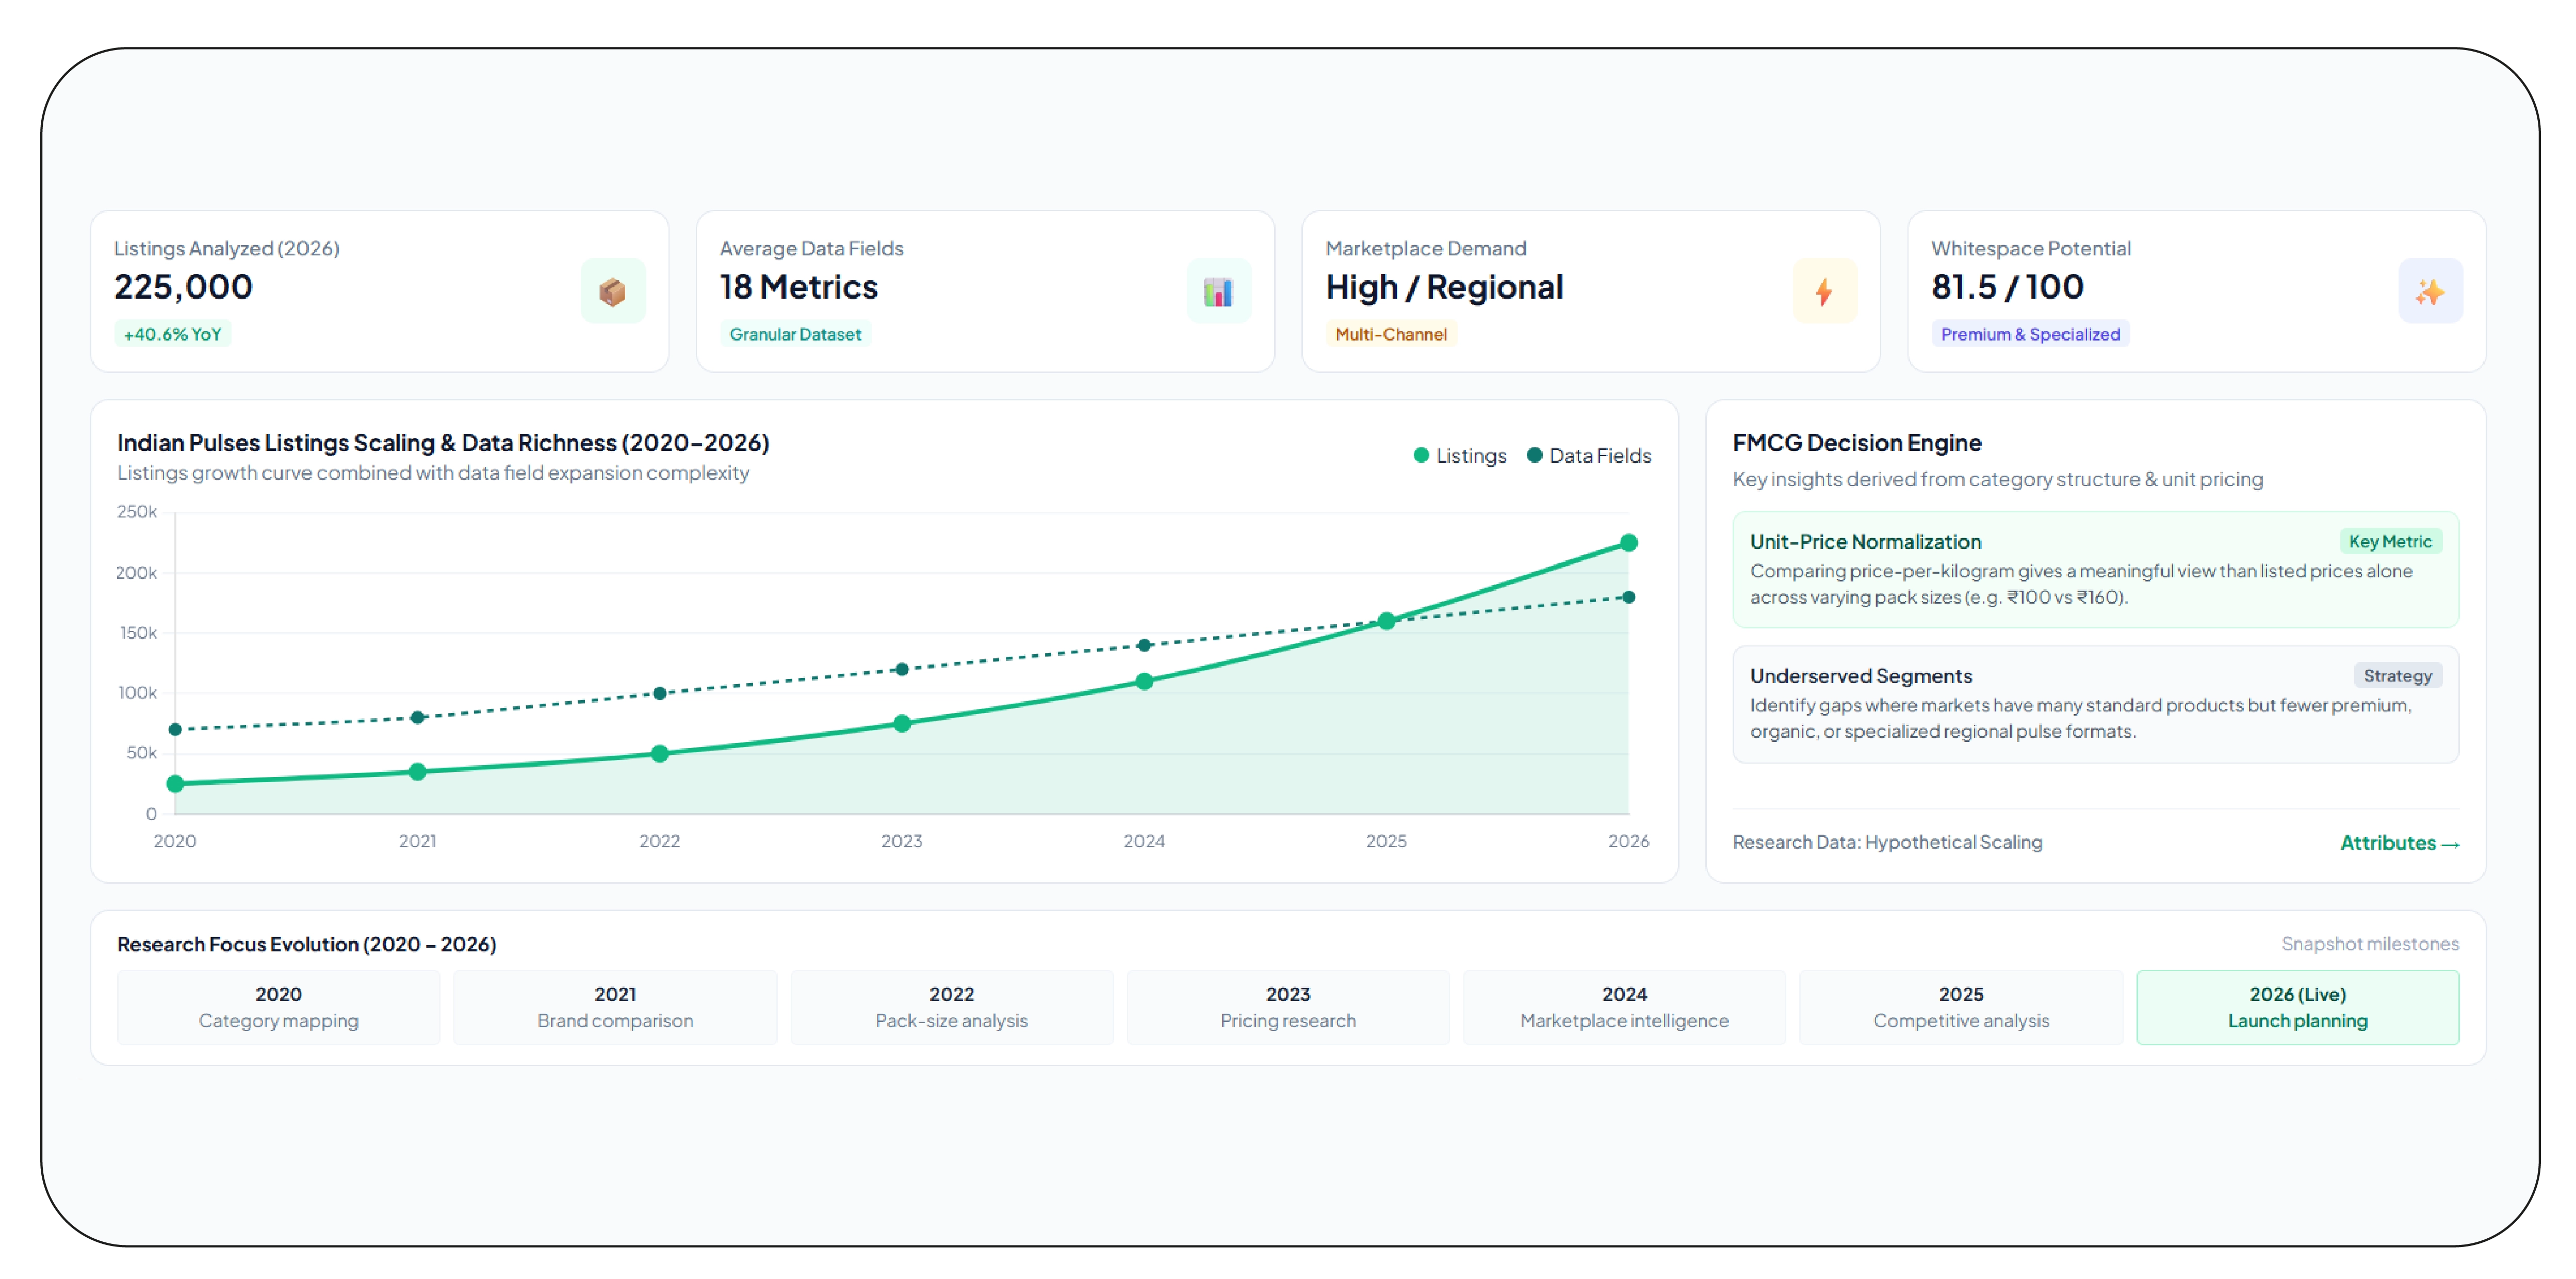
Pulses market analysis India for FMCG brands can reveal important patterns around product variety, pricing, pack sizes, brands, and marketplace availability. Pulses remain an important part of Indian food consumption, but demand can differ across regions, income groups, formats, and shopping channels.
Brands entering this market need more than national-level assumptions. They should compare product listings across marketplaces and identify which pulse varieties receive stronger visibility. They can also examine whether brands focus on economy packs, family packs, premium products, organic offerings, or regional varieties.
A useful research dataset can include product name, brand, pulse type, pack size, price, price per kilogram, ratings, availability, and promotional status.
Pulses Market Research Scale
| Year |
Hypothetical listings analyzed |
Average data fields |
Primary research focus |
| 2020 |
25,000 |
7 |
Category mapping |
| 2021 |
35,000 |
8 |
Brand comparison |
| 2022 |
50,000 |
10 |
Pack-size analysis |
| 2023 |
75,000 |
12 |
Pricing research |
| 2024 |
110,000 |
14 |
Marketplace intelligence |
| 2025 |
160,000 |
16 |
Competitive analysis |
| 2026 |
225,000 |
18 |
Launch planning |
These figures are hypothetical research-scaling examples, not official market statistics.
Brands can use the information to identify underserved segments. For example, a market may have many standard products but fewer premium or specialized options.
The analysis can also compare price-per-unit metrics. This gives a more meaningful view than comparing listed prices alone. A ₹100 product and a ₹160 product may have very different pack sizes.
For FMCG decision-makers, these insights support better product positioning, packaging, pricing, and channel selection.
How Can Marketplace Data Improve Spice and Pulse Pricing?
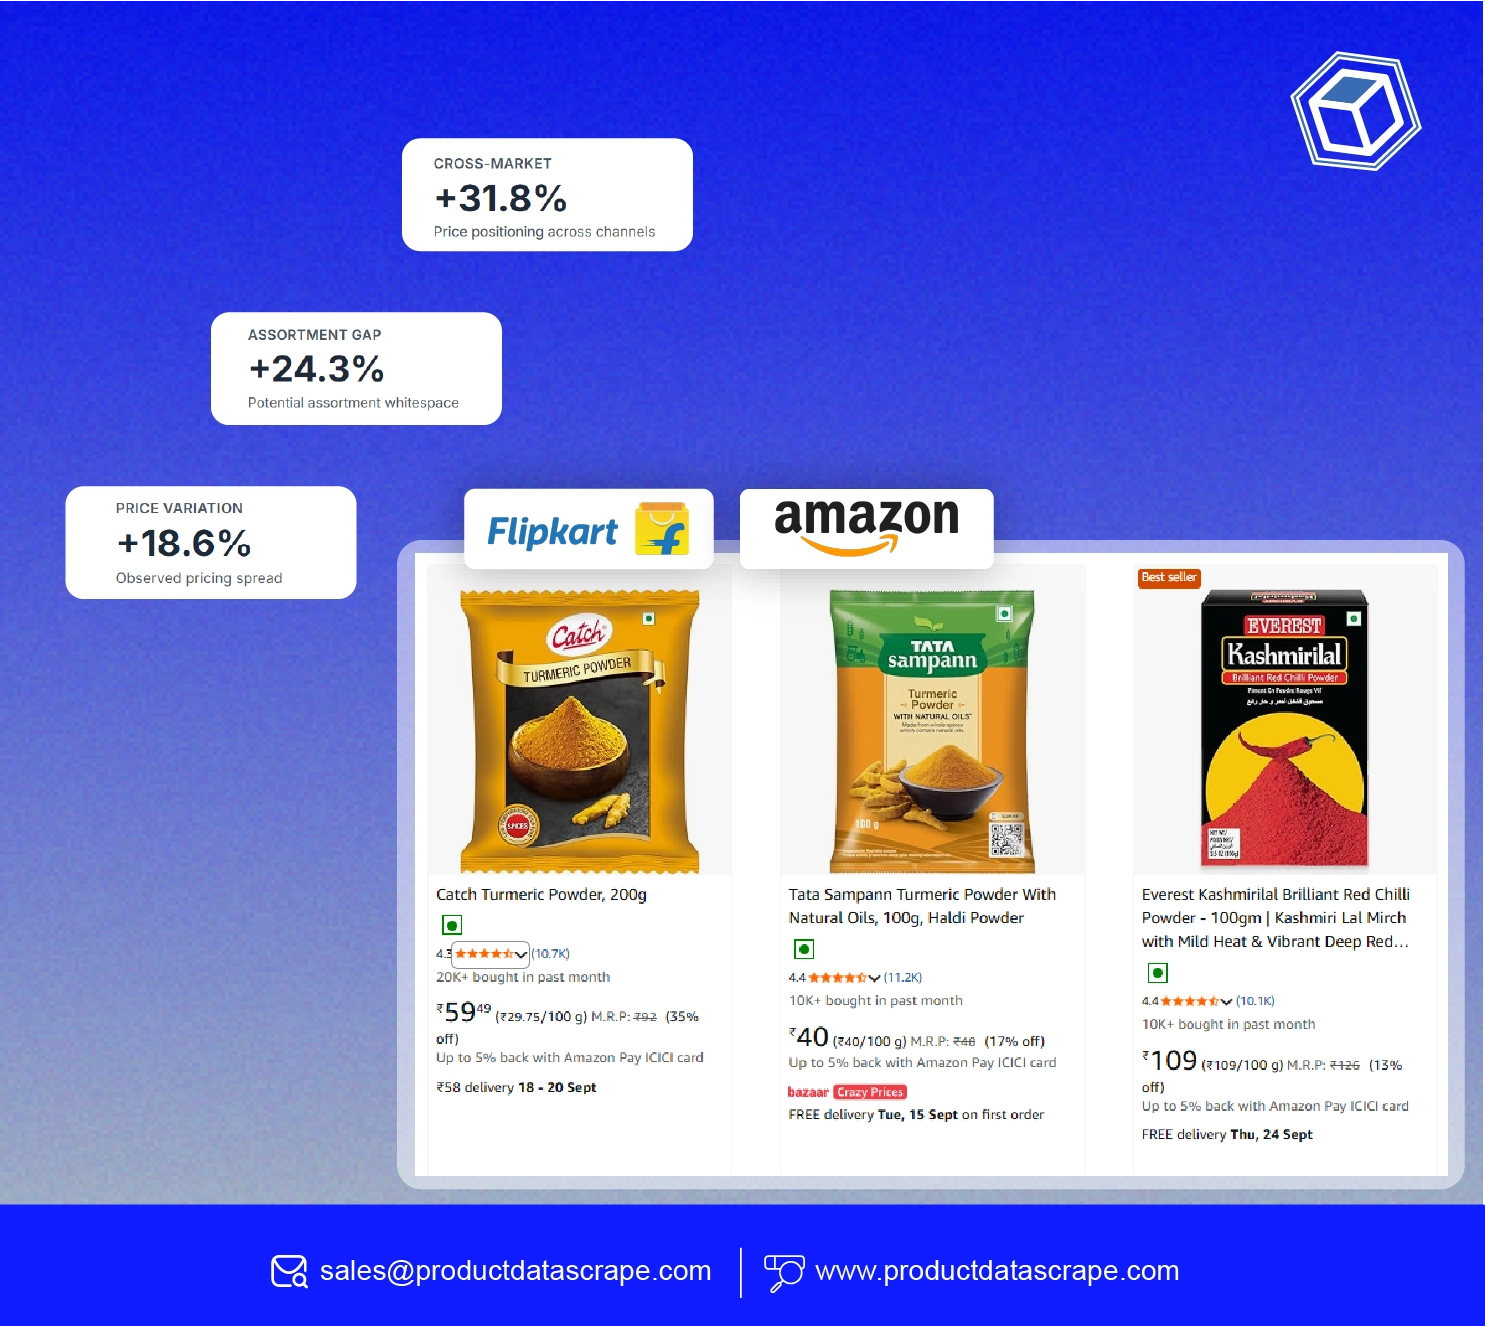
Flipkart spices and pulses pricing data, Amazon product data scraping can help brands benchmark product prices across major online channels. Price comparisons become more useful when businesses normalize pack sizes, product variants, and units.
A simple listing price does not always reveal the real competitive position. Businesses should examine price per 100 grams or kilogram when appropriate. They should also track discounts, promotional prices, pack combinations, and changes over time.
For example, a 500-gram spice pack priced at ₹180 and a one-kilogram pack priced at ₹320 should not be compared using headline prices alone.
Useful pricing fields include:
- Product title.
- Brand.
- Pack size.
- Listed price.
- Discounted price.
- Unit price.
- Product rating.
- Availability.
- Seller information where available.
- Collection date.
Pricing Data Scale
| Year |
Hypothetical products monitored |
Price observations |
Main objective |
| 2020 |
30,000 |
360,000 |
Baseline pricing |
| 2021 |
45,000 |
540,000 |
Competitor comparison |
| 2022 |
65,000 |
780,000 |
Pack-size benchmarking |
| 2023 |
95,000 |
1.14 million |
Discount monitoring |
| 2024 |
135,000 |
1.62 million |
Category pricing |
| 2025 |
190,000 |
2.28 million |
Competitive intelligence |
| 2026 |
275,000 |
3.3 million |
Pricing optimization |
The figures are hypothetical examples that illustrate possible monitoring scale.
Historical pricing is especially valuable. It can reveal whether a competitor frequently changes prices or maintains a stable position.
Brands can use this information to develop launch price ranges. They can also identify premium opportunities when competitor products cluster within a narrow price band.
Pricing data should always be interpreted alongside quality signals, pack sizes, brand strength, ratings, and availability. A low price alone does not mean a product will outperform the market.
How Can Regional Signals Improve Spice Product Planning?
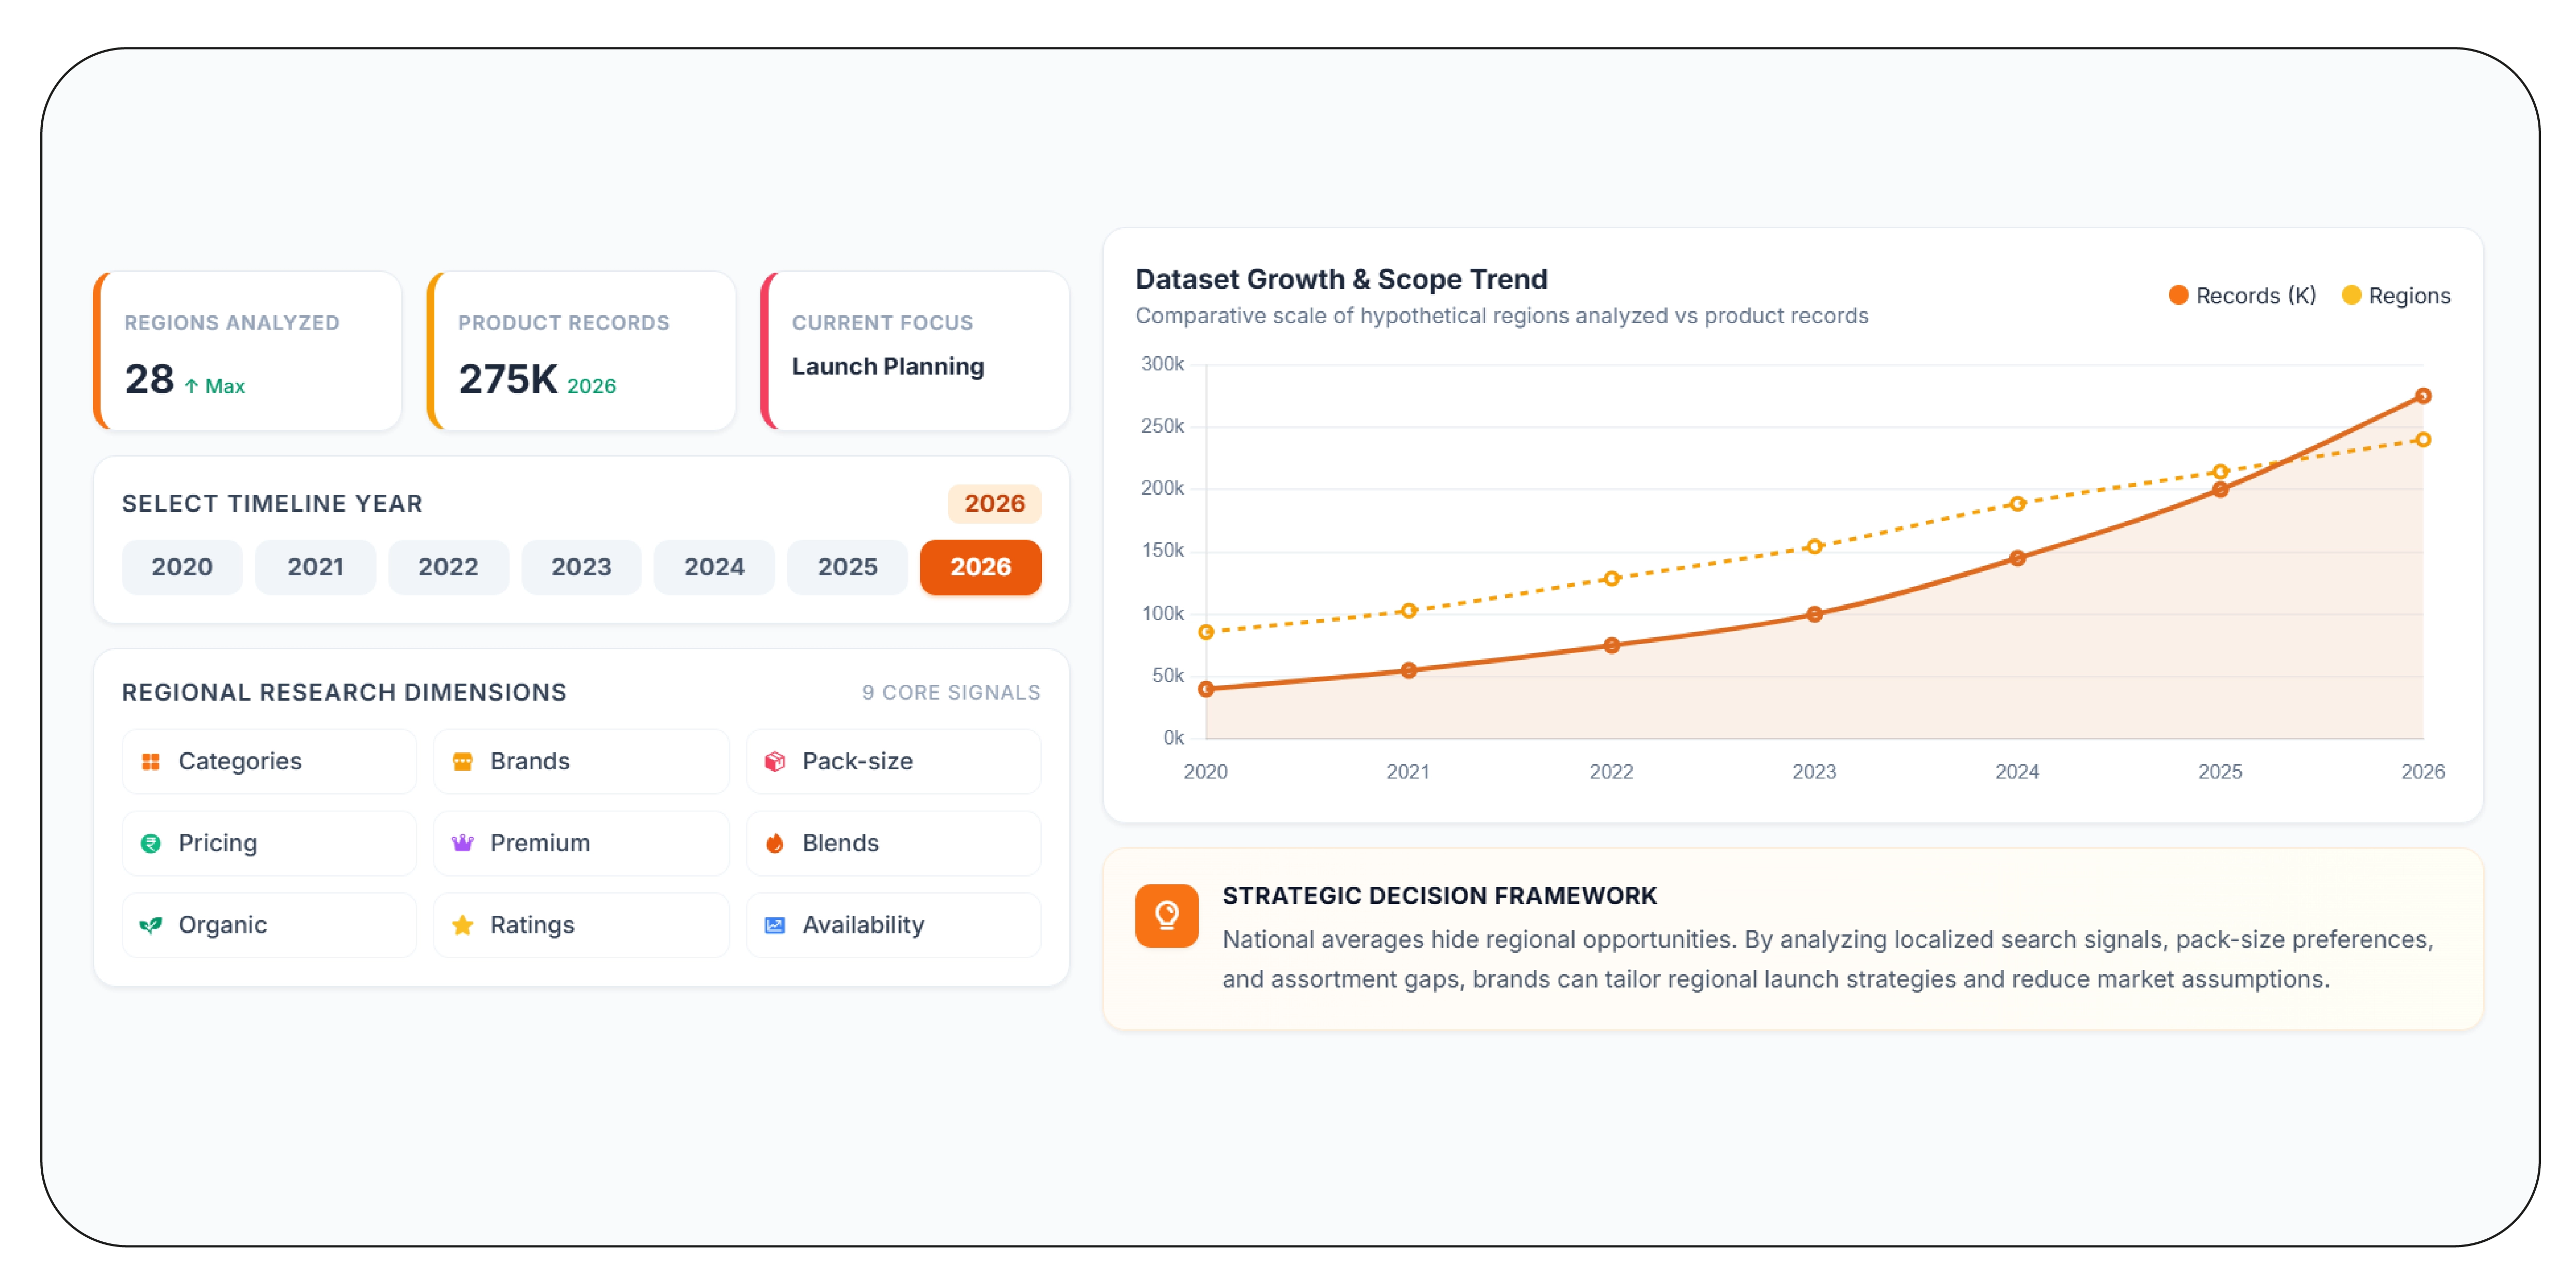
Regional spice demand analytics India can help businesses understand how product preferences may differ across locations. India has diverse food traditions, and spice consumption can vary based on regional cuisines, household preferences, and local purchasing behavior.
A national average may hide important opportunities. A spice with strong visibility in one region may have lower representation elsewhere. Brands can investigate regional differences by comparing product availability, search signals where legally and technically accessible, category depth, and marketplace assortment.
Regional research can examine:
- Spice categories.
- Regional brands.
- Pack-size preferences.
- Price ranges.
- Premium products.
- Traditional spice blends.
- Organic products.
- Product ratings.
- Availability patterns.
Regional Research Framework
| Year |
Hypothetical regions analyzed |
Product records |
Research focus |
| 2020 |
10 |
40,000 |
Regional mapping |
| 2021 |
12 |
55,000 |
Brand presence |
| 2022 |
15 |
75,000 |
Product preferences |
| 2023 |
18 |
100,000 |
Price differences |
| 2024 |
22 |
145,000 |
Assortment gaps |
| 2025 |
25 |
200,000 |
Demand signals |
| 2026 |
28 |
275,000 |
Regional launch planning |
These figures are hypothetical and demonstrate a possible research framework.
Regional insights can influence packaging and product positioning. A brand may choose different pack sizes or product combinations for different markets. It may also prioritize specific distribution channels.
For example, a company launching a regional spice blend can first examine whether similar products have sufficient marketplace presence. It can then compare price levels, reviews, brands, and pack sizes.
Regional research should not be treated as a direct measure of consumer demand unless supported by suitable sales or demand data. Marketplace listings are signals, not guaranteed sales figures.
Used carefully, however, regional product intelligence can help brands prioritize research and reduce assumptions.
How Can Quick-Commerce Assortment Monitoring Reveal Opportunities?
Instamart spices assortment tracking can help brands understand how spices and pulses appear within fast-delivery grocery channels. Quick commerce has changed how consumers discover and purchase everyday food products.
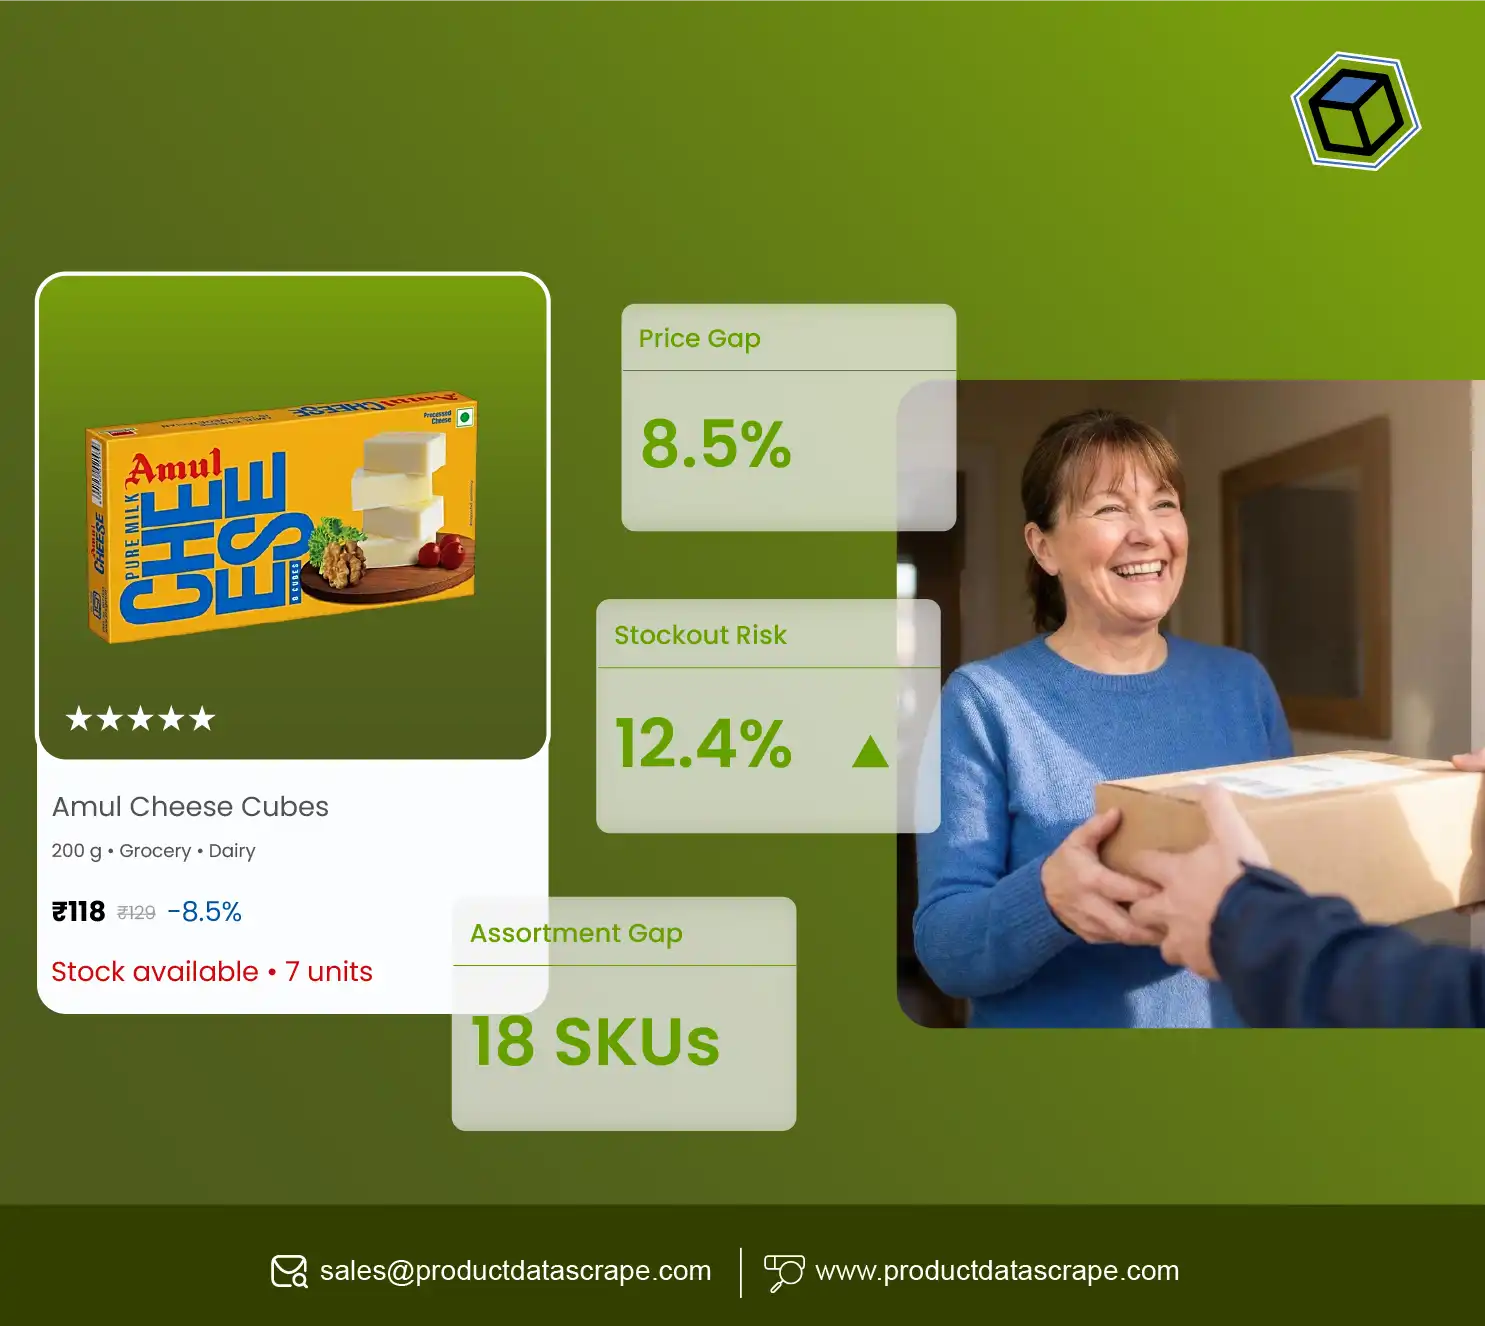
For FMCG brands, assortment matters because consumers often expect convenience and immediate availability. A product that is widely available in traditional retail but missing from a quick-commerce channel may have an opportunity for channel expansion.
Brands can monitor:
- Product availability.
- Number of competing SKUs.
- Pack sizes.
- Brand distribution.
- Price points.
- Discounts.
- Product categories.
- New product additions.
- Product removals.
Quick-Commerce Monitoring Scale
| Year |
Hypothetical SKUs tracked |
Availability checks |
Main use |
| 2020 |
5,000 |
30,000 |
Early channel research |
| 2021 |
8,000 |
48,000 |
Assortment mapping |
| 2022 |
15,000 |
90,000 |
Category tracking |
| 2023 |
25,000 |
150,000 |
Competitor monitoring |
| 2024 |
45,000 |
270,000 |
Pricing research |
| 2025 |
70,000 |
420,000 |
Launch intelligence |
| 2026 |
100,000 |
600,000 |
Continuous monitoring |
These figures are hypothetical and are provided for illustration.
Availability data can reveal gaps. If several competing products appear consistently while a target category has limited representation, brands can investigate whether an assortment opportunity exists.
Quick-commerce data can also support launch sequencing. A company may launch a product in selected locations, monitor availability and competitor activity, and then expand based on results.
The important point is to separate listing presence from actual consumer demand. A product being listed does not guarantee strong sales.
When combined with pricing, ratings, assortment depth, and sales data where available, quick-commerce monitoring becomes a useful component of broader FMCG research.
How Can Amazon Category Data Strengthen Spice Launch Decisions?
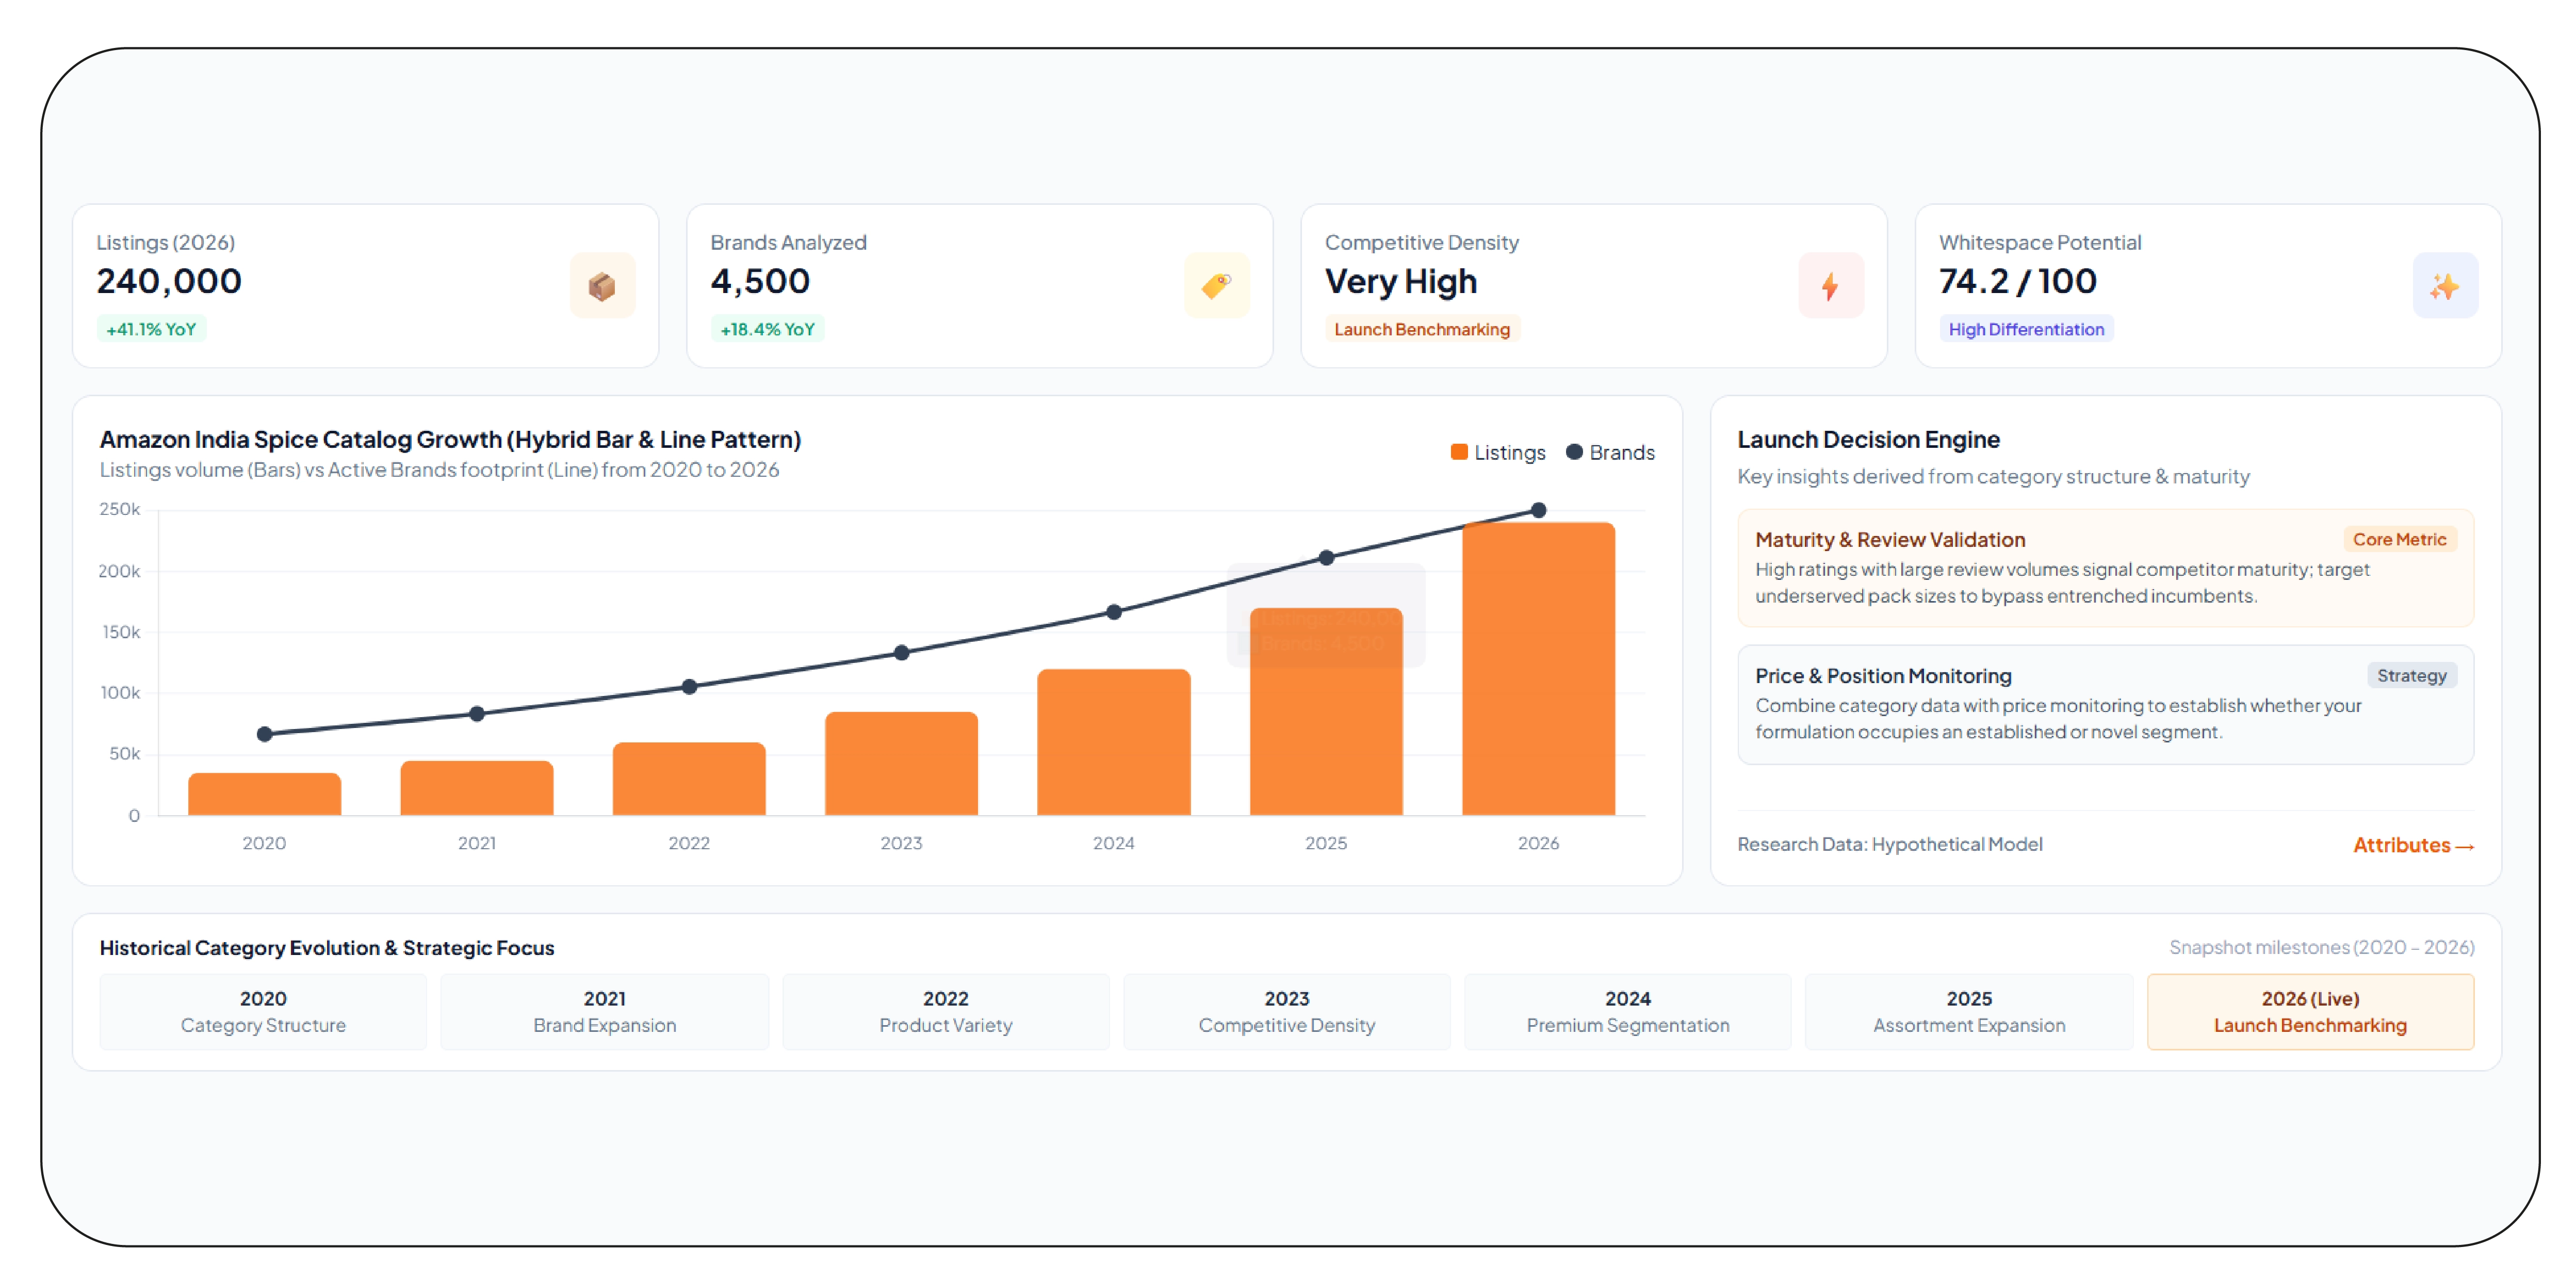
Amazon India spices category analysis can provide a detailed view of online assortment, pricing, brands, product attributes, and customer feedback. Amazon has a broad product catalog, which makes category-level analysis useful for understanding competitive positioning.
A spice brand can compare the number of competing products within a category and examine how brands differentiate themselves.
Common attributes include:
- Product type.
- Brand.
- Pack size.
- Price.
- Discount.
- Rating.
- Review count.
- Ingredients.
- Certifications where listed.
- Availability.
Amazon Category Research Scale
| Year |
Hypothetical category listings |
Brands analyzed |
Key insight |
| 2020 |
35,000 |
1,200 |
Category structure |
| 2021 |
45,000 |
1,500 |
Brand expansion |
| 2022 |
60,000 |
1,900 |
Product variety |
| 2023 |
85,000 |
2,400 |
Competitive density |
| 2024 |
120,000 |
3,000 |
Premium segmentation |
| 2025 |
170,000 |
3,800 |
Assortment expansion |
| 2026 |
240,000 |
4,500 |
Launch benchmarking |
These are hypothetical research figures, not reported Amazon marketplace statistics.
Review counts and ratings can provide additional context. A product with a high rating and extensive review history may have stronger marketplace maturity than a recently launched listing.
Brands can also identify whitespace. If most products focus on similar pack sizes, formulations, or positioning, a differentiated offering may deserve further testing.
Category analysis works best when combined with competitor price monitoring. A brand can assess whether its proposed product sits in an established price segment or creates a new position.
This makes online category research useful for product development, pricing, packaging, and launch planning.
How Can Data From India's Online Grocery Market Support Launch Planning?
India market, Swiggy Instamart Scraping API can support structured research into online grocery assortment, product availability, pricing, and competitive positioning. Quick-commerce channels can change rapidly, so historical snapshots can provide more context than one-time observations.
A scalable data workflow can help teams organize product information across locations and categories. Analysts can compare brands, pack sizes, prices, availability, and product presence.
A practical workflow includes:
- Define the target spice or pulse category.
- Identify relevant marketplace channels.
- Collect standardized product attributes.
- Normalize pack sizes and prices.
- Record availability by location where applicable.
- Store historical snapshots.
- Compare competitor movements.
- Build launch recommendations.
Grocery Market Data Scale
| Year |
Hypothetical grocery records |
Locations monitored |
Primary objective |
| 2020 |
20,000 |
5 |
Market mapping |
| 2021 |
30,000 |
7 |
Category research |
| 2022 |
50,000 |
10 |
Assortment analysis |
| 2023 |
80,000 |
15 |
Competitive research |
| 2024 |
125,000 |
20 |
Pricing analysis |
| 2025 |
190,000 |
25 |
Launch planning |
| 2026 |
275,000 |
30 |
Continuous intelligence |
These figures are hypothetical examples for demonstrating data-monitoring growth.
Cross-channel analysis is valuable because the same brand can have different pricing or assortment strategies across marketplaces. A product may have broad Amazon coverage but limited quick-commerce presence.
Brands can use these differences to evaluate channel-specific opportunities.
For launch teams, the goal is not simply to collect more data. It is to answer practical questions. Which products should launch first? What price should they test? Which pack sizes should they offer? Which locations deserve priority? Which competitors require closer monitoring?
Structured data can make these questions easier to answer.
What Steps Should Brands Follow Before Launching a New Spice or Pulse Product?
A strong launch research process should combine category research, competitive monitoring, pricing analysis, and assortment evaluation.
Step 1: Define the Product
Specify the product type, ingredients, pack sizes, target customer, price segment, and positioning.
Step 2: Map the Competition
Identify direct and indirect competitors across Amazon, Flipkart, and relevant quick-commerce channels.
Step 3: Normalize Prices
Convert prices into comparable units. This avoids misleading comparisons caused by different pack sizes.
Step 4: Study Assortment
Analyze which products, brands, pack sizes, and variants dominate the category.
Step 5: Examine Regional Differences
Compare product presence and pricing across relevant regions.
Step 6: Track Historical Changes
Store product records over time. This reveals pricing and assortment movement.
Step 7: Build a Launch Hypothesis
Use the findings to create a proposed product, price, pack size, and channel strategy.
Step 8: Test and Refine
Launch in selected markets when appropriate. Compare actual results with research assumptions and refine the strategy.
This process helps reduce guesswork. It also creates a repeatable framework for future launches.
How Can Brands Use Data to Estimate Sales Potential?
Sales forecasting requires more than product listings. However, marketplace data can provide useful indicators that support a broader forecast.
Brands can evaluate:
- Number of competing products.
- Price distribution.
- Review volume.
- Rating patterns.
- Product availability.
- Discount frequency.
- Assortment depth.
- Regional presence.
- Historical product movement.
For example, a category with many established competitors may require stronger differentiation. A category with limited assortment may present an opportunity, but businesses should validate actual demand before investing heavily.
A practical model can combine internal sales history with external marketplace signals.
Sales Signal Framework
| Signal |
What it can indicate |
| Price range |
Competitive positioning |
| Review volume |
Listing maturity or engagement |
| Ratings |
Customer perception |
| Availability |
Channel presence |
| Assortment depth |
Competitive density |
| Pack sizes |
Consumer-oriented formats |
| Regional presence |
Geographic opportunity |
| Historical changes |
Market movement |
The model should treat these as indicators rather than guaranteed sales predictors.
This distinction matters. A marketplace listing shows what is offered. It does not automatically show how many units the product sells.
Combining external data with internal sales, distribution, advertising, and customer data creates a more reliable forecasting framework.
Why Is Cross-Channel Comparison Important for FMCG Brands?
Consumers do not always shop through one channel. A brand can therefore have different competitive positions across marketplaces and quick-commerce platforms.
Amazon may offer broad assortment. Flipkart may reveal another competitive set. Quick-commerce platforms may emphasize convenience and immediate availability.
Cross-channel comparison can identify:
- Price differences.
- Assortment differences.
- Pack-size differences.
- Availability gaps.
- Promotional differences.
- Brand concentration.
- Channel-specific opportunities.
This is especially useful for new products. A launch strategy that works on one channel may not work equally well on another.
Brands should therefore create channel-specific benchmarks instead of using one national benchmark for every marketplace.
The 2020–2026 tables in this article provide hypothetical examples of how monitoring can expand as digital product intelligence becomes more detailed. Actual market performance should always be validated with reliable sales and demand data.
Why Choose Product Data Scrape?
Product Data Scrape helps businesses turn large amounts of marketplace information into structured product intelligence. It can support research around pricing, assortment, product availability, competitor activity, and category trends.
For FMCG brands, structured data makes product comparisons easier. Teams can organize listings by brand, category, pack size, price, rating, and availability.
The approach can support recurring research instead of one-time analysis. Historical records help teams identify changes and compare market conditions over time.
Brands can use these insights during product development, pricing reviews, launch planning, and competitive benchmarking.
Spot trending products by combining product-level signals with category, pricing, availability, and regional information. This gives decision-makers a clearer view of the market before they commit resources to a new product or channel!
Conclusion
Launching a new spice or pulse product requires more than a strong recipe or attractive packaging. Brands need evidence about pricing, assortment, competitors, regional opportunities, and channel behavior.
India Spices and Pulses launch Market Research provides a framework for evaluating these factors across Amazon, Flipkart, and quick-commerce channels. Historical product data can reveal pricing movements and assortment changes that a single snapshot may miss.
For FMCG brands, the result is better preparation. Teams can identify opportunities, test pricing assumptions, refine pack sizes, and prioritize channels before scaling.
Use Product Data Scrape to strengthen your launch strategy, protect your brand, and turn marketplace product intelligence into actionable decisions for India's spices and pulses market!
FAQs
1. Why is marketplace research important before launching spices?
Marketplace research helps brands understand competitors, pricing, pack sizes, assortment, ratings, and availability before selecting a product positioning and launch strategy.
2. Can product data help estimate sales performance?
Yes. Product data can provide useful demand indicators, but reliable sales forecasting should combine marketplace signals with internal sales and distribution information.
3. Which channels should FMCG brands monitor?
Brands can monitor Amazon, Flipkart, quick-commerce platforms, and other relevant channels to compare pricing, assortment, availability, promotions, and competitor positioning.
4. How can Product Data Scrape support FMCG research?
Product Data Scrape can help organize marketplace product information into structured datasets that support pricing analysis, assortment research, competitive monitoring, and launch planning.
5. How often should spice and pulse data be monitored?
Monitoring frequency depends on category volatility. Fast-changing prices and availability may require frequent checks, while broader category research can use weekly or monthly snapshots.


 Singapore
 EMAIL
EMAIL
 PHONE
PHONE



.webp "thumb")













.webp)






