Introduction
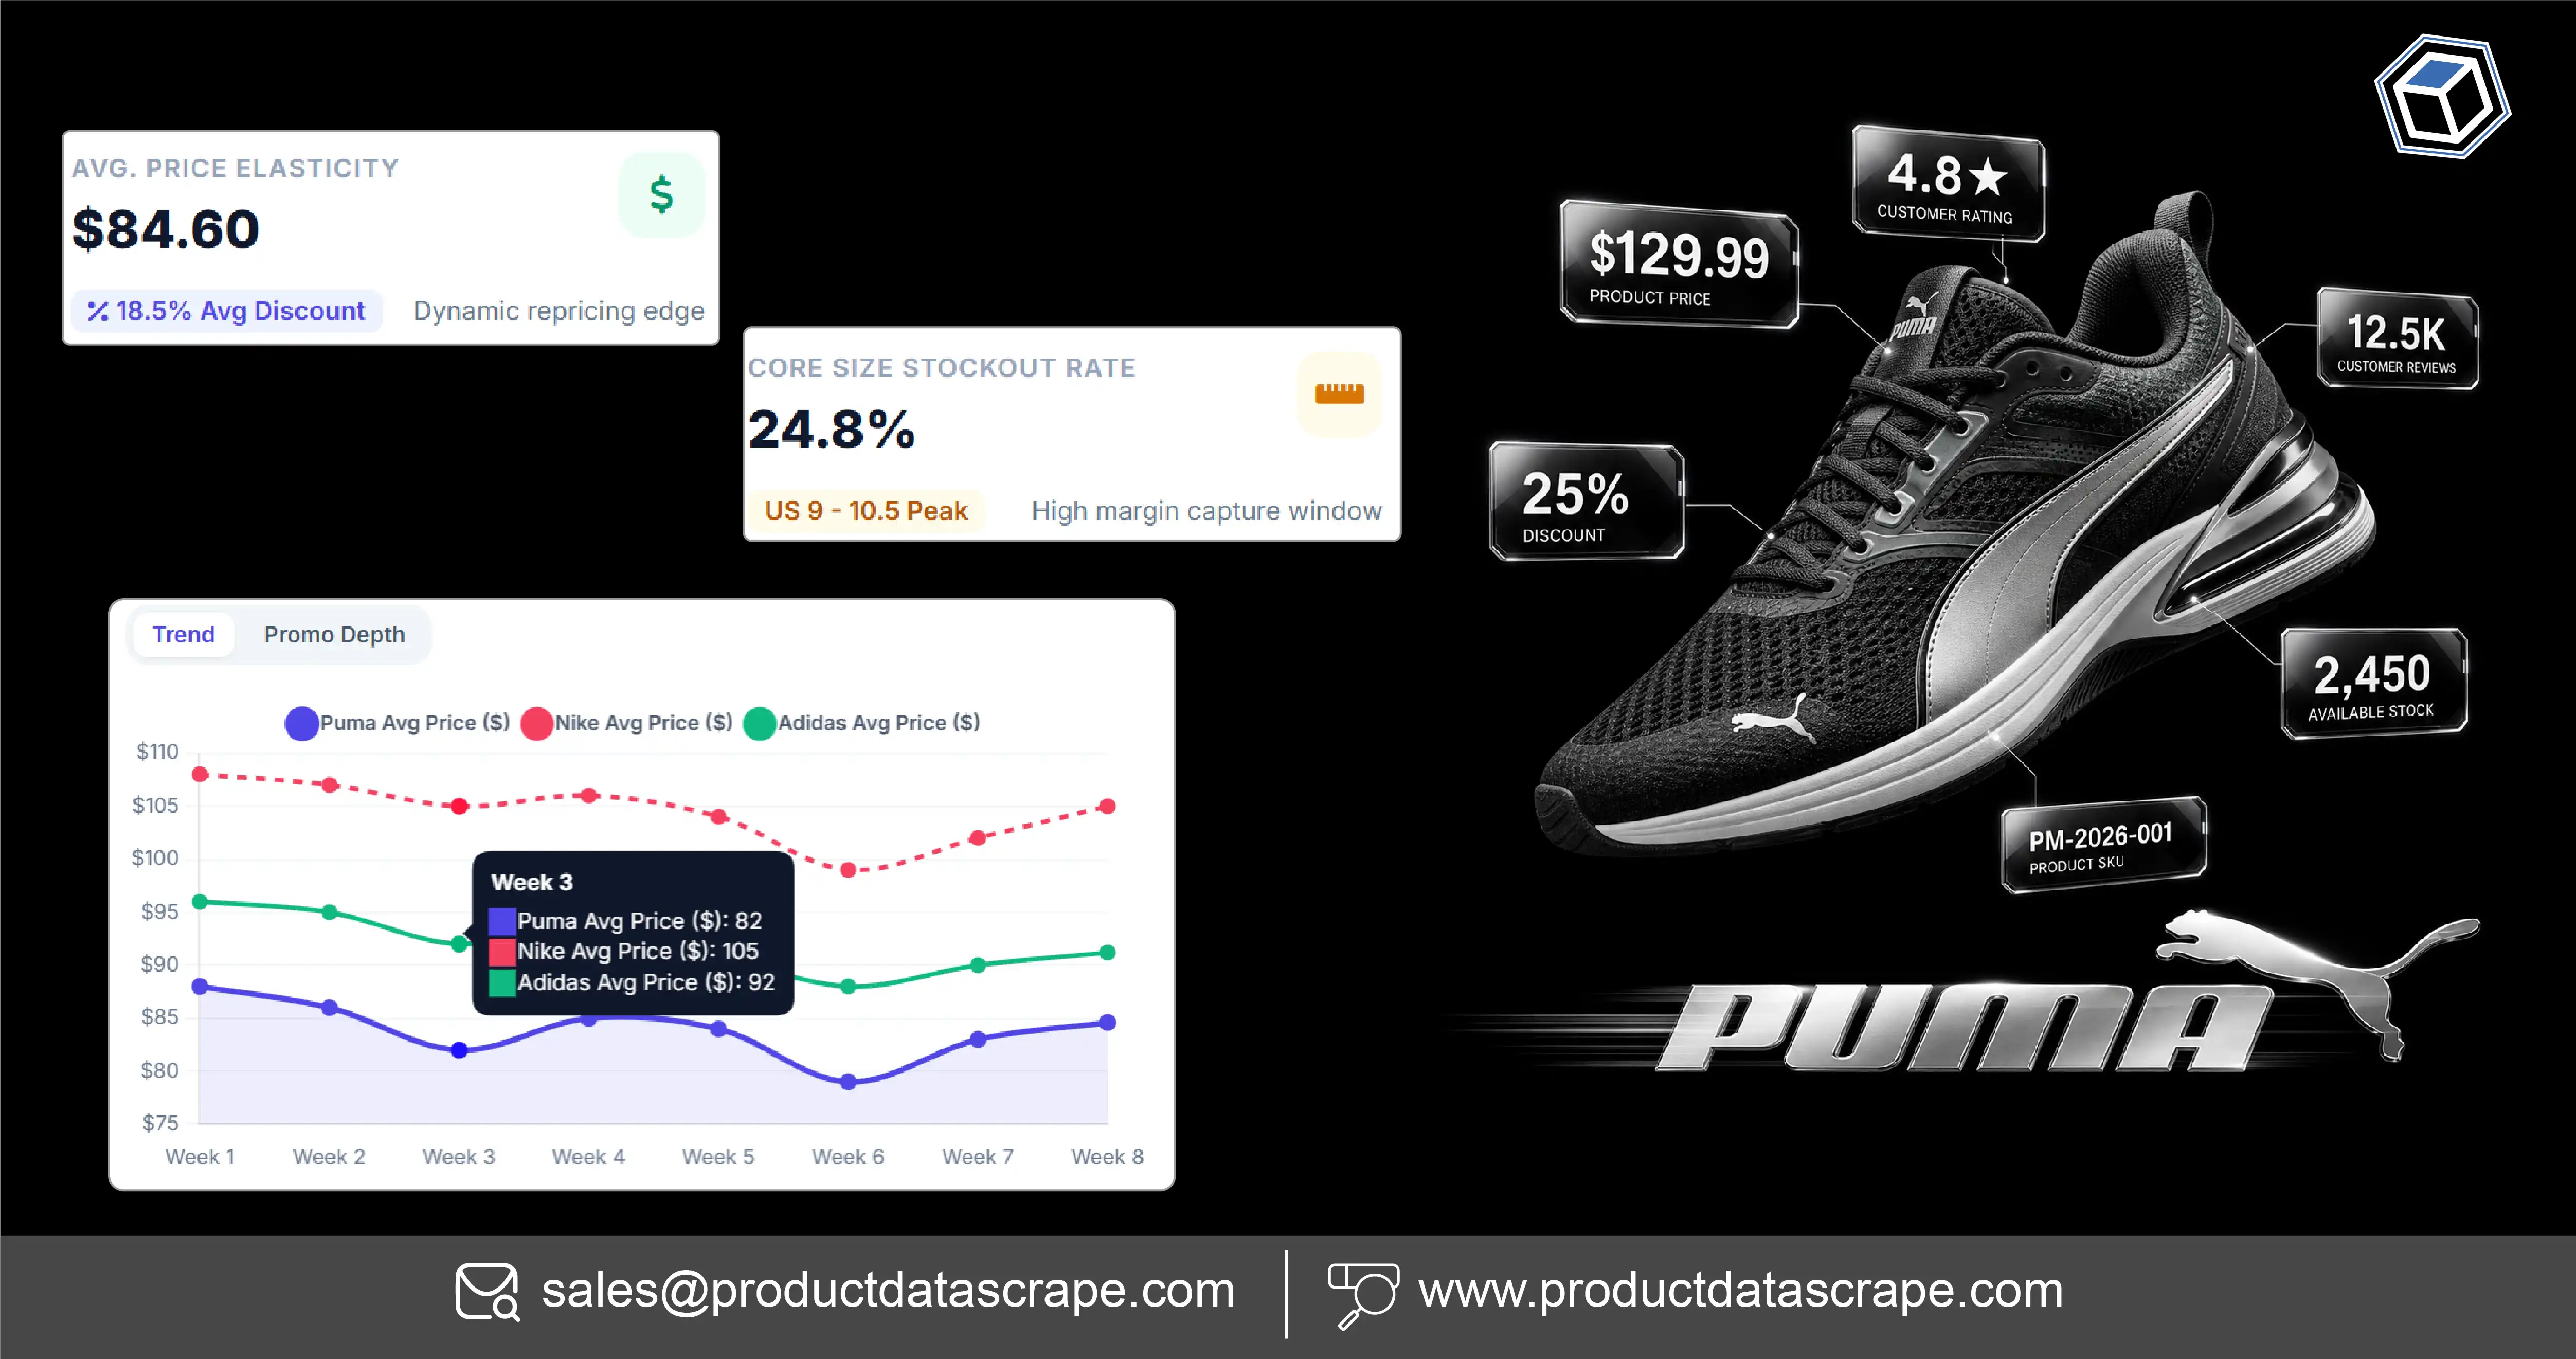
Puma product size and price intelligence helps footwear retailers understand competitor pricing, identify popular shoe sizes, monitor product availability, and make better inventory decisions. By collecting structured information from publicly accessible product listings, retailers can compare prices, color variants, discounts, product specifications, and stock indicators across online stores. Puma Product Size and Price Scraping makes it easier to organize these details into consistent datasets for competitive analysis and assortment planning.
Footwear retailers face several challenges when managing products across multiple e-commerce platforms. The same Puma shoe model may appear with different prices, promotional offers, color options, and size availability depending on the retailer, country, or sales channel. Manually checking every listing is time-consuming and makes it difficult to identify pricing differences quickly.
An automated E-Commerce Scraper can collect relevant product information, standardize product attributes, and support recurring monitoring. Retailers can use this intelligence to identify price movements, evaluate product demand signals, recognize assortment gaps, and understand how competitors position Puma footwear and sportswear.
This approach is particularly useful for e-commerce managers, footwear distributors, category analysts, pricing teams, and fashion retailers who need reliable product-level information to improve merchandising decisions.
How Do Product Colors Help Retailers Understand Footwear Demand?
Color variations are important in footwear merchandising because shoppers often compare the same shoe model across multiple shades before making a purchase. Retailers need to understand which color options are available, how prices differ between variants, and whether particular colors disappear from product listings more frequently than others.
Puma Shoe Color Variant Data Scraping helps retailers collect product names, model identifiers, color names, product images, prices, discounts, sizes, and availability indicators. This information can be organized by product model and color to make comparisons easier. For example, retailers can identify whether a particular colorway is listed at a different promotional price from other variants of the same model.
Through Fashion data scraping, businesses can also study product assortment changes across footwear and apparel categories. Combining color information with product prices and size availability provides a more complete view of a competitor's assortment.
A useful dataset should include the product SKU, color variant, original price, current price, discount percentage, product URL, retailer, and collection date. Historical records help analysts distinguish temporary promotional changes from longer-term assortment decisions.
PUMA's financial reporting demonstrates why product-level analysis matters. Its footwear division generated €4,733.6 million in sales in 2024, compared with €2,367.6 million in 2020. These are company-wide financial figures, not individual shoe-model sales.
| Year | PUMA footwear sales (€ million) |
|---|
| 2020 | 2,367.6 |
| 2021 | 3,163.6 |
| 2022 | 4,317.9 |
| 2023 | 4,583.4 |
| 2024 | 4,733.6 |
Source: PUMA Annual Report 2024. Figures represent reported footwear division revenue, not scraped product prices or individual SKU demand.
Actionable retailer insight: Compare the number of listed colors, price differences, and size availability for each model. This helps identify assortment gaps and informs decisions about which color variants deserve additional merchandising attention.
How Can Retailers Compare Sportswear Prices and Identify Trending Products?
Price comparison is essential for retailers competing in the sportswear market. Puma footwear and apparel can be sold through brand-owned channels, authorized retailers, and online marketplaces. Prices may vary because of promotions, seasonal clearance, retailer-specific discounts, and regional pricing strategies.
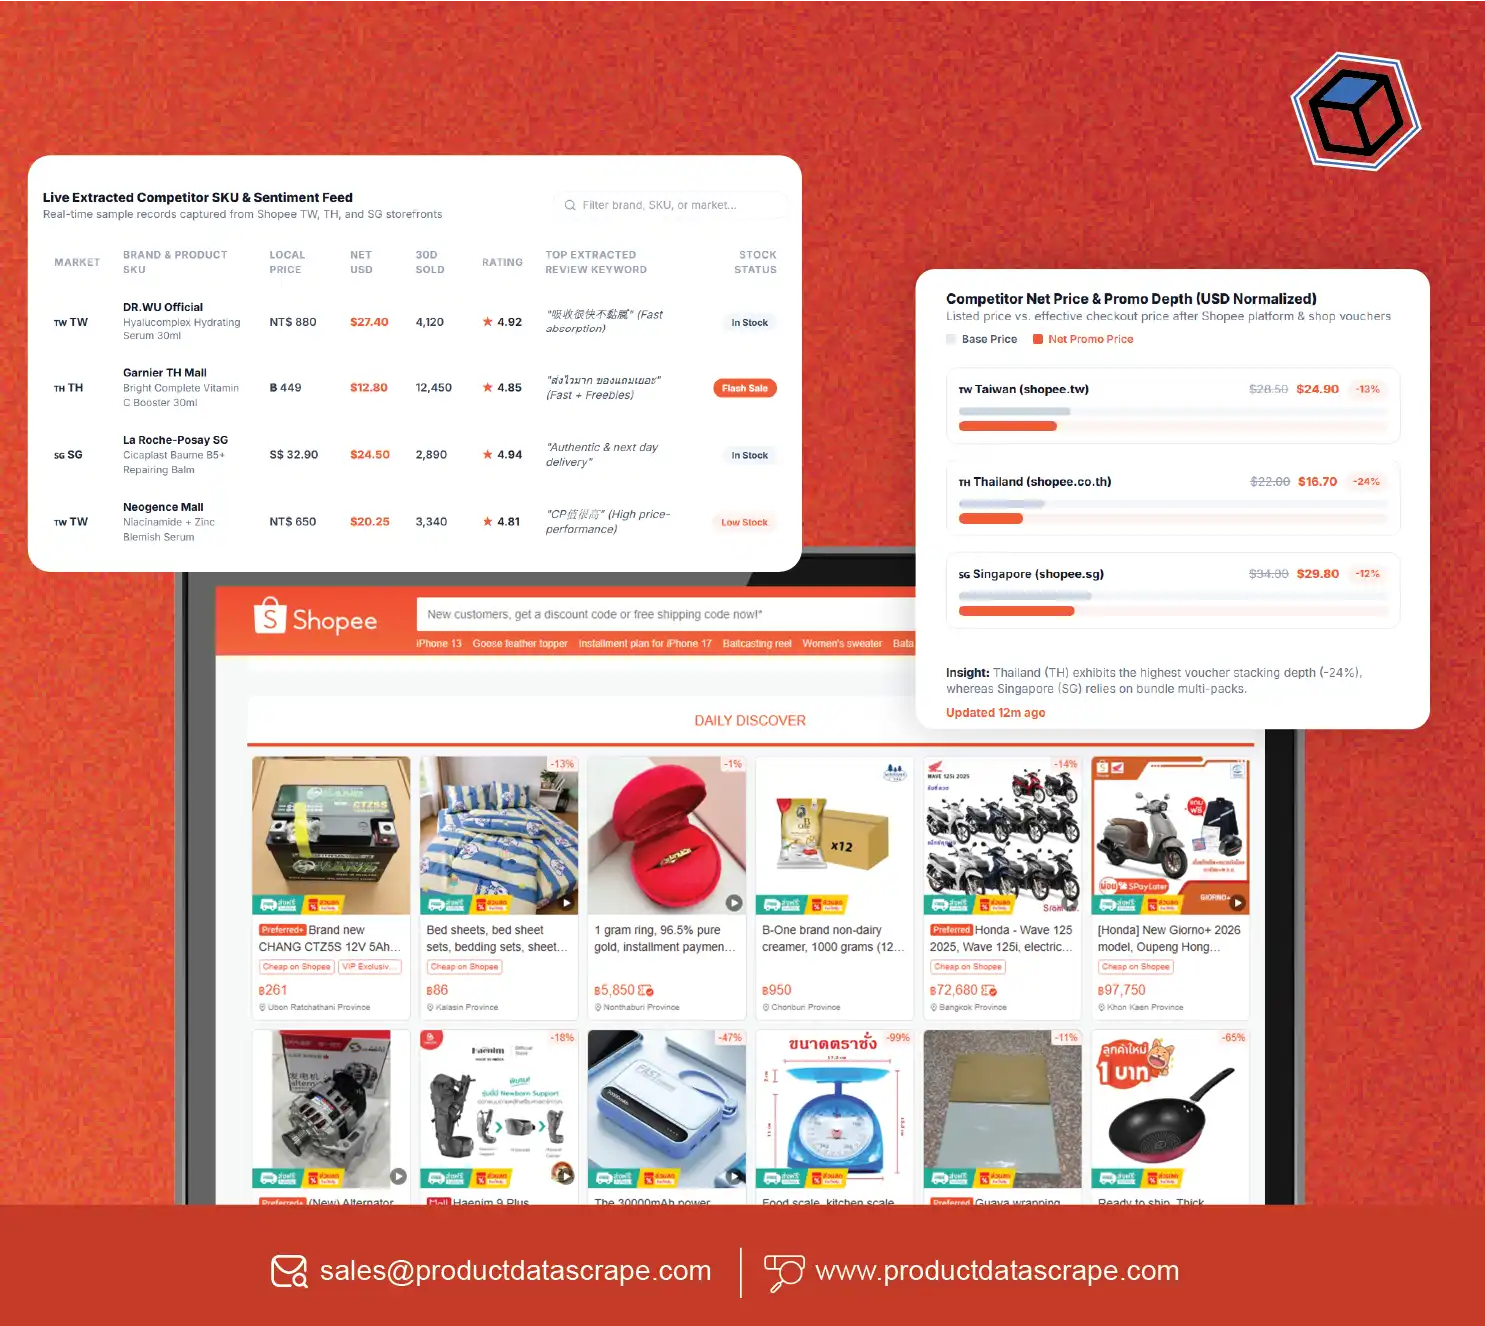
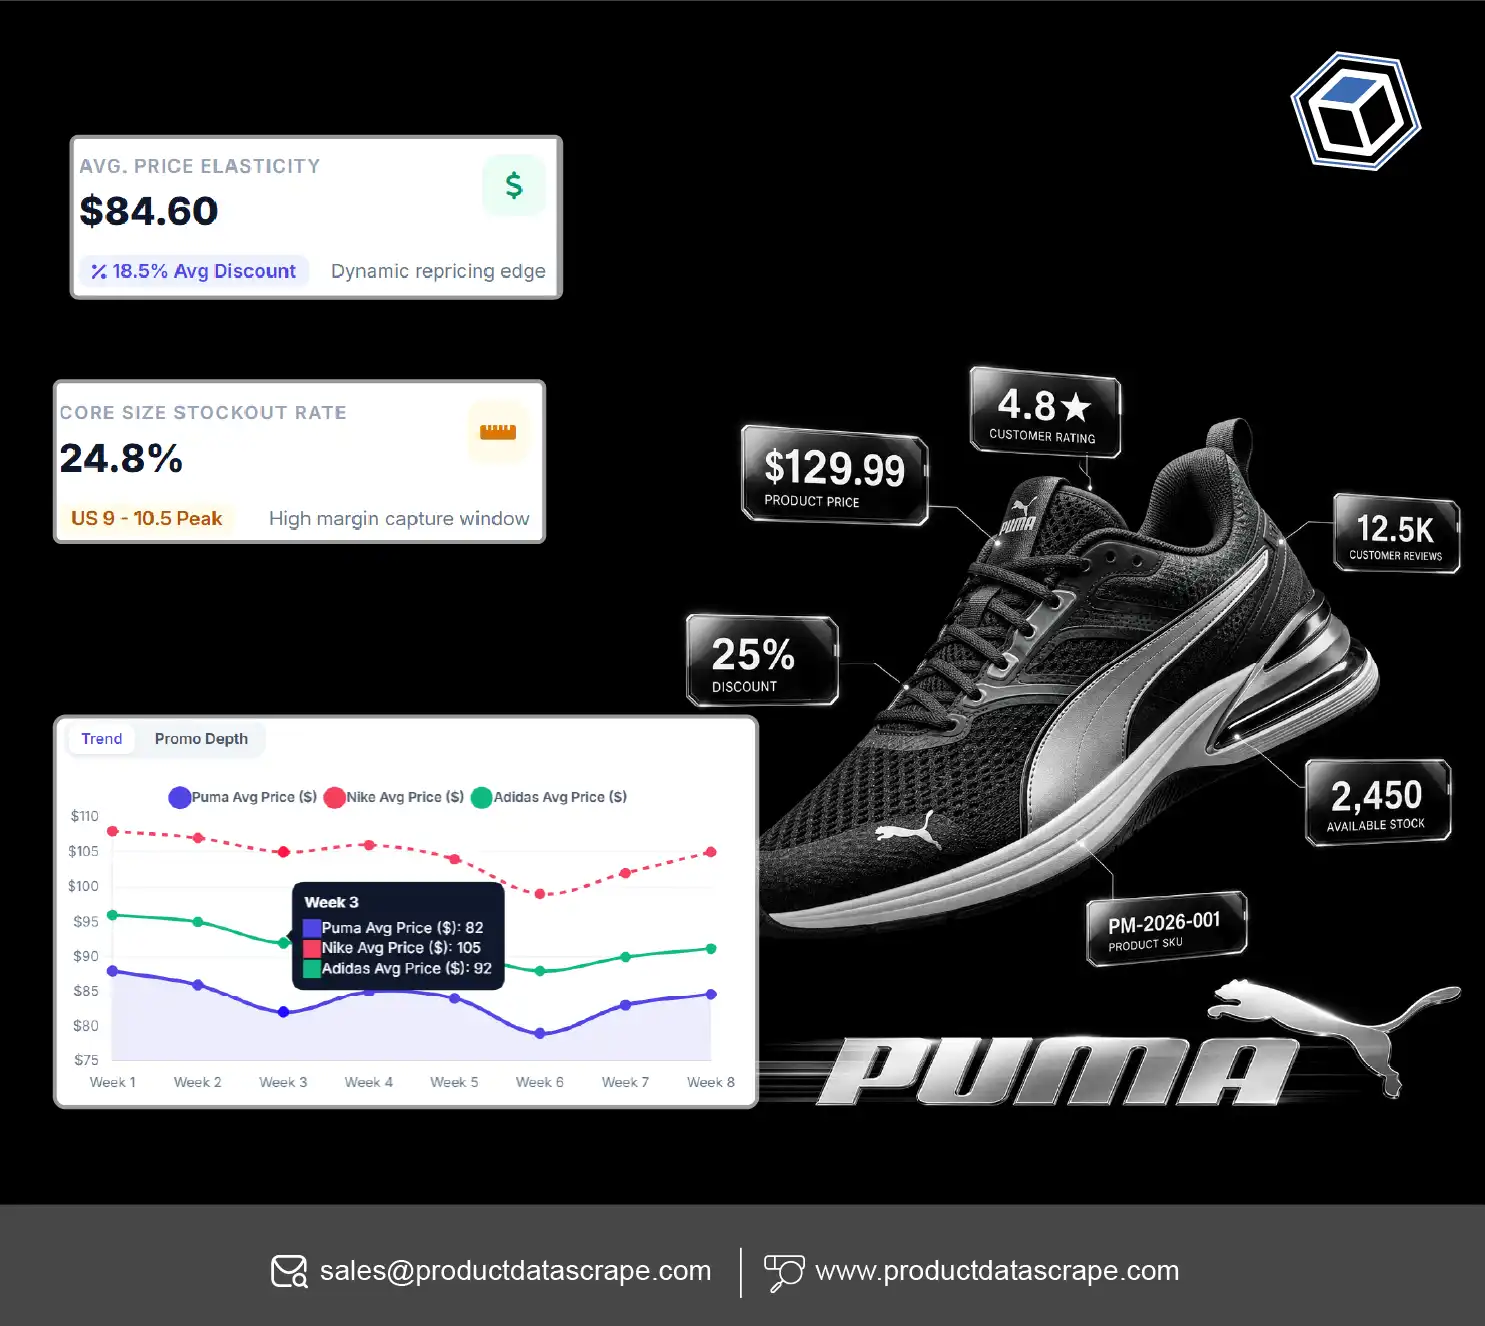
Puma Apparel and Footwear Price Comparison enables retailers to compare the listed price of matching products across different sales channels. A properly structured dataset should capture the product name, model number, category, listed price, discounted price, currency, seller, product URL, and timestamp.
Retailers can use these records to identify products that receive frequent discounts, models that maintain relatively stable prices, and categories where competitors are more aggressive with promotions.
The ability to Spot trending products also depends on monitoring changes over time rather than relying on a single price snapshot. Repeated appearances in retailer assortments, expanding color selections, new product releases, and sustained listing availability can provide useful merchandising signals. However, listing frequency alone does not establish actual consumer demand or sales volume.
PUMA's 2025 annual report recorded group sales of €7,296.2 million, down 13.1% from the adjusted 2024 figure of €8,398.0 million. Its report also discussed strategic distribution changes and promotional activity associated with inventory clearance.
| Year | PUMA reported group sales (€ million) |
|---|
| 2020 | Not included in this comparison |
| 2021 | 6,805.4 |
| 2022 | 8,465.1 |
| 2023 | 8,601.7 |
| 2024* | 8,398.0 |
| 2025* | 7,296.2 |
Source: PUMA Annual Report 2025. The 2024 and 2025 figures include adjustments relating to discontinued operations. Earlier years were not retrospectively adjusted.
Retailers should combine price comparisons with product-level attributes. A discount on one color or size should not automatically be interpreted as a discount across the entire product model. Maintaining variant-level price histories helps avoid inaccurate comparisons.
Actionable retailer insight: Create weekly price-position reports that identify the lowest listed price, median competitor price, discount frequency, and products with significant price movements.
How Does Size-Level Monitoring Improve Pricing Decisions?
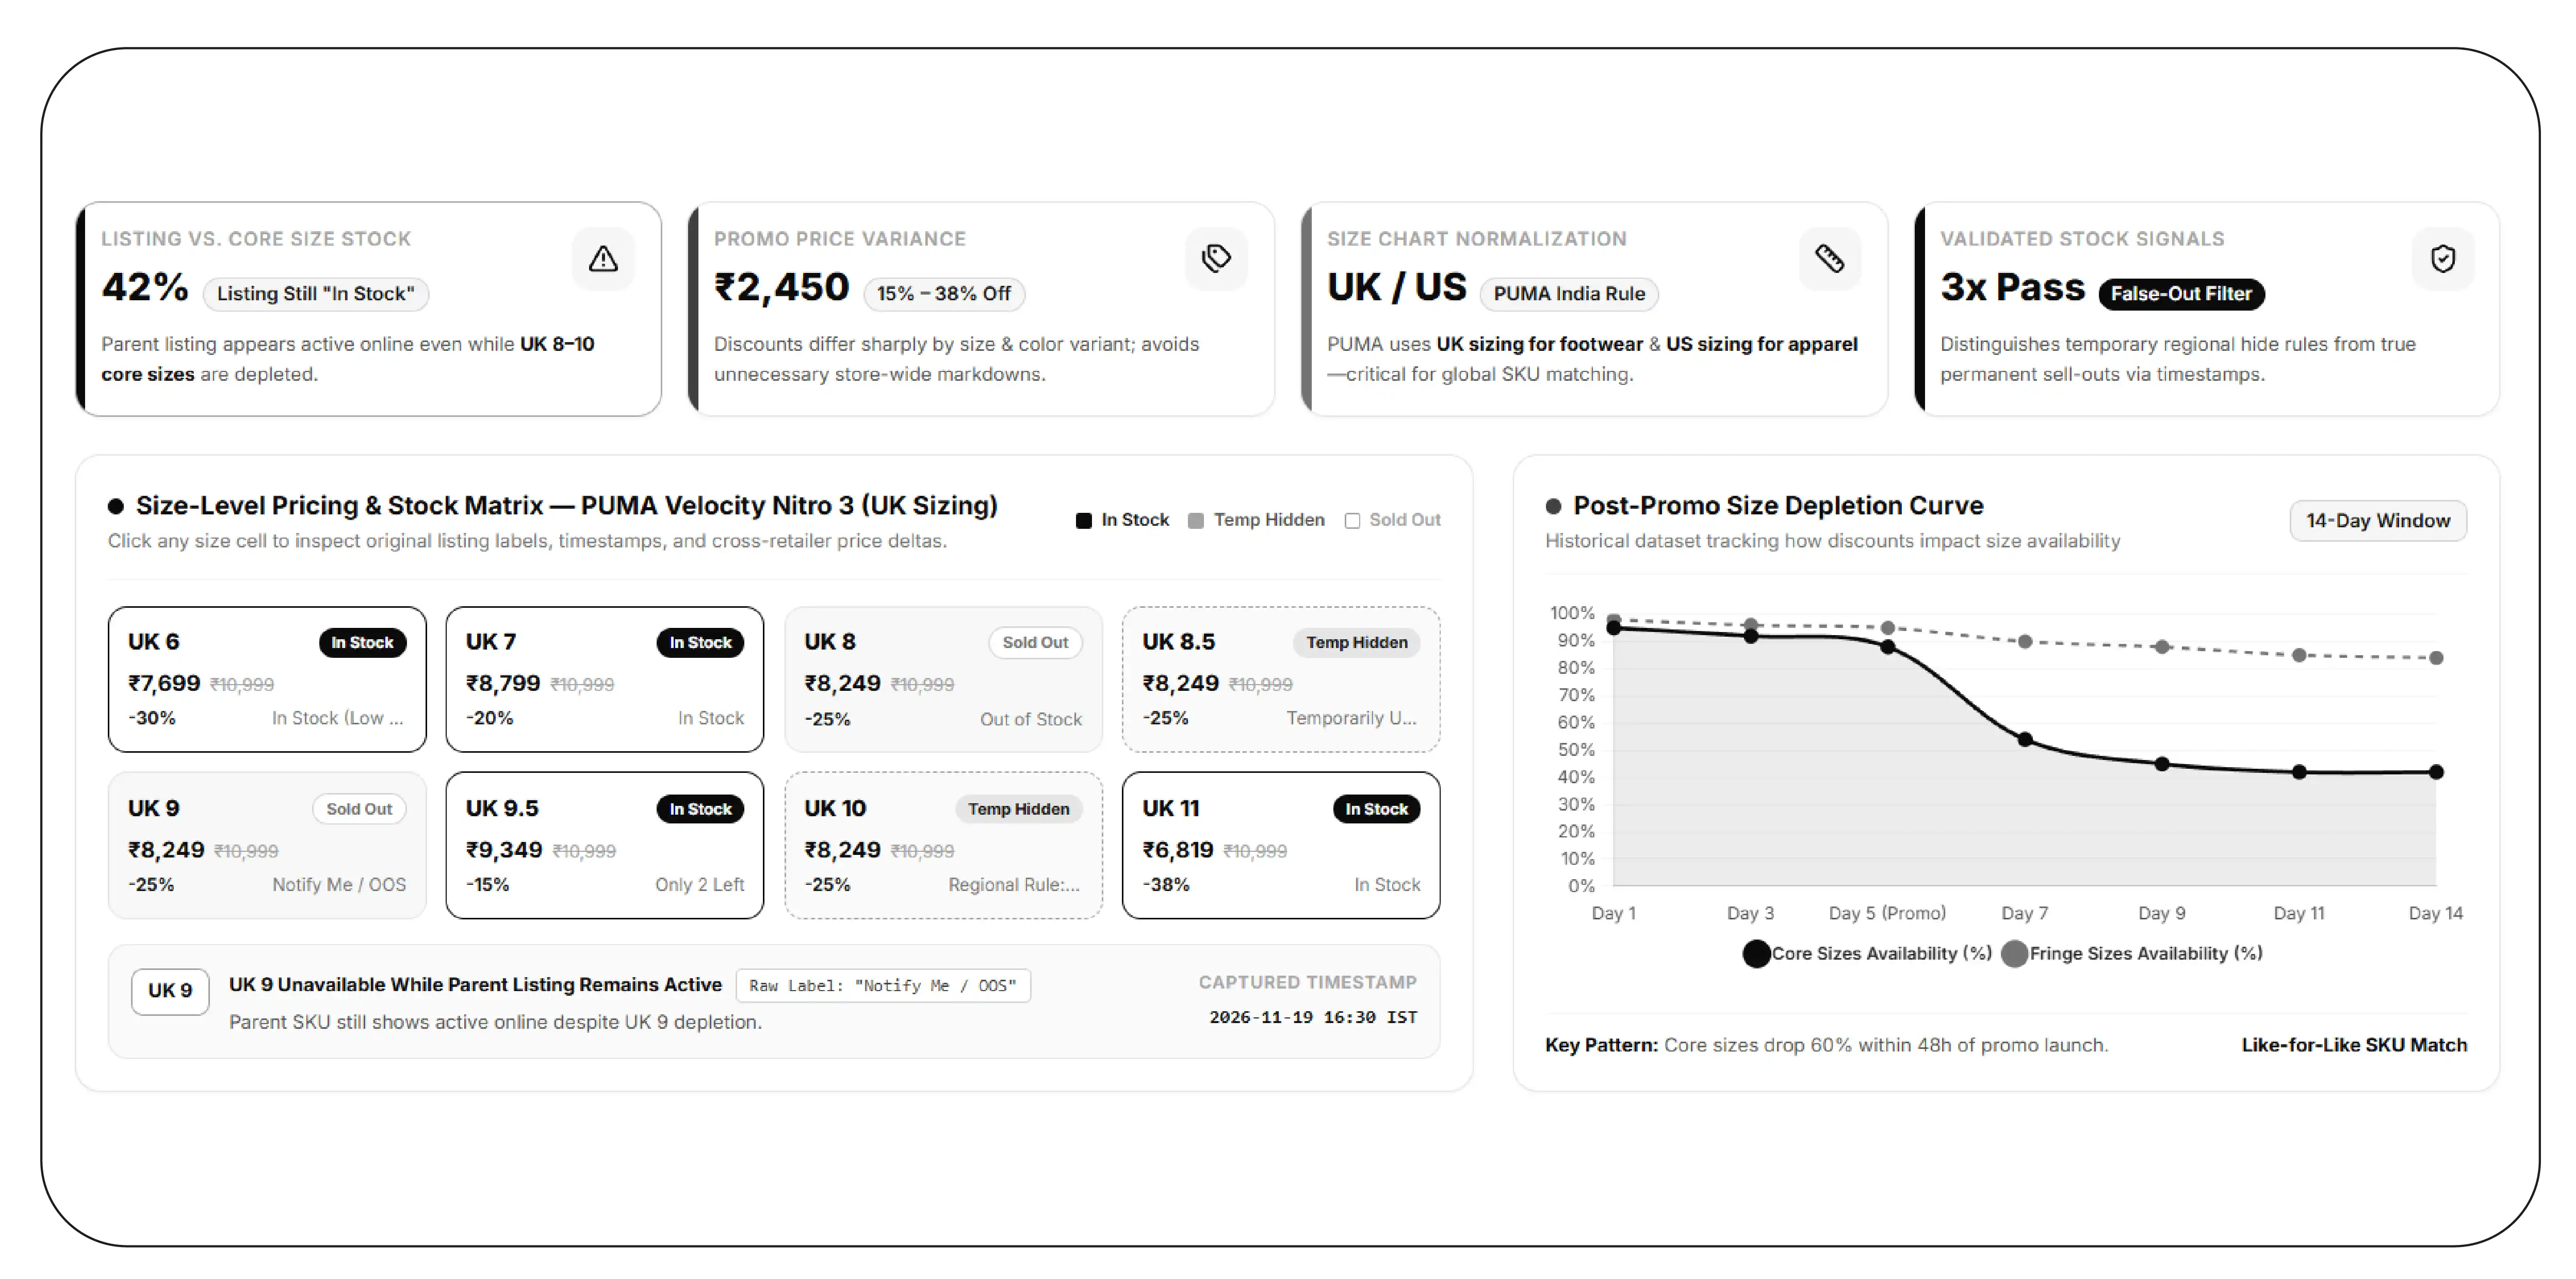
Footwear pricing analysis becomes more useful when retailers can connect price information with individual sizes. A product may remain available online even when its most popular sizes are unavailable. Monitoring only the overall product listing can therefore produce an incomplete picture of market conditions.
Puma Sportswear SKU Price Monitoring provides a way to track price changes at the product and variant level. Retailers can record model identifiers, size options, color variants, current prices, promotional prices, and stock indicators. This makes it possible to compare like-for-like products rather than treating every listing as an identical item.
Puma Product Size and Price Scraping can help organize this information into a historical dataset. Analysts can examine whether particular sizes become unavailable after promotional changes, whether discounts differ between sizes, and whether certain models retain availability across multiple retailers.
An important distinction is that an unavailable size does not necessarily mean that the product has sold out permanently. It may be temporarily unavailable, removed from a regional listing, or displayed differently because of website inventory rules. Retailers should therefore preserve the original availability label and collection timestamp.
PUMA's official India help page explains that product pages provide size charts and that its website uses UK sizing for footwear and US sizing for apparel. This distinction makes size normalization particularly important when comparing international listings.
| Monitoring field | Retail application |
|---|
| Product SKU | Match the same model across retailers |
| Size label | Compare available size options |
| Color variant | Separate individual product variants |
| Original price | Establish the listed reference price |
| Current price | Monitor the displayed selling price |
| Discount | Evaluate promotional differences |
| Availability status | Identify listed stock changes |
| Timestamp | Maintain historical records |
For retailers, size-level monitoring can improve replenishment planning, reduce incorrect product comparisons, and highlight assortment gaps. It also helps pricing teams avoid making broad markdown decisions based on incomplete product availability.
Actionable retailer insight: Build alerts for meaningful price changes and repeated size-availability changes. Validate important stock movements through multiple observations before changing purchasing or pricing decisions.
How Does Product Catalog Information Improve Retail Assortment Planning?
A complete product catalog allows retailers to understand what competitors offer, how their collections are structured, and which product attributes differentiate individual items. For sportswear retailers, this information is valuable when planning category expansions, evaluating product positioning, and maintaining accurate product records.
Puma Clothing Product Catalog Extraction focuses on collecting structured information from publicly accessible product pages. Depending on the information displayed, the dataset can contain product titles, descriptions, model numbers, category names, gender classifications, color options, material descriptions, images, sizes, prices, and product URLs.
The collected information should be organized into consistent fields. For example, different retailers may describe the same product using slightly different names. Matching model numbers and other product identifiers helps analysts identify equivalent products without relying exclusively on product titles.
Catalog extraction also supports comparisons between footwear, running apparel, training clothes, football products, and sports-inspired casualwear. Retailers can examine how competitors distribute products across categories and identify missing attributes in their own catalogs.
PUMA's 2024 annual report provides useful context for understanding its product divisions.
| Product division | 2020 revenue (€ million) | 2024 revenue (€ million) |
|---|
| Footwear | 2,367.6 | 4,733.6 |
| Apparel | 1,974.1 | 2,813.9 |
| Accessories | 892.7 | 1,269.7 |
Source: PUMA Annual Report 2024, product division sales.
These figures demonstrate the scale of PUMA's different product divisions. They do not identify individual product popularity or SKU-level sales.
For retailers, catalog intelligence becomes more valuable when combined with product matching, category classification, and regular data validation. A standardized catalog makes it easier to compare competing products and detect changes in product positioning.
Actionable retailer insight: Maintain a centralized product catalog with consistent category names, model identifiers, size formats, and color attributes. Update it whenever monitored retailers introduce, modify, or remove product listings.
How Can Inventory Intelligence Help Retailers Identify Availability Gaps?
Inventory visibility is a major consideration for footwear retailers because product availability directly influences assortment decisions and the customer shopping experience. A shoe model may be displayed in multiple sizes, but its actual availability can change frequently across retail channels.
Puma Sportswear Inventory Data Scraping helps businesses collect publicly displayed availability indicators for individual products and variants. These records can include product identifiers, color names, available sizes, displayed stock messages, prices, and collection timestamps.
When combined with Puma Product Size and Price Scraping, inventory information can be compared with price histories. This helps retailers investigate whether certain products remain available at full price, whether selected variants appear during promotional periods, and whether competing retailers display different availability patterns.
PUMA's published financial statements provide an example of why inventory monitoring matters at the business level. Its reported inventory increased from €1,804.4 million in 2023 to €2,013.7 million in 2024 and €2,060.0 million in 2025.
The following table separates company-reported inventory from online product availability.
| Reporting period | PUMA reported inventory (€ million) |
|---|
| 2023 year-end | 1,804.4 |
| 2024 year-end | 2,013.7 |
| 2025 year-end | 2,060.0 |
| September 2026 | 1,608.9 |
Source: PUMA Annual Reports 2024 and 2025 and Q3 2026 financial results. September 2026 is a quarterly reporting date, not a year-end figure.
In its Q3 2026 results, PUMA reported that inventories had decreased 24.3% year over year to €1,608.9 million, primarily reflecting lower purchasing volumes.
This illustrates why retailers should distinguish company-level inventory reporting from publicly displayed stock information. A product scraper cannot determine PUMA's complete warehouse inventory from online listings. It can, however, monitor the availability signals displayed by individual retail websites.
Actionable retailer insight: Track size-level availability changes over multiple collection periods. Use repeated observations to identify potential stock gaps, compare retailer assortment coverage, and support replenishment discussions.
How Can Size-Specific SKU Data Support Better Merchandising?
Size-specific product information helps retailers understand how footwear and clothing assortments are presented across online channels. A general product listing may contain several sizes, but each size can have different availability, pricing, or variant information.
Puma Sports Clothing Size SKU Data Scraping allows retailers to organize individual product variants into structured records. These records can include product model, SKU, category, color, size, current price, discount, product URL, and displayed availability.
For footwear retailers, size information is particularly important because sizing systems can differ between markets. PUMA's India website identifies UK sizing for shoes and US sizing for apparel. Retailers comparing international product listings should preserve the original size label and use a separate standardized size field where reliable conversion information is available.
The business value comes from combining size information with price and availability history. Retailers can identify which sizes are consistently listed by competitors, which variants experience repeated availability changes, and where product assortments differ between sales channels.
The latest reported business performance also provides context for these decisions. During the first nine months of 2026, PUMA recorded €5,330.6 million in group sales, including €3,036.2 million from footwear and €1,655.5 million from apparel. These figures represent January–September 2026, not full-year results.
| Product division | January–September 2026 sales (€ million) | Year-on-year currency-adjusted change |
|---|
| Footwear | 3,036.2 | -6.3% |
| Apparel | 1,655.5 | -4.5% |
| Accessories | 638.9 | -5.0% |
| Total group | 5,330.6 | -5.6% |
Source: PUMA Q3 2026 financial results. Figures cover the first nine months of 2026.
These company-level figures cannot reveal which individual sizes or products generated sales. Retailers need product-level observations to understand the online assortment more closely.
A useful SKU dataset should also preserve historical records instead of replacing old observations. This allows pricing teams to compare current listings with earlier snapshots and identify changes in product presentation.
Actionable retailer insight: Connect SKU-level records with pricing dashboards and inventory reports. Use consistent product matching to prevent different colorways or sizing labels from being incorrectly treated as the same variant.
Why Choose Product Data Scrape?
Retailers need accurate, structured information to make informed decisions in competitive footwear and sportswear markets. Sports & Outdoors Data Scraping helps businesses collect product attributes, prices, discounts, sizes, and publicly displayed availability indicators from relevant online sources.
Product Data Scrape supports structured data collection, product matching, data cleaning, and recurring monitoring workflows. Businesses can use these datasets for competitor comparisons, assortment planning, and pricing intelligence.
With Puma Product Size and Price Scraping, retailers can organize product-level information into usable datasets rather than relying on repetitive manual research. The resulting intelligence supports better visibility into competitor activity and changing online product assortments.
Conclusion
Footwear retailers need reliable product intelligence to remain competitive in changing e-commerce markets. Combining product prices, size availability, color variants, and inventory indicators helps businesses understand competitor strategies and improve merchandising decisions.
Effective Price scraping provides historical visibility into product pricing, promotional activity, and assortment changes. With Puma Product Size and Price Scraping, retailers can build structured datasets that support competitive benchmarking, size-level monitoring, and inventory planning.
Partner with Product Data Scrape to transform publicly available product information into actionable retail intelligence. Contact our team today to discuss a customized data collection solution for your footwear and sportswear business!
FAQs
1. What is Puma product data scraping?
It is an automated process for collecting publicly available Puma product information, including prices, sizes, colors, descriptions, discounts, and availability for competitive retail analysis.
2. How does size-level data benefit footwear retailers?
Size-level data helps retailers monitor variant availability, identify assortment gaps, compare competitor listings, and improve replenishment decisions using regularly collected product information.
3. Can retailers monitor Puma prices across multiple websites?
Yes. Product Data Scrape can structure publicly accessible pricing information from selected retail websites, enabling comparisons across sellers, product models, and promotional periods.
4. Which product attributes should retailers collect?
Important attributes include product names, SKUs, categories, colors, sizes, original prices, discounted prices, availability indicators, seller details, product URLs, and collection timestamps.
5. How frequently should product information be collected?
Collection frequency depends on business requirements. Daily or more frequent monitoring can help retailers identify pricing changes, promotional activity, and product availability updates.
6. Reference Sources
The following primary sources support the company-level financial figures and product-sizing information used in this article. PUMA Annual Report 2024 – Product Division Sales and Direct-to-Consumer Performance. PUMA Annual Report 2025 – Sales Performance. PUMA Annual Report 2025 – Consolidated Financial Position. PUMA Q3 2026 – Official Financial Results. PUMA Q3 2026 – Inventory and Working Capital Performance. PUMA India – Official Product Size and Ordering Information.


 Singapore
 EMAIL
 PHONE











.webp)