Introduction
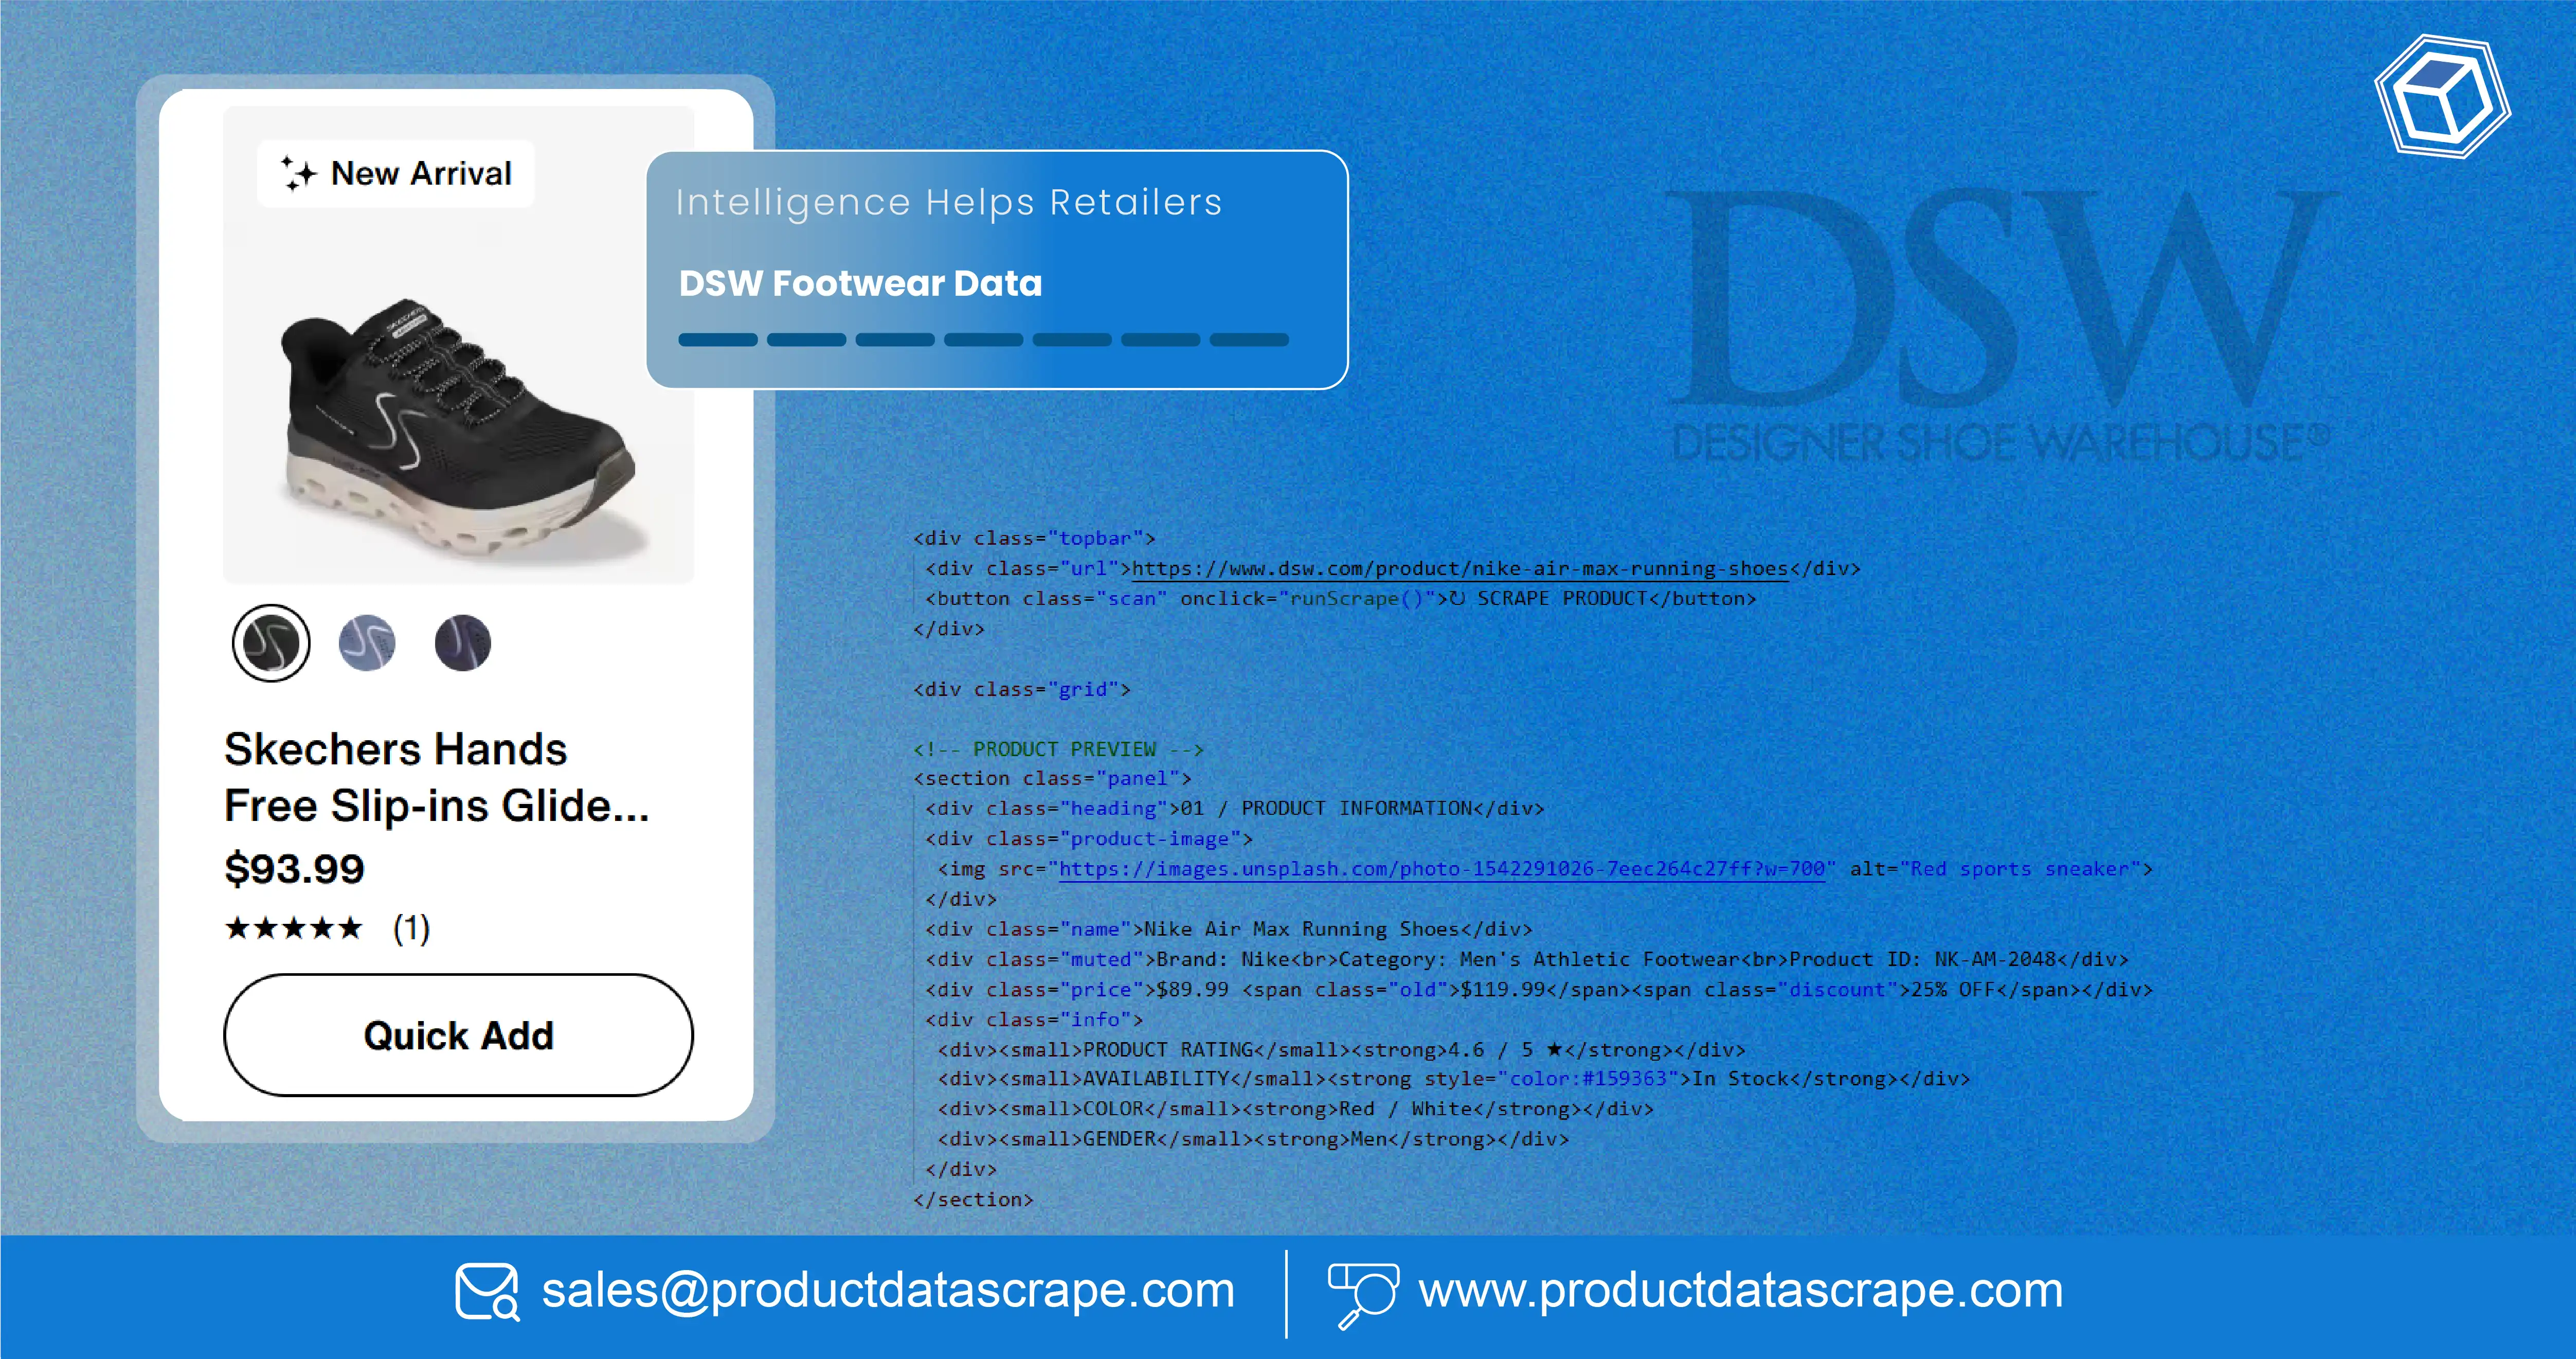
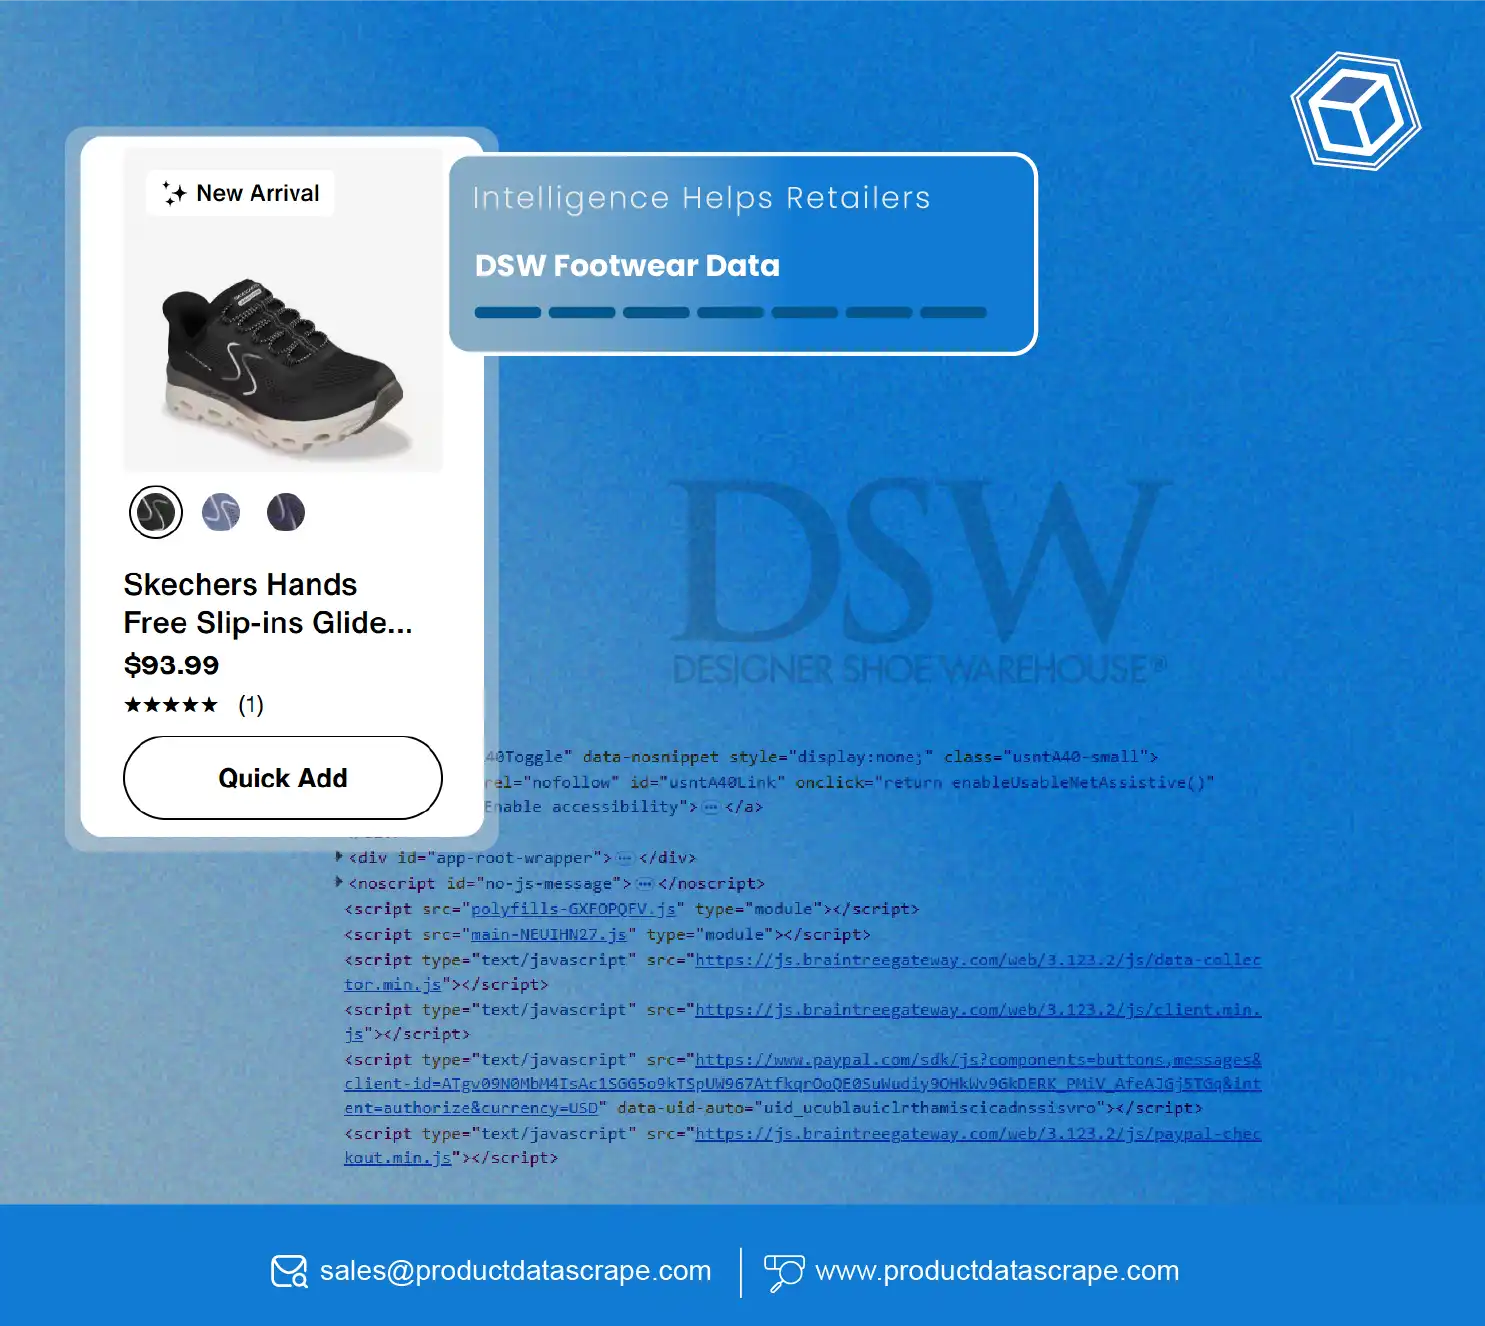
Tracking footwear prices, product sizes, and availability across a large retail catalog requires accurate, continuously updated product information. DSW Product Size and Price Data Scraping helps retailers, footwear brands, marketplace sellers, and market researchers collect structured information about shoe models, size variations, regular prices, discounts, and stock availability from DSW's online product listings. This information supports competitor benchmarking, pricing decisions, assortment planning, and demand analysis.
DSW, or Designer Shoe Warehouse, operates under Designer Brands Inc., which reported 519 DSW stores as of January 31, 2026. Its combination of physical retail and e-commerce creates opportunities for businesses to study footwear assortment and online merchandising. A structured DSW Product Data Scraping API can organize publicly accessible product information into consistent datasets for ongoing analysis.
For footwear businesses, the biggest challenge is not simply discovering product prices. It is understanding how prices and availability differ across individual sizes, brands, categories, and promotional periods. Reliable product-level intelligence makes these differences easier to identify and evaluate.
How Can Retailers Monitor Price Differences Across Individual Shoe Sizes?
Footwear pricing analysis becomes more meaningful when businesses examine individual size variants instead of treating an entire shoe model as one product. A particular shoe may have multiple sizes, but each variant can have different availability. Monitoring these differences helps retailers understand assortment gaps and identify products that require closer competitive attention.
DSW Size-Wise Shoe Price Monitoring enables businesses to collect product names, brand information, size options, displayed prices, promotional prices, product URLs, and availability indicators. Retailers can organize these attributes around product identifiers to understand how individual variants perform across the catalog.
For example, a footwear analyst can compare the displayed price of the same model across different sizes and capture whether a particular size is listed as available or unavailable. The analyst should preserve the collection timestamp because prices and availability can change between observations.
The connection with Retail media and ad intelligence is also important. Product-level information helps brands evaluate the assortment and pricing context surrounding sponsored product placements. The Interactive Advertising Bureau explains that retail media includes advertising near the point of purchase, across online and in-store environments. Its retail media measurement guidelines emphasize consistent measurement and transparent reporting.
Businesses can combine product observations with advertising campaign records to examine whether promoted products remain available in advertised sizes.
Important metrics to monitor include:
- Regular and promotional prices for each product variant.
- Available and unavailable size combinations.
- Discount changes across observation dates.
- Brand-wise assortment coverage.
- Product visibility and sponsored placement information, where publicly accessible.
Historical e-commerce context, 2020–2026
The following figures show the annual average share of US retail sales represented by e-commerce. They provide market context rather than DSW-specific sales or footwear figures.
| Year | E-commerce share |
|---|
| 2020 | 14.5% |
| 2021 | 14.7% |
| 2022 | 14.4% |
| 2023 | 15.3% |
| 2024 | 16.1% |
| 2025 | 16.4% |
| 2026* | 17.1% |
*2026 represents the reported first two quarters, not a full-year average. Source: US Census Bureau data compiled through FRED.
This growth in online retail makes variant-level product information increasingly relevant to footwear businesses. Rather than relying on occasional manual checks, retailers can use timestamped observations to understand changing price and size availability patterns.
Which Product Attributes Should Businesses Collect for Better Catalog Analysis?
A footwear catalog contains more information than product names and selling prices. Brands, categories, materials, colors, size systems, descriptions, images, and product identifiers all contribute to accurate product matching and comparison.
DSW Product Attribute and Pricing Dataset collection helps businesses consolidate these details into standardized records. A structured dataset makes it easier to compare products, identify missing attributes, and understand assortment differences between brands.
For example, footwear businesses may want to distinguish between athletic shoes, casual sneakers, formal shoes, sandals, boots, and specialized footwear. Capturing product categories alongside size and price information helps analysts compare similar products instead of combining unrelated items.
The need for standardized information is also reflected in Google's product-data requirements. Google Merchant Center identifies product attributes such as size, availability, price, and identifiers as important components of product feeds. Its official product data specification explains that different size variants should be represented separately and connected through an item group identifier.
This provides a useful reference for businesses designing their own catalog structures.
Catalog Enrichment Services can help organize collected product information into standardized fields, normalize brand names, clean inconsistent descriptions, and identify incomplete records.
A practical footwear dataset can contain the following attributes:
| Attribute | Business application |
|---|
| Product ID or SKU | Product identification |
| Product name | Catalog classification |
| Brand | Brand-level benchmarking |
| Category | Assortment analysis |
| Size | Variant-level comparison |
| Color | Product differentiation |
| Regular price | Base-price tracking |
| Sale price | Promotional analysis |
| Availability | Stock-status monitoring |
| Product URL | Source verification |
| Image URL | Visual product matching |
| Collection timestamp | Historical comparison |
The most important step is maintaining consistent identifiers. If the same shoe appears in multiple listings or categories, product matching rules should prevent duplicate records.
Businesses should also retain original source values alongside normalized values. This allows analysts to review how a product was originally described and identify potential errors introduced during standardization.
The result is a more useful footwear catalog that supports competitive research, product discovery, pricing analysis, and merchandising decisions.
How Does SKU-Level Tracking Improve Footwear Price Benchmarking?
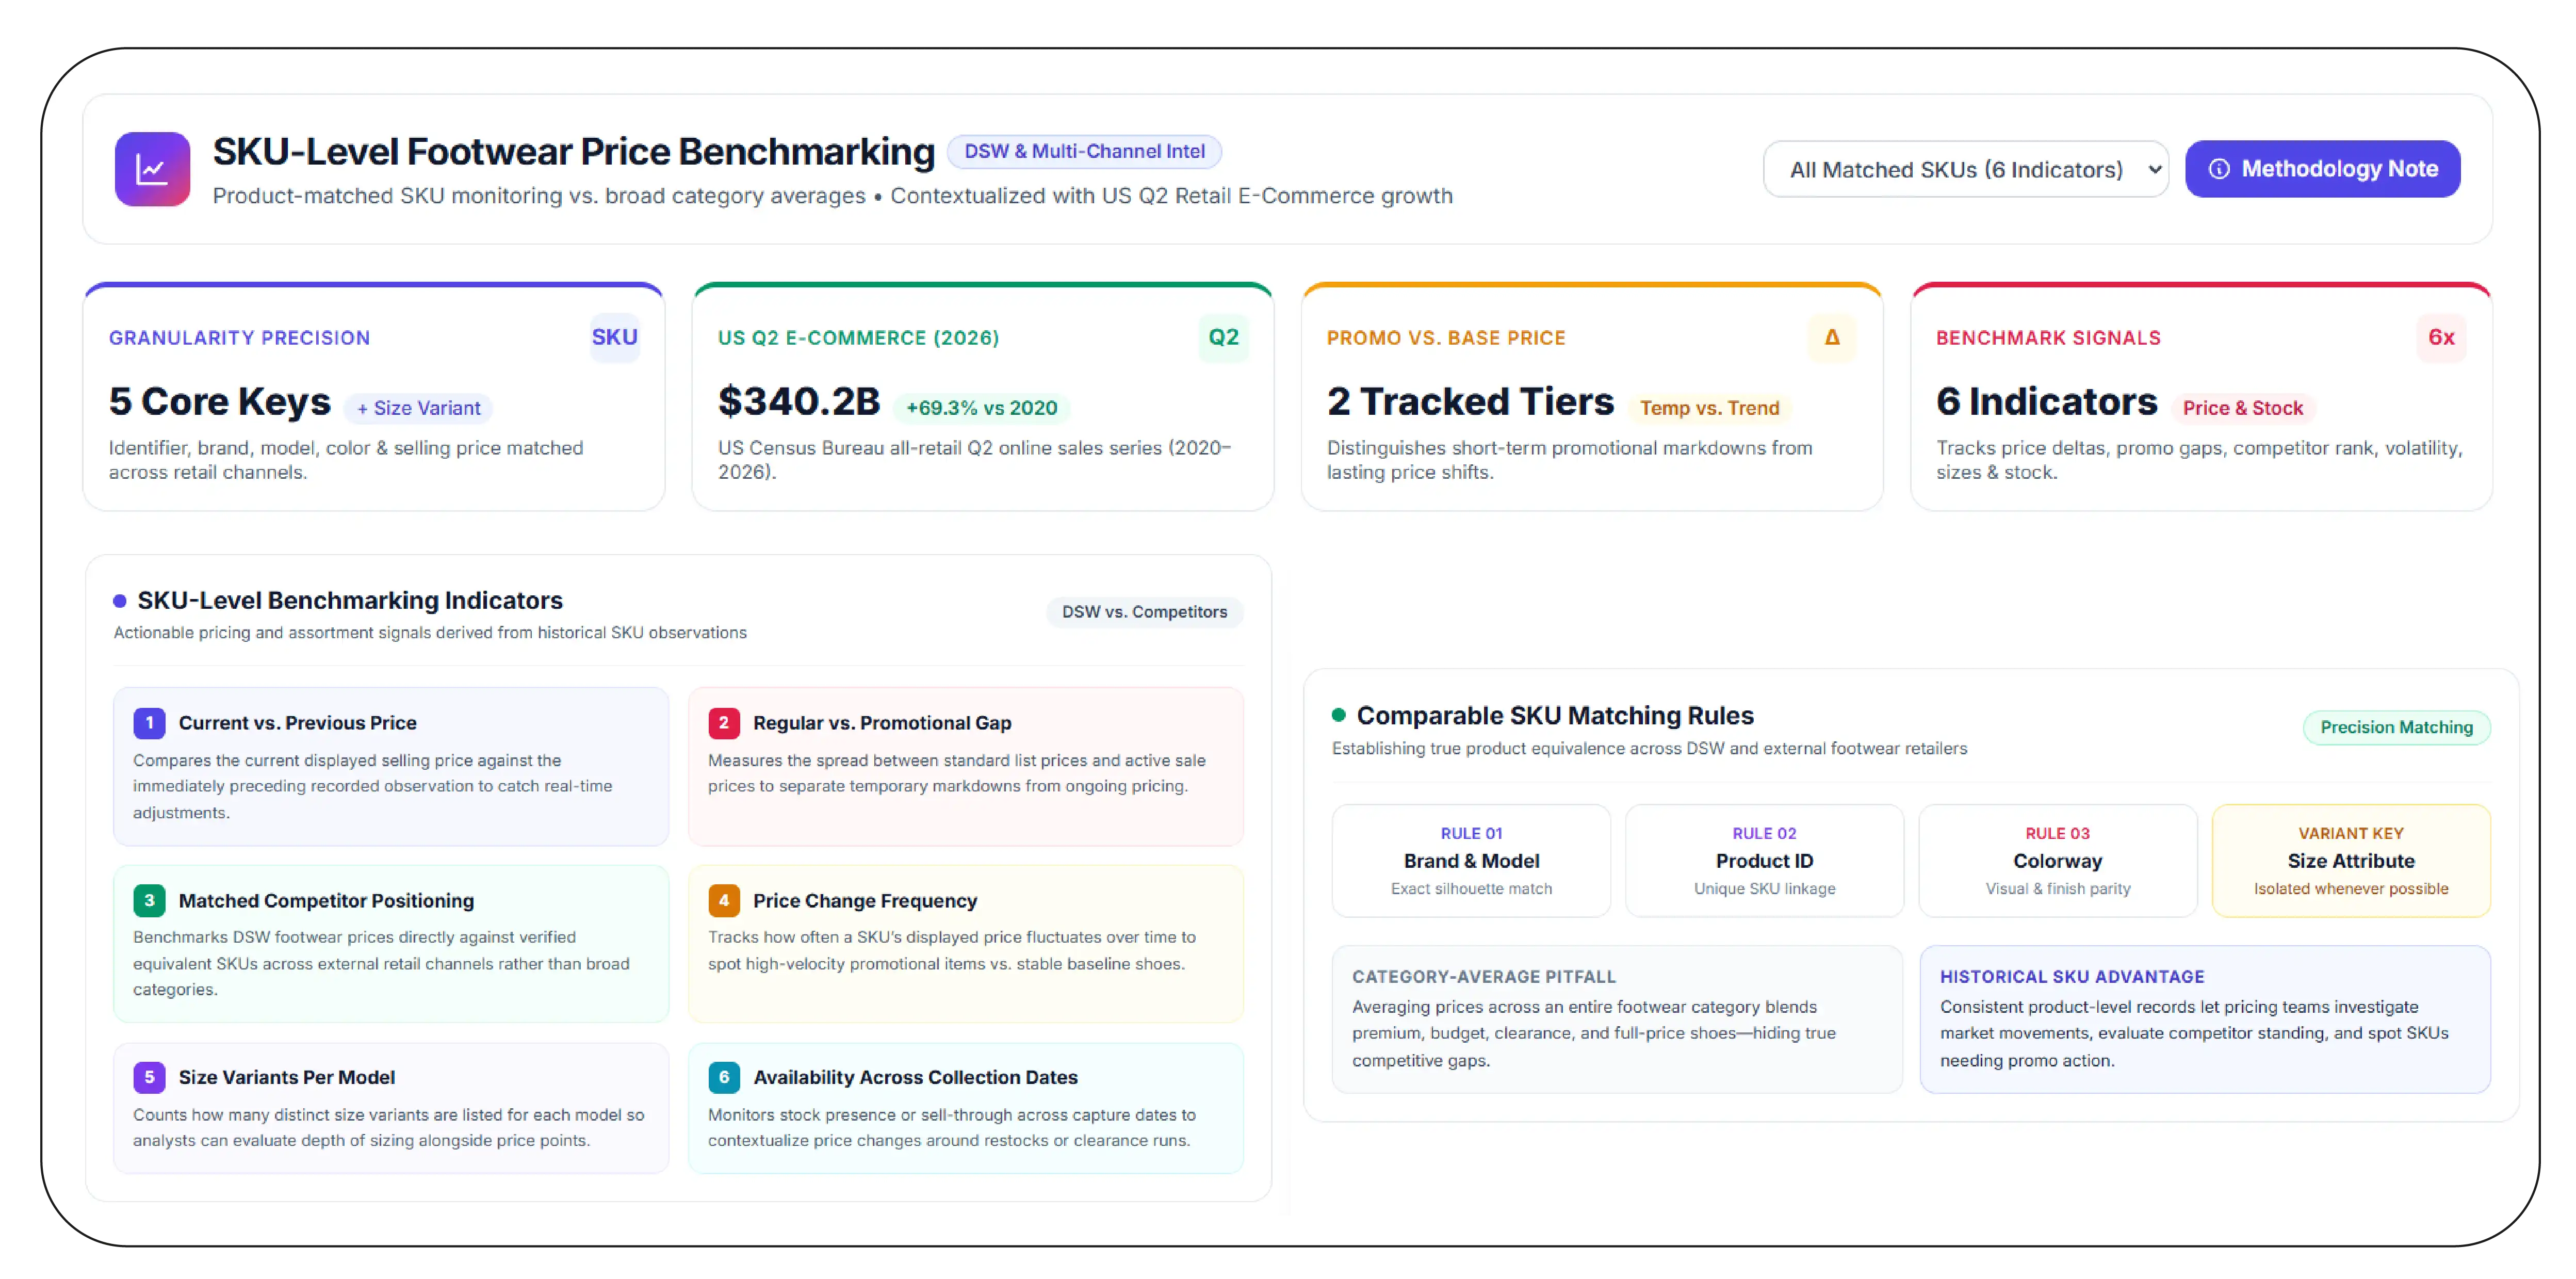
Footwear retailers often compete across overlapping brands, product categories, and price ranges. Comparing only category-level average prices can hide important differences between individual products. SKU-level monitoring provides a more detailed view by connecting each product to its unique identifier, brand, model, size, and observed selling price.
Footwear Retail SKU-Level Price Monitoring helps businesses evaluate how DSW-listed footwear compares with similar products available through other retail channels. The objective is to establish comparable product records rather than compare unrelated shoes simply because they belong to the same category.
With Competitive pricing data, analysts can examine regular prices, sale prices, promotional changes, and historical observations. They can also identify products whose displayed prices change frequently and distinguish temporary promotions from longer-term pricing patterns.
For meaningful comparisons, businesses should establish matching rules based on brand, model name, product identifier, color, and other available attributes. Size should be treated as a separate variant attribute wherever possible.
Useful SKU-level benchmarking indicators include:
- Current displayed price compared with the previous recorded price.
- Difference between regular and promotional prices.
- Price positioning against matched competitor products.
- Frequency of observed price changes.
- Number of size variants listed for each model.
- Availability changes across collection dates.
US e-commerce sales provide additional context for digital retail analysis.
| Year | Q2 e-commerce sales |
|---|
| 2020 | $200.9 billion |
| 2021 | $228.9 billion |
| 2022 | $240.5 billion |
| 2023 | $260.9 billion |
| 2024 | $278.3 billion |
| 2025 | $304.2 billion |
| 2026 | $340.2 billion |
Source: US Census Bureau quarterly retail e-commerce series. Figures are rounded; see FRED historical data and the Census Bureau release. These are all-retail figures, not DSW footwear sales.
The table demonstrates the increasing scale of US online commerce. For footwear businesses, this reinforces the value of maintaining consistent product-level observations. A historical SKU dataset can help pricing teams investigate market movements, assess competitor positioning, and identify products that may require promotional adjustments.
What Can Continuous Product Listing Analysis Reveal About DSW?
Product listings provide a valuable view of how a retailer presents its assortment to online shoppers. However, listings are dynamic. New products appear, existing products receive updated descriptions, promotional prices change, and certain variants may become unavailable.
DSW Product Listing Monitoring helps businesses capture these changes through scheduled observations of publicly accessible product pages and category listings. Instead of depending on occasional manual research, analysts can maintain structured records of product information across multiple collection dates.
A properly designed DSW Product Size and Price Data Scraping workflow can collect:
- Product titles, brand names, and descriptions.
- Product category and subcategory information.
- Available shoe sizes and color variants.
- Regular prices and displayed discounts.
- Product images and listing URLs.
- Availability indicators and collection timestamps.
The collected information can then be compared across observation periods. For instance, analysts can identify newly appearing products, changes in displayed prices, modified product descriptions, and differences in listed size options.
A particularly useful approach is maintaining a historical snapshot rather than overwriting previous records. This allows businesses to investigate when a price changed and whether an availability indicator differed from an earlier observation.
What should a listing-monitoring dataset contain?
| Monitoring field | What it reveals |
|---|
| Product title | Product identification |
| Brand and category | Assortment composition |
| Product URL | Listing reference |
| Original price | Displayed base price |
| Current price | Current selling price |
| Discount information | Promotional positioning |
| Size variants | Size assortment |
| Availability status | Listing availability |
| Timestamp | Historical comparison |
Businesses should also distinguish between a product being unavailable in a particular size and the entire product listing being removed. These represent different commercial situations and should not be combined into one status.
For market researchers, these observations can support assortment comparisons and product trend investigations. For footwear brands, they can help identify changes in retail presentation and pricing.
The collection process should respect applicable website terms, access restrictions, and technical controls. Data validation is equally important because temporary page errors should not automatically be classified as product removals or stockouts.
How Can Stock-Level Observations Support Better Footwear Inventory Decisions?
Footwear inventory management requires more than knowing which products appear in an online catalog. Businesses also need to understand whether specific sizes are currently listed as available and how those observations change over time.
Retail DSW Footwear Stock Scraping focuses on collecting publicly displayed product availability information across shoe models, sizes, and categories. This information can help footwear retailers identify potential assortment gaps and understand which variants require further investigation.
Combining availability observations with DSW Product Size and Price Data Scraping gives businesses a broader view of the relationship between product pricing and listed stock status.
For example, an analyst might examine whether a product's displayed promotional price coincides with changes in its listed size availability. Such observations can help identify patterns worth investigating, although they do not independently establish why a product became unavailable.
Important inventory indicators include:
- Number of sizes displayed for each product.
- Sizes currently marked as available.
- Sizes marked unavailable or out of stock.
- Changes in availability between collection dates.
- Products that disappear from category listings.
- Price and discount information associated with each observation.
A useful inventory dataset should preserve both product-level and variant-level records. Product-level information identifies the overall footwear model, while variant-level information records the individual size and color combination.
| Data level | Example fields | Analytical purpose |
|---|
| Product | Brand, model, category | Assortment analysis |
| Variant | Size, color, SKU | Size-level tracking |
| Pricing | Regular price, sale price | Price comparison |
| Availability | Displayed status | Stock observation |
| Historical | Timestamp, previous status | Change detection |
The wider retail industry also provides useful context. Designer Brands Inc.'s fiscal 2025 reporting disclosed inventory of approximately $563.5 million at January 31, 2026, compared with $599.8 million at February 1, 2025. These figures cover the consolidated company, not DSW alone. They illustrate why inventory remains an important financial consideration for footwear retailers. The figures are available in the company's SEC-filed financial results.
Businesses should avoid interpreting a single unavailable-size observation as proof of a permanent stockout. A product page may be temporarily unavailable, an inventory feed may be delayed, or a website may not display complete store-level information.
Repeated observations, validation checks, and clear status definitions make the resulting inventory intelligence more dependable.
How Can a Structured Shoe Catalog Help Businesses Understand Market Trends?
A structured footwear catalog enables businesses to examine the market beyond individual prices and availability changes. It creates a consistent foundation for studying brand representation, category distribution, product variety, and assortment positioning.
DSW Shoe Catalog Scraping helps businesses collect publicly accessible product information across relevant footwear categories. When the collected records are standardized, analysts can compare products by brand, model, size, category, and price range.
Combining catalog information with DSW Product Size and Price Data Scraping makes it possible to examine how the assortment changes across different observation periods.
For example, footwear brands can investigate which categories have a wider product selection, whether certain brands appear across multiple footwear segments, and how listed prices differ between comparable products. These findings can contribute to assortment planning and competitive research.
A structured catalog can also support:
- Brand intelligence: Understanding the brands represented in different footwear categories.
- Category analysis: Comparing sneakers, boots, sandals, formal shoes, and other product groups.
- Price segmentation: Organizing products by their displayed price ranges.
- Product discovery: Identifying newly observed listings and product variants.
- Catalog consistency: Detecting missing descriptions, inconsistent naming, and duplicate records.
- Historical research: Comparing assortment observations across different dates.
How should businesses organize historical observations from 2020 to 2026?
| Period | Recommended research focus |
|---|
| 2020 | Online assortment and digital retail changes |
| 2021 | Product catalog expansion and category coverage |
| 2022 | Price normalization and promotional comparisons |
| 2023 | Brand and product assortment benchmarking |
| 2024 | Variant-level catalog consistency |
| 2025 | Historical pricing and availability comparisons |
| 2026 | Current catalog and competitive positioning |
This is a recommended research framework, not a dataset of verified historical DSW listings. Historical DSW product records must be obtained from dated, verifiable observations.
Businesses should not assume that current product pages provide complete historical information. A reliable historical dataset requires archived observations, authorized data sources, or previously collected records with timestamps.
For analysts, the greatest benefit of a structured catalog is the ability to connect product attributes with pricing and availability information. This produces a more complete view of footwear assortment changes and supports evidence-based retail decisions.
Why Choose Product Data Scrape?
Footwear businesses need dependable product intelligence to make informed decisions about assortment, pricing, and availability. Product Data Scrape provides structured data collection solutions that help businesses organize complex retail information into usable datasets. Its services can support Sports data requirements, including footwear catalog research, product attribute extraction, size-level observations, and competitive benchmarking. Data validation, product matching, duplicate detection, and customized delivery formats help make collected information easier to integrate into business workflows. Companies can use these datasets for market research, competitor analysis, inventory investigations, and pricing strategy development while maintaining a consistent approach to historical data management.
Conclusion
Footwear retailers need accurate product information to understand changing prices, size availability, and competitive assortment positioning. Price monitoring combined with structured product catalog analysis helps businesses identify pricing movements, compare product variants, and investigate potential inventory gaps. A consistent DSW Product Size and Price Data Scraping strategy can turn publicly accessible product information into actionable retail intelligence.
The right data collection workflow should prioritize accuracy, historical tracking, standardized attributes, and reliable validation.
Ready to strengthen your footwear market research? Contact Product Data Scrape today to discuss customized product, pricing, and size-level data extraction solutions for your business!
FAQs
1. What is DSW product data scraping?
It is the structured collection of publicly accessible DSW product information, including shoe brands, descriptions, sizes, displayed prices, discounts, product URLs, and availability indicators for market research.
2. Why is shoe size-level price monitoring important?
It helps retailers compare individual product variants, understand size availability differences, monitor displayed prices, and improve footwear assortment and competitive pricing decisions.
3. Can businesses track DSW discounts and price changes?
Yes. Timestamped product observations can help businesses compare regular prices, promotional prices, and displayed discounts across collection periods and identify changes requiring further investigation.
4. Which information can a footwear dataset contain?
A footwear dataset can include product identifiers, brand names, categories, descriptions, sizes, colors, regular prices, sale prices, availability indicators, image links, and collection timestamps.
5. How can Product Data Scrape support footwear businesses?
Product Data Scrape can help businesses collect, standardize, validate, and organize footwear product information into structured datasets for competitor benchmarking, catalog analysis, and pricing research.
6. Source and Data References
The following primary and industry sources support the factual information used in this blog:
7. Designer Brands Inc. – SEC Annual Report
8. Designer Brands Inc. – Fiscal 2025 Financial Results
9. US Census Bureau – Quarterly Retail E-Commerce Sales
10. Federal Reserve Bank of St. Louis – E-commerce Retail Sales
11. Google Merchant Center – Product Data Specification
12. Interactive Advertising Bureau – Retail Media Measurement Guidelines


 Singapore
 EMAIL
 PHONE











.webp)