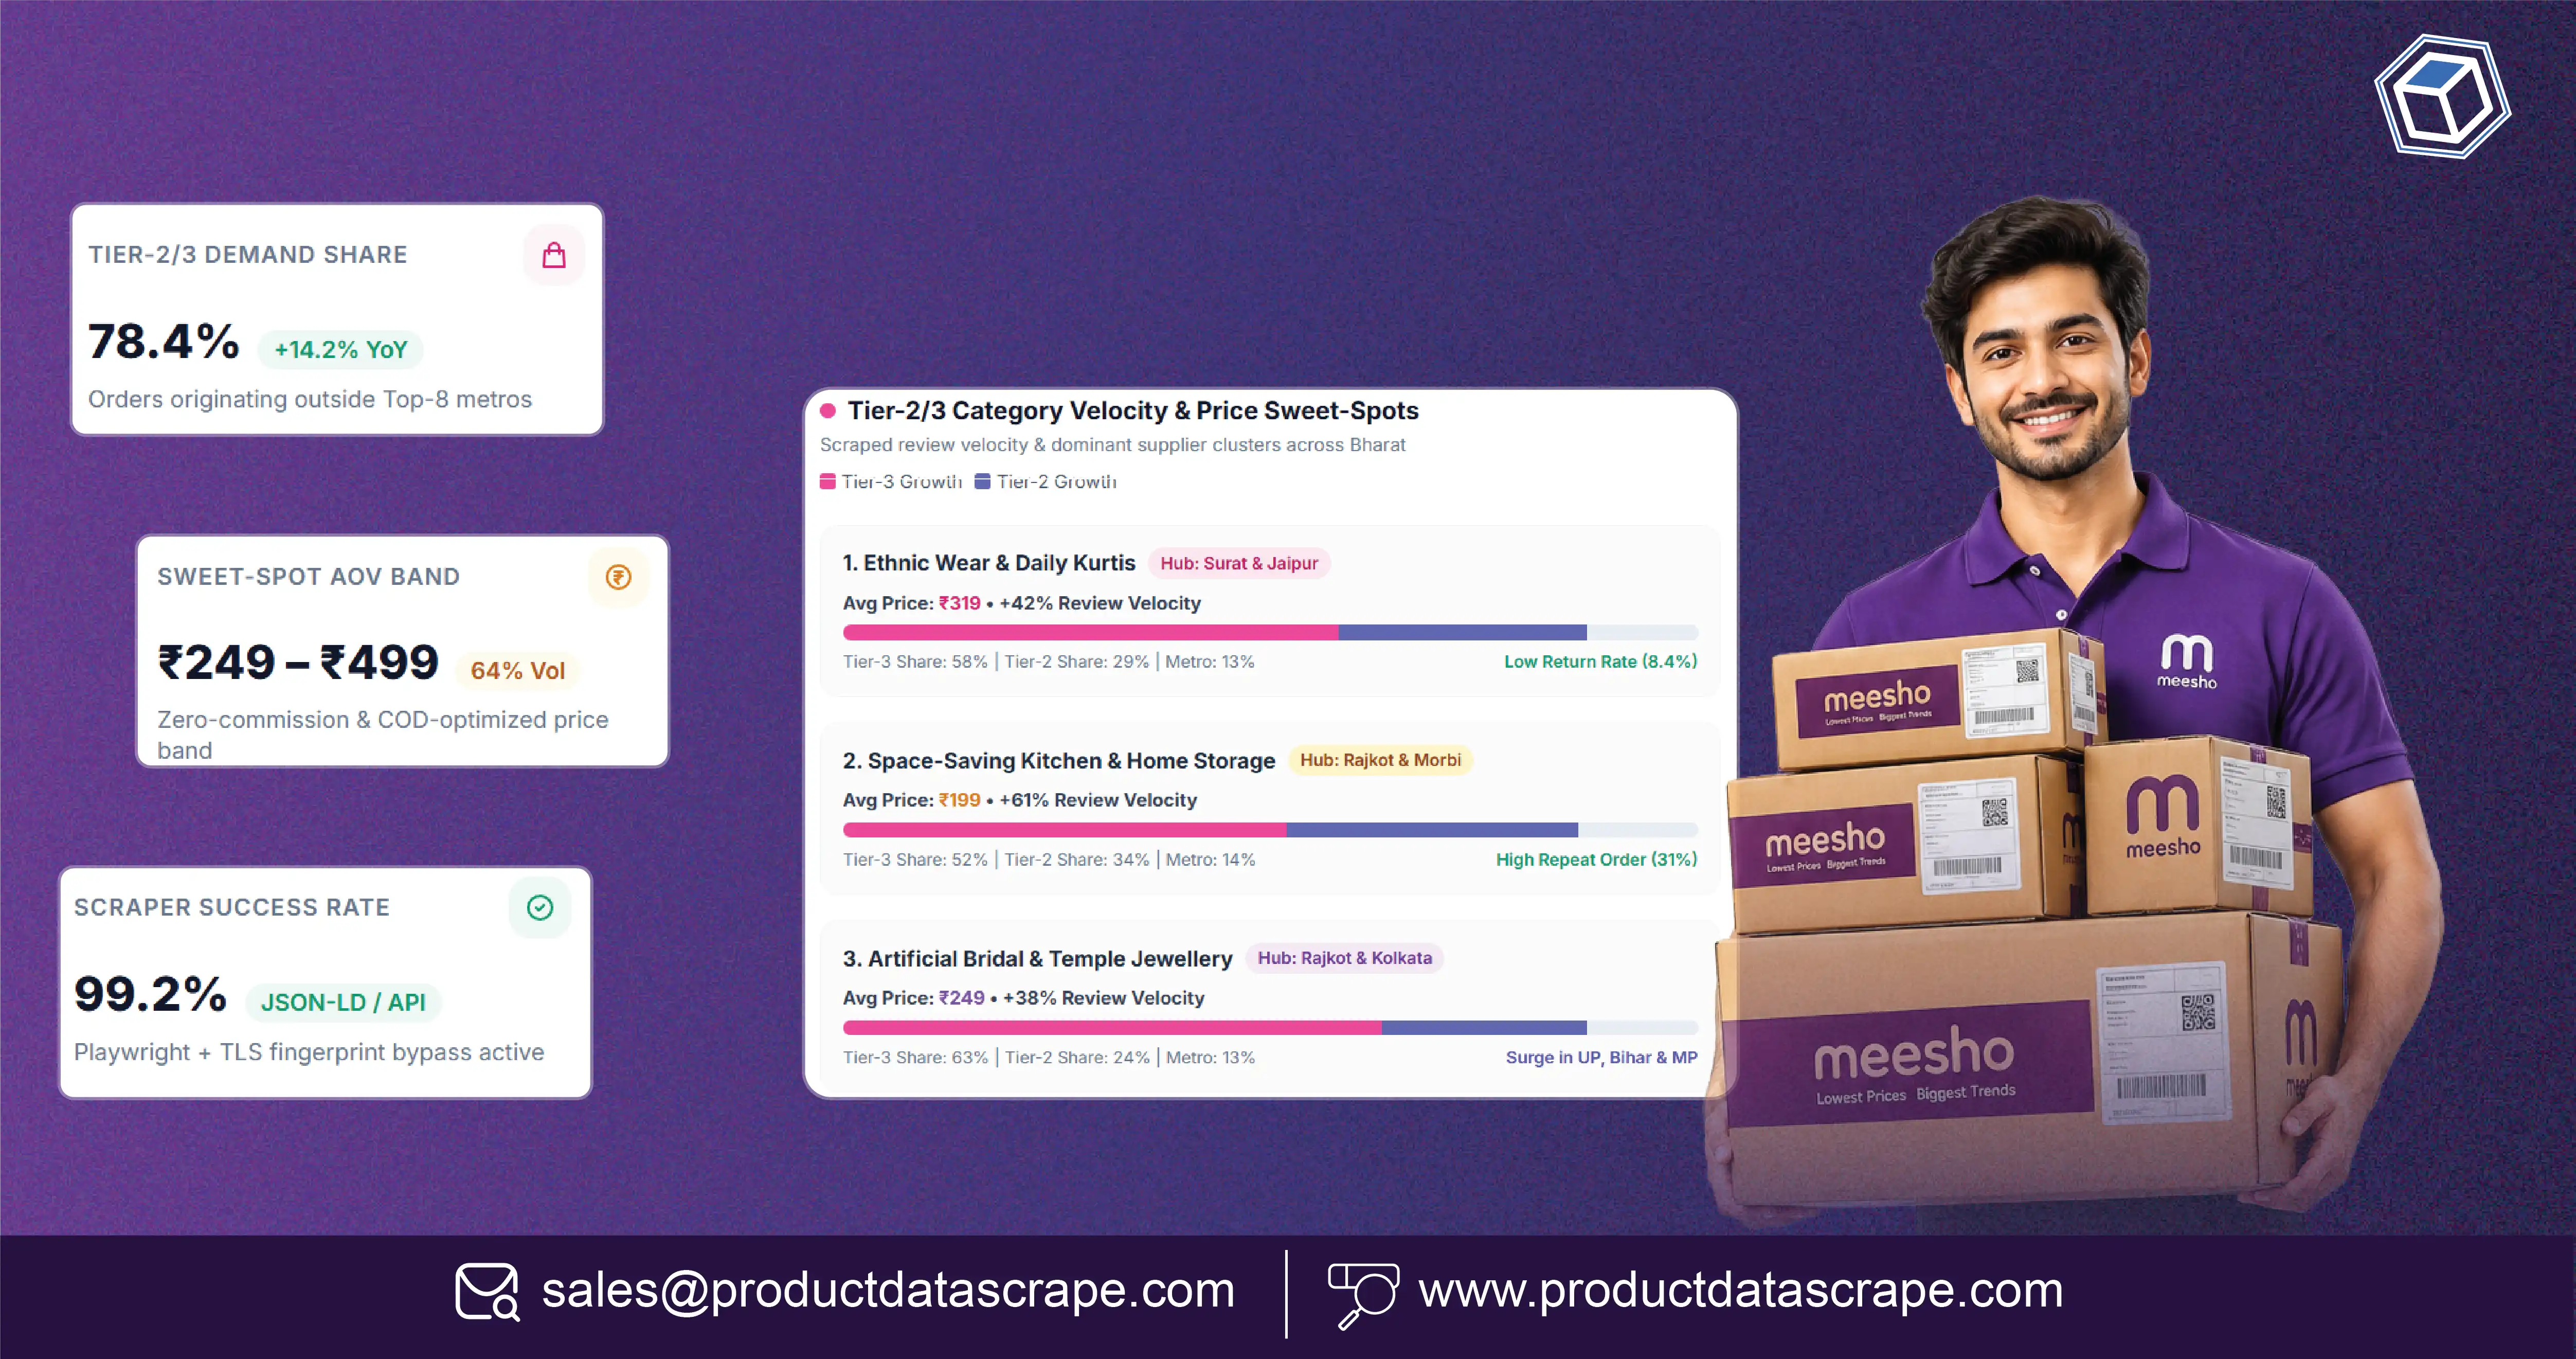
Introduction
To understand India's expanding social-commerce market, businesses need structured information about product listings, seller activity, pricing, ratings, and availability across different regions. Scrape Meesho Seller & Product Data to identify emerging sellers, compare product prices, monitor marketplace competition, and understand demand patterns across Tier-2 and Tier-3 markets.
Meesho is an important platform to study because its marketplace connects consumers and sellers across a broad range of product categories. Its FY2025 prospectus reports 198.77 million annual transacting users and 513,757 annual transacting sellers. These figures demonstrate the scale of the marketplace and the value of structured seller and product intelligence. Meesho prospectus.
For retailers, brands, marketplace analysts, and e-commerce research teams, a structured Meesho Product Data Scraping API workflow can help organize publicly accessible product information into usable datasets. This article explains how to approach seller tracking, regional comparisons, price monitoring, product availability analysis, and data validation using verified market evidence.
How Can Businesses Identify Pricing Opportunities Across Smaller Indian Markets?
Price intelligence helps e-commerce businesses understand how sellers position similar products, where discounts are concentrated, and which product categories offer competitive opportunities. Meesho's value-focused marketplace makes pricing analysis particularly relevant for brands targeting budget-conscious shoppers.
The company's FY2025 prospectus reported an average order value (AOV) of ₹274.27, compared with ₹298.36 in FY2024 and ₹336.71 in FY2023. This decline, alongside increasing order volumes, provides useful context for studying affordability and product pricing.
A structured Tier-2/3 India Marketplace Price Intelligence workflow should capture product selling prices, displayed discounts, category information, seller identifiers, and collection timestamps. Businesses can compare similar products across sellers rather than relying on broad category averages.
The following table presents Meesho's disclosed marketplace performance from FY2020 through FY2025 and its separately reported September 2026 trailing-twelve-month figures.
| Reporting period | Annual transacting users | Placed orders |
|---|
| FY2020 | 2.46 million | 39.64 million |
| FY2021 | 12.06 million | 119.47 million |
| FY2022 | 109.59 million | 610.40 million |
| FY2023 | 136.40 million | 1,024.34 million |
| FY2024 | 155.64 million | 1,341.94 million |
| FY2025 | 198.77 million | 1,834.40 million |
| LTM September 2026 | 284 million+ | 2.95 billion+ |
Sources: Meesho prospectus and investor relations. LTM September 2026 is a trailing-twelve-month measure, not a fiscal-year result.
For pricing analysts, the Meesho dataset should preserve historical prices separately from current listing prices. This makes it possible to identify discount changes, recurring price movements, and differences between sellers without confusing temporary promotional pricing with normal selling prices.
Product Data Scrape can organize these records into category-wise and seller-wise reports for pricing research.
Why Should Businesses Monitor Seller Activity Across Different Regions?
Seller intelligence helps businesses identify emerging competitors, understand marketplace participation, and discover sellers operating in different product categories. Tracking seller activity is especially useful when businesses want to expand beyond India's largest metropolitan markets.
Meesho's prospectus provides a useful historical picture of seller participation.
| Financial year | Annual transacting sellers |
|---|
| FY2023 | 449,966 |
| FY2024 | 423,749 |
| FY2025 | 513,757 |
These figures represent sellers who successfully received at least one order during the relevant trailing twelve-month period.
A structured Meesho Marketplace Seller Tracking process can capture publicly available seller identifiers, product counts, category associations, listing activity, displayed prices, and seller-related listing information.
For businesses building Marketplace & Seller Intelligence, useful monitoring indicators include:
- Seller activity across product categories.
- Changes in the number of visible product listings.
- Price differences between competing sellers.
- New product introductions and listing removals.
- Seller participation across regional markets, where location information is available.
One important distinction is that a seller's registered address does not necessarily indicate where its customers are located. Businesses should therefore maintain separate fields for seller location, product delivery coverage, and customer-market geography.
The FY2025 seller count also shows why historical seller tracking matters: marketplace participation can change from one financial year to another. A single snapshot cannot explain whether a seller is newly active, consistently expanding, or reducing its catalog.
For market research teams, seller-level historical records provide a stronger basis for understanding competitive movement than isolated product searches.
How Can Product Listings and Availability Changes Be Monitored?
Product availability monitoring helps retailers understand whether products remain listed, disappear from search results, or show changes in their displayed availability. It also helps identify category-level assortment changes and potential gaps in competitor catalogs.
Meesho Product Data Scraping API workflows can organize relevant product information into a consistent structure. The extraction process should capture:
- Product title and listing identifier.
- Brand and product category, where provided.
- Displayed selling price and discount.
- Product rating and review count, where available.
- Seller identifier and listing URL.
- Displayed stock or availability status, where available.
- Collection date and time.
A carefully designed Meesho Product Availability Data Scraping workflow should distinguish between a product that is unavailable, a listing that has disappeared, and a product that simply cannot be retrieved during a particular collection attempt.
For businesses looking to Scrape Meesho Seller & Product Data, repeated observations are more useful than individual snapshots. A product that appears unavailable in one collection should be checked again before it is classified as a confirmed stockout.
Meesho's prospectus provides an additional indicator of catalog scale: the platform hosted 109.65 million daily active product listings during the six months ended September 30, 2024, increasing to 153.72 million during the six months ended September 30, 2025. These are company-reported listing counts, not unique product or inventory-unit counts.
| Reporting period | Daily active product listings |
|---|
| Six months ended September 2024 | 109.65 million |
| Six months ended September 2025 | 153.72 million |
This information makes historical catalog monitoring particularly valuable for businesses studying assortment expansion and listing activity.
How Do Regional Differences Influence Marketplace Research?
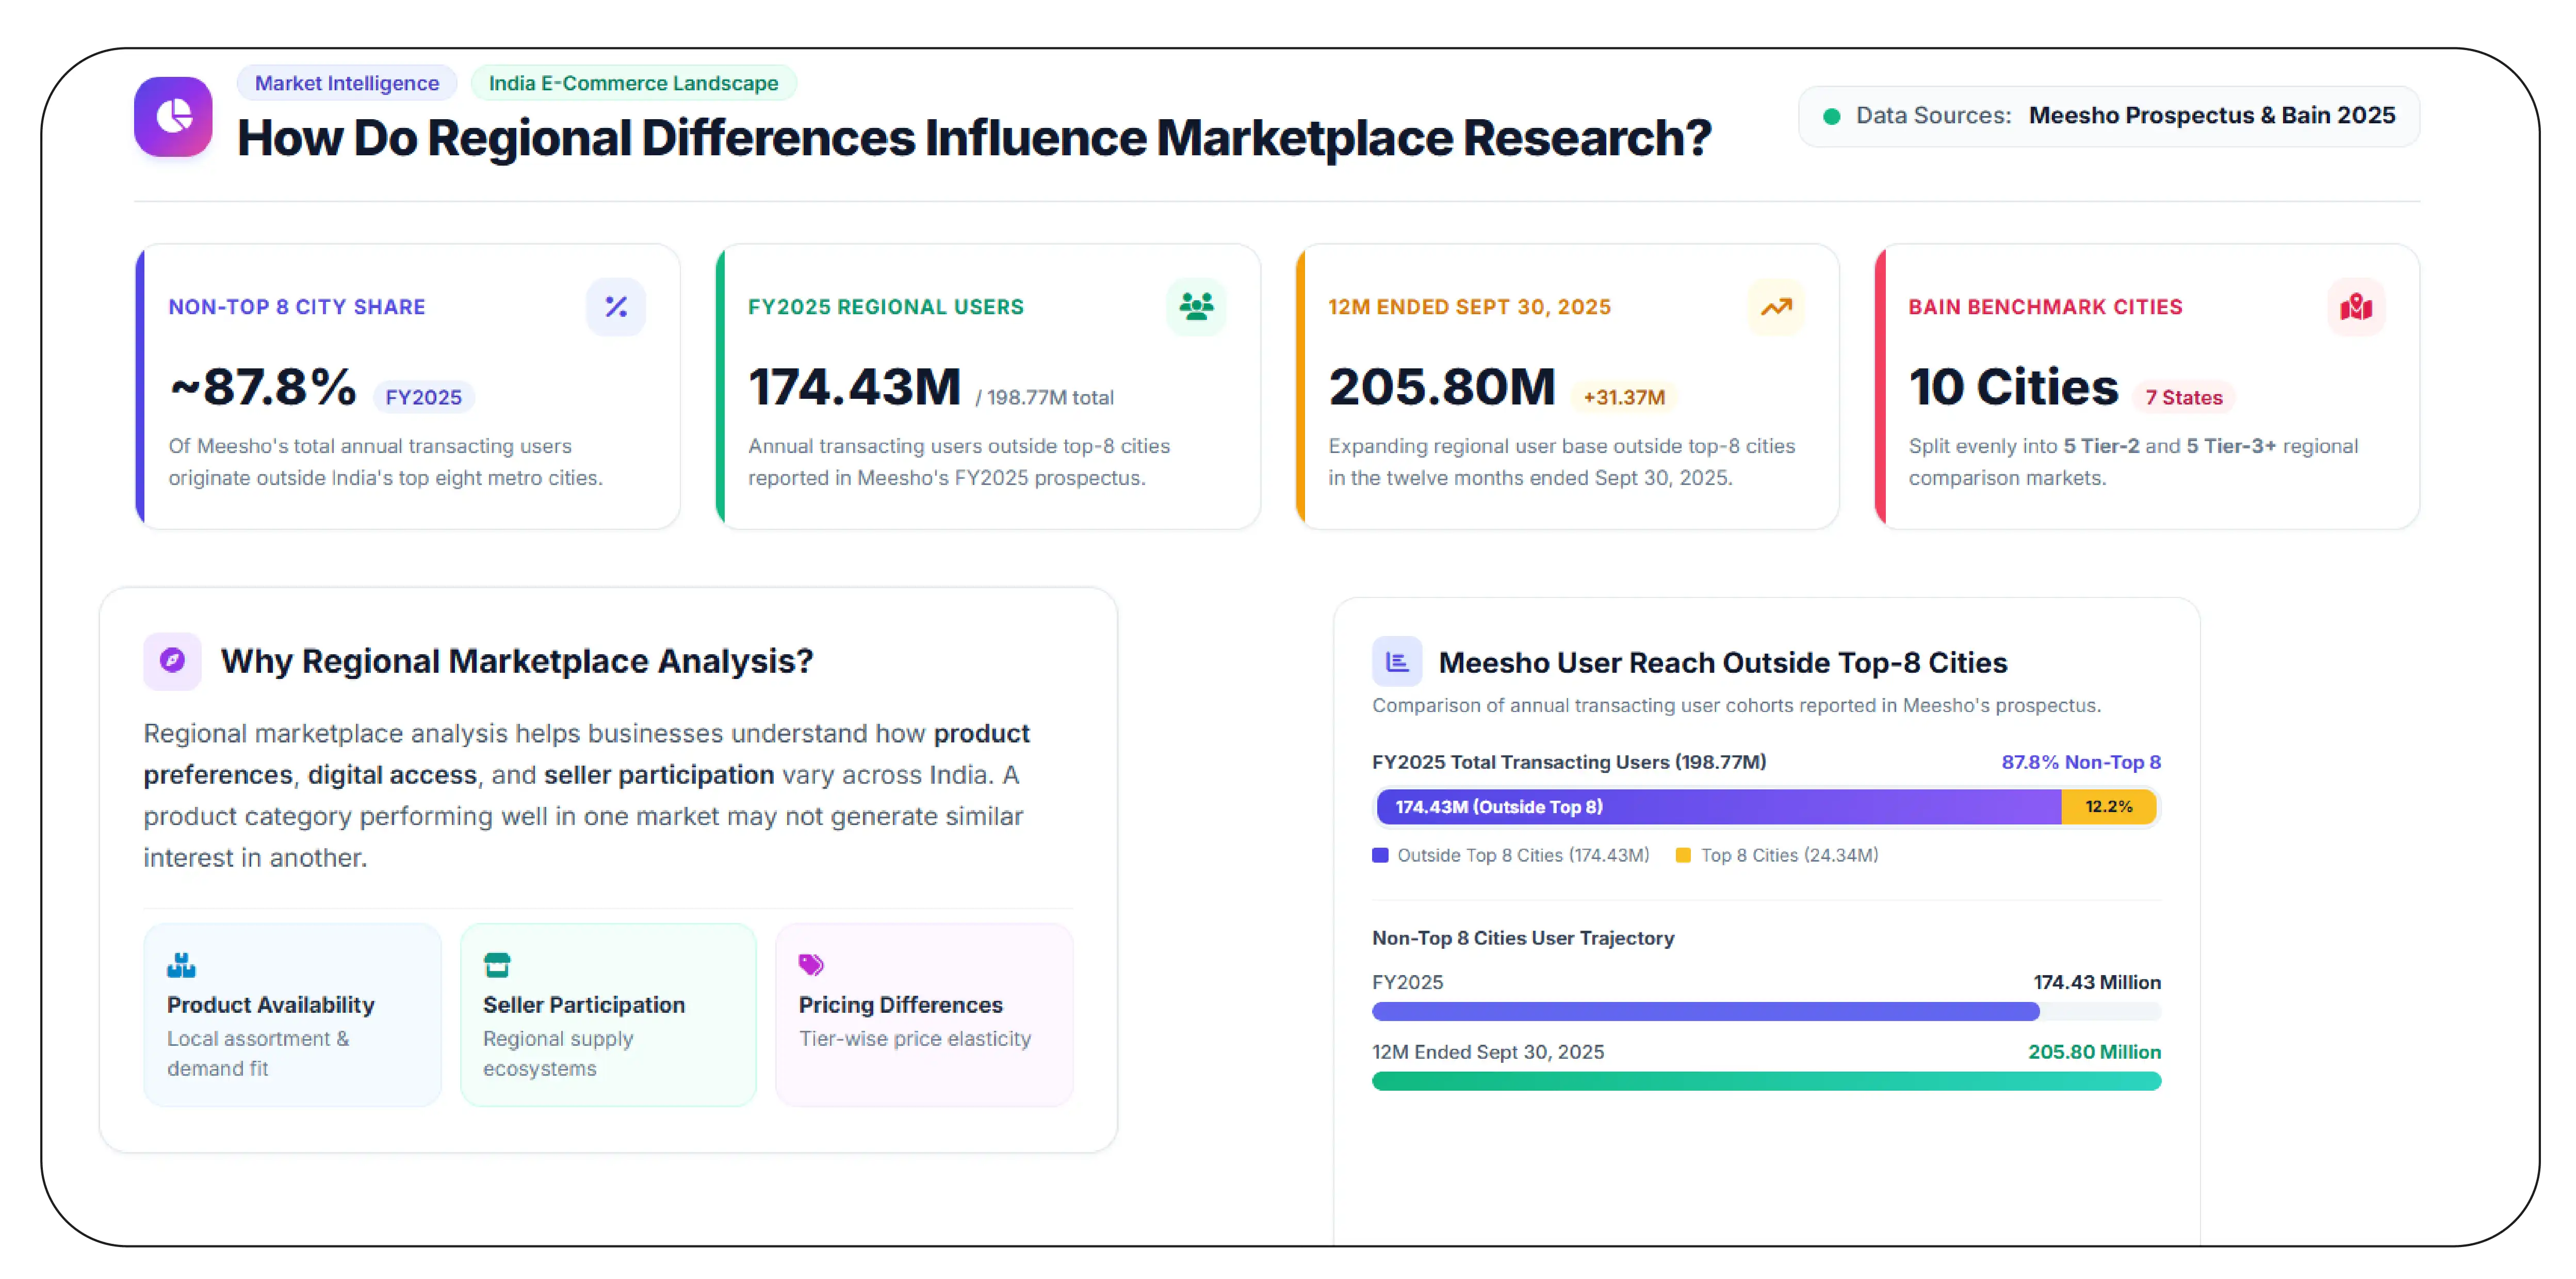
Regional marketplace analysis helps businesses understand how product preferences, digital access, and seller participation vary across India. A product category performing well in one market may not generate similar interest in another.
Meesho's prospectus reported that 174.43 million of its 198.77 million annual transacting users in FY2025 were from outside India's top eight cities. That represents approximately 87.8% of its annual transacting users. The company also reported 205.80 million users from outside its top eight cities in the twelve months ended September 30, 2025.
This creates a strong reason to examine regional product availability, seller participation, and pricing differences.
Which Indian cities offer useful regional comparison opportunities?
Bain & Company's 2025 How India Shops Online report identifies the following examples of Tier-2 and Tier-3+ cities.
| City | State | Classification in Bain examples |
|---|
| Ajmer | Rajasthan | Tier-2 |
| Jhansi | Uttar Pradesh | Tier-2 |
| Cuttack | Odisha | Tier-2 |
| Ujjain | Madhya Pradesh | Tier-2 |
| Mangalore | Karnataka | Tier-2 |
| Sikar | Rajasthan | Tier-3+ |
| Palakkad | Kerala | Tier-3+ |
| Mirzapur | Uttar Pradesh | Tier-3+ |
| Puri | Odisha | Tier-3+ |
| Tirupati | Andhra Pradesh | Tier-3+ |
These are published city classifications, not Meesho-specific sales rankings.
What does regional digital access indicate?
TRAI's September 2024 report provides state-level internet subscriber statistics that can help contextualize regional digital access. The figures below are not individual city measurements.
| State | Rural internet subscribers (million) | Urban internet subscribers (million) | Total (million) |
|---|
| Bihar | 37.37 | 17.33 | 54.70 |
| Gujarat | 18.77 | 35.89 | 54.66 |
| Karnataka | 21.23 | 38.59 | 59.83 |
| Kerala | 17.55 | 18.02 | 35.57 |
| Madhya Pradesh | 21.15 | 29.22 | 50.37 |
| Odisha | 16.91 | 8.77 | 25.68 |
| Rajasthan | 25.83 | 26.59 | 52.42 |
| Andhra Pradesh | 17.97 | 18.53 | 36.50 |
Source: TRAI, July–September 2024, Table 1.33. Figures are state-level internet subscriber counts, not unique shoppers or Meesho customers.
For regional research, Meesho Regional Seller Data Monitoring should combine available seller-location information with product categories, prices, and listing observations. This can help businesses compare markets without incorrectly treating internet subscribers as actual buyers.
How Can Businesses Compare Seller-Wise Prices and Product Positioning?
Seller-wise pricing analysis helps brands understand how multiple sellers position similar products within the same category. It can reveal pricing differences, discount patterns, and opportunities for competitive product positioning.
The Meesho prospectus provides actual product-price distribution data for the six months ended September 30, 2025. The following figures represent the 10th, 50th, and 90th percentile prices of products sold in selected categories.
| Product category | 10th percentile | Median price | 90th percentile |
|---|
| Apparel | ₹172 | ₹301 | ₹563 |
| Footwear and accessories | ₹107 | ₹176 | ₹355 |
| Home, kitchen and furnishings | ₹96 | ₹168 | ₹371 |
| Kids and baby products | ₹132 | ₹230 | ₹376 |
| Beauty and personal care | ₹90 | ₹159 | ₹354 |
| Others | ₹97 | ₹169 | ₹385 |
investor.meesho.com
These figures represent actual prices paid by customers in the specified period, rather than current displayed listing prices. The distinction matters because checkout prices can differ from advertised prices.
A structured Meesho Seller-Wise Product Price Tracking framework should collect comparable products and preserve seller identifiers. Product matching should consider:
- Product type and category.
- Brand and model, when available.
- Size, color, material, and other variations.
- Pack quantity and product specifications.
- Current displayed price and discount.
- Seller identity and collection timestamp.
Businesses can then Scrape Meesho Seller & Product Data to compare similar listings instead of comparing unrelated products simply because they share a category.
The most useful reports separate median pricing, minimum observed pricing, and price ranges. They should also flag incomplete product matches to prevent inaccurate competitor comparisons.
For sellers targeting smaller cities, these comparisons can help identify affordable product segments and evaluate whether a particular price position is consistent across the available marketplace assortment.
How Can Regional Collection Improve Marketplace Intelligence?
Regional data collection allows businesses to understand how seller listings, product categories, and pricing information are distributed across different parts of India.
The opportunity is supported by broader e-retail research. Bain & Company's 2025 report found that more than 60% of new e-retail shoppers since 2020 came from Tier-3+ cities. It also reported that more than 45% of e-retail orders since 2023 came from Tier-3+ cities, while more than 60% of sellers onboarded since 2021 came from Tier-2+ cities.
These figures describe India's broader e-retail market, not Meesho's individual seller or order distribution.
A structured Meesho Regional Seller Data Scraping India workflow can help researchers investigate this market through the following activities:
- Location-based product research: Organize relevant listings by available delivery locations and regional market coverage.
- Seller identification: Maintain consistent seller identifiers to understand catalog changes over time.
- Category comparisons: Evaluate product assortment across fashion, beauty, home essentials, footwear, and other categories.
- Pricing comparisons: Compare equivalent product variations and displayed prices.
- Historical monitoring: Preserve dated records to identify new listings, removed products, and changing price positions.
How has India's e-retail market changed between 2020 and 2026?
The following table combines published historical evidence with the latest available market research. It does not present unsupported annual Meesho market-share estimates.
| Year | Verified market indicator | Finding |
|---|
| 2020 | Meesho annual transacting users (FY2020) | 2.46 million |
| 2021 | Meesho annual transacting users (FY2021) | 12.06 million |
| 2022 | Meesho annual transacting users (FY2022) | 109.59 million |
| 2023 | Meesho annual transacting users (FY2023) | 136.40 million |
| 2024 | Meesho annual transacting users (FY2024) | 155.64 million |
| 2025 | Meesho annual transacting users (FY2025) | 198.77 million |
| 2026 | Meesho LTM annual transacting users, September 2026 | 284 million+ |
The 2026 number is a company-reported trailing-twelve-month figure, while the earlier figures are financial-year measures. It should not be interpreted as a directly comparable fiscal-year growth rate.
A regional dataset becomes more useful when businesses can connect listing information with seller activity, price history, product categories, and location-level availability. This creates a stronger foundation for identifying regional opportunities without assuming that every city follows the same shopping pattern.
Why Choose Product Data Scrape?
Product Data Scrape helps e-commerce businesses transform marketplace information into structured, decision-ready datasets. Our solutions support seller monitoring, product catalog extraction, pricing intelligence, and regional marketplace research. We develop customized extraction workflows that capture relevant product attributes, seller information, and listing changes from permitted sources. Businesses can use Scrape India social commerce report Meesho research to understand emerging seller opportunities and changing regional market dynamics. Our Scrape Meesho Seller & Product Data solutions also support historical comparisons, product matching, data validation, and customized reporting. We focus on reliable data delivery, scalable workflows, and actionable marketplace intelligence.
Conclusion
India's expanding e-commerce ecosystem creates opportunities for businesses to understand regional sellers, product demand, and competitive pricing. Meesho seller data scraping helps retailers organize product listings, monitor seller activity, compare prices, and identify emerging marketplace trends. Structured datasets also support better regional research and product assortment decisions. With Scrape Meesho Seller & Product Data, businesses can turn fragmented marketplace information into actionable intelligence. Partner with Product Data Scrape to build customized data extraction solutions, strengthen seller intelligence, and uncover opportunities across India's Tier-2 and Tier-3 marketplace landscape. Contact our team to discuss your marketplace data requirements!
FAQs
1. What is Meesho seller data scraping?
It is the process of collecting publicly accessible seller information, product listings, prices, categories, ratings, and other relevant marketplace attributes for structured business analysis.
2. Which product information can businesses collect?
Businesses can collect product names, categories, displayed prices, discounts, ratings, review counts, seller identifiers, listing URLs, and availability indicators where publicly accessible.
3. Why monitor Tier-2 and Tier-3 sellers?
Monitoring smaller-city sellers helps businesses identify emerging competitors, understand regional product assortment, compare pricing strategies, and discover underserved marketplace opportunities.
4. How frequently should Meesho product data be collected?
Collection frequency depends on business requirements, source availability, and permitted access. Daily or weekly monitoring can support pricing comparisons and historical product listing analysis.
5. Can Product Data Scrape provide customized Meesho datasets?
Yes. Product Data Scrape can develop customized datasets containing relevant seller, product, pricing, category, and listing information for marketplace intelligence and competitive research.


 Singapore
 EMAIL
 PHONE










.webp)