Executive Summary
An FMCG brand and a marketplace seller look at the same shelf and need completely different data from it.
A seller asks: am I winning the Buy Box, is my price competitive, is my listing converting? A brand asks a wider question across every platform at once: where is my product available, where is it out of stock, what share of the relevant shelf do I hold against competitors, and what are those competitors pricing and promoting? The seller optimises a listing. The brand manages a presence across dozens of retailers and quick-commerce platforms simultaneously — and that is a different, broader data problem.
This report covers FMCG data scraping built for the brand side: what shelf-and-price monitoring across e-commerce and quick commerce must capture, the traps specific to brand-level measurement, and what the data looks like.
This report is published by Product Data Scrape. Sample figures are illustrative of structure, not a live census.
Why Brand-Side Monitoring Is Its Own Problem
The unit is the brand's presence, not one listing. A brand cares about all its SKUs across all platforms and locations, and about competitors on the same shelves. The scope is the category, not a single product page.
Share of shelf, not just price. A brand's key question is how much of the relevant search result and category it occupies versus competitors — a measurement that only exists across the full result, not on the brand's own listing alone.
Availability across a distributed shelf. An FMCG product is stocked across many retailers, q-commerce platforms, and locations. Where it is out of stock — and where a competitor is available in its place — is a channel-health signal a single listing cannot show.
E-com and q-com behave differently. Traditional e-commerce and quick commerce have different pricing, availability dynamics, and location granularity. A brand needs both, measured comparably.
The Traps
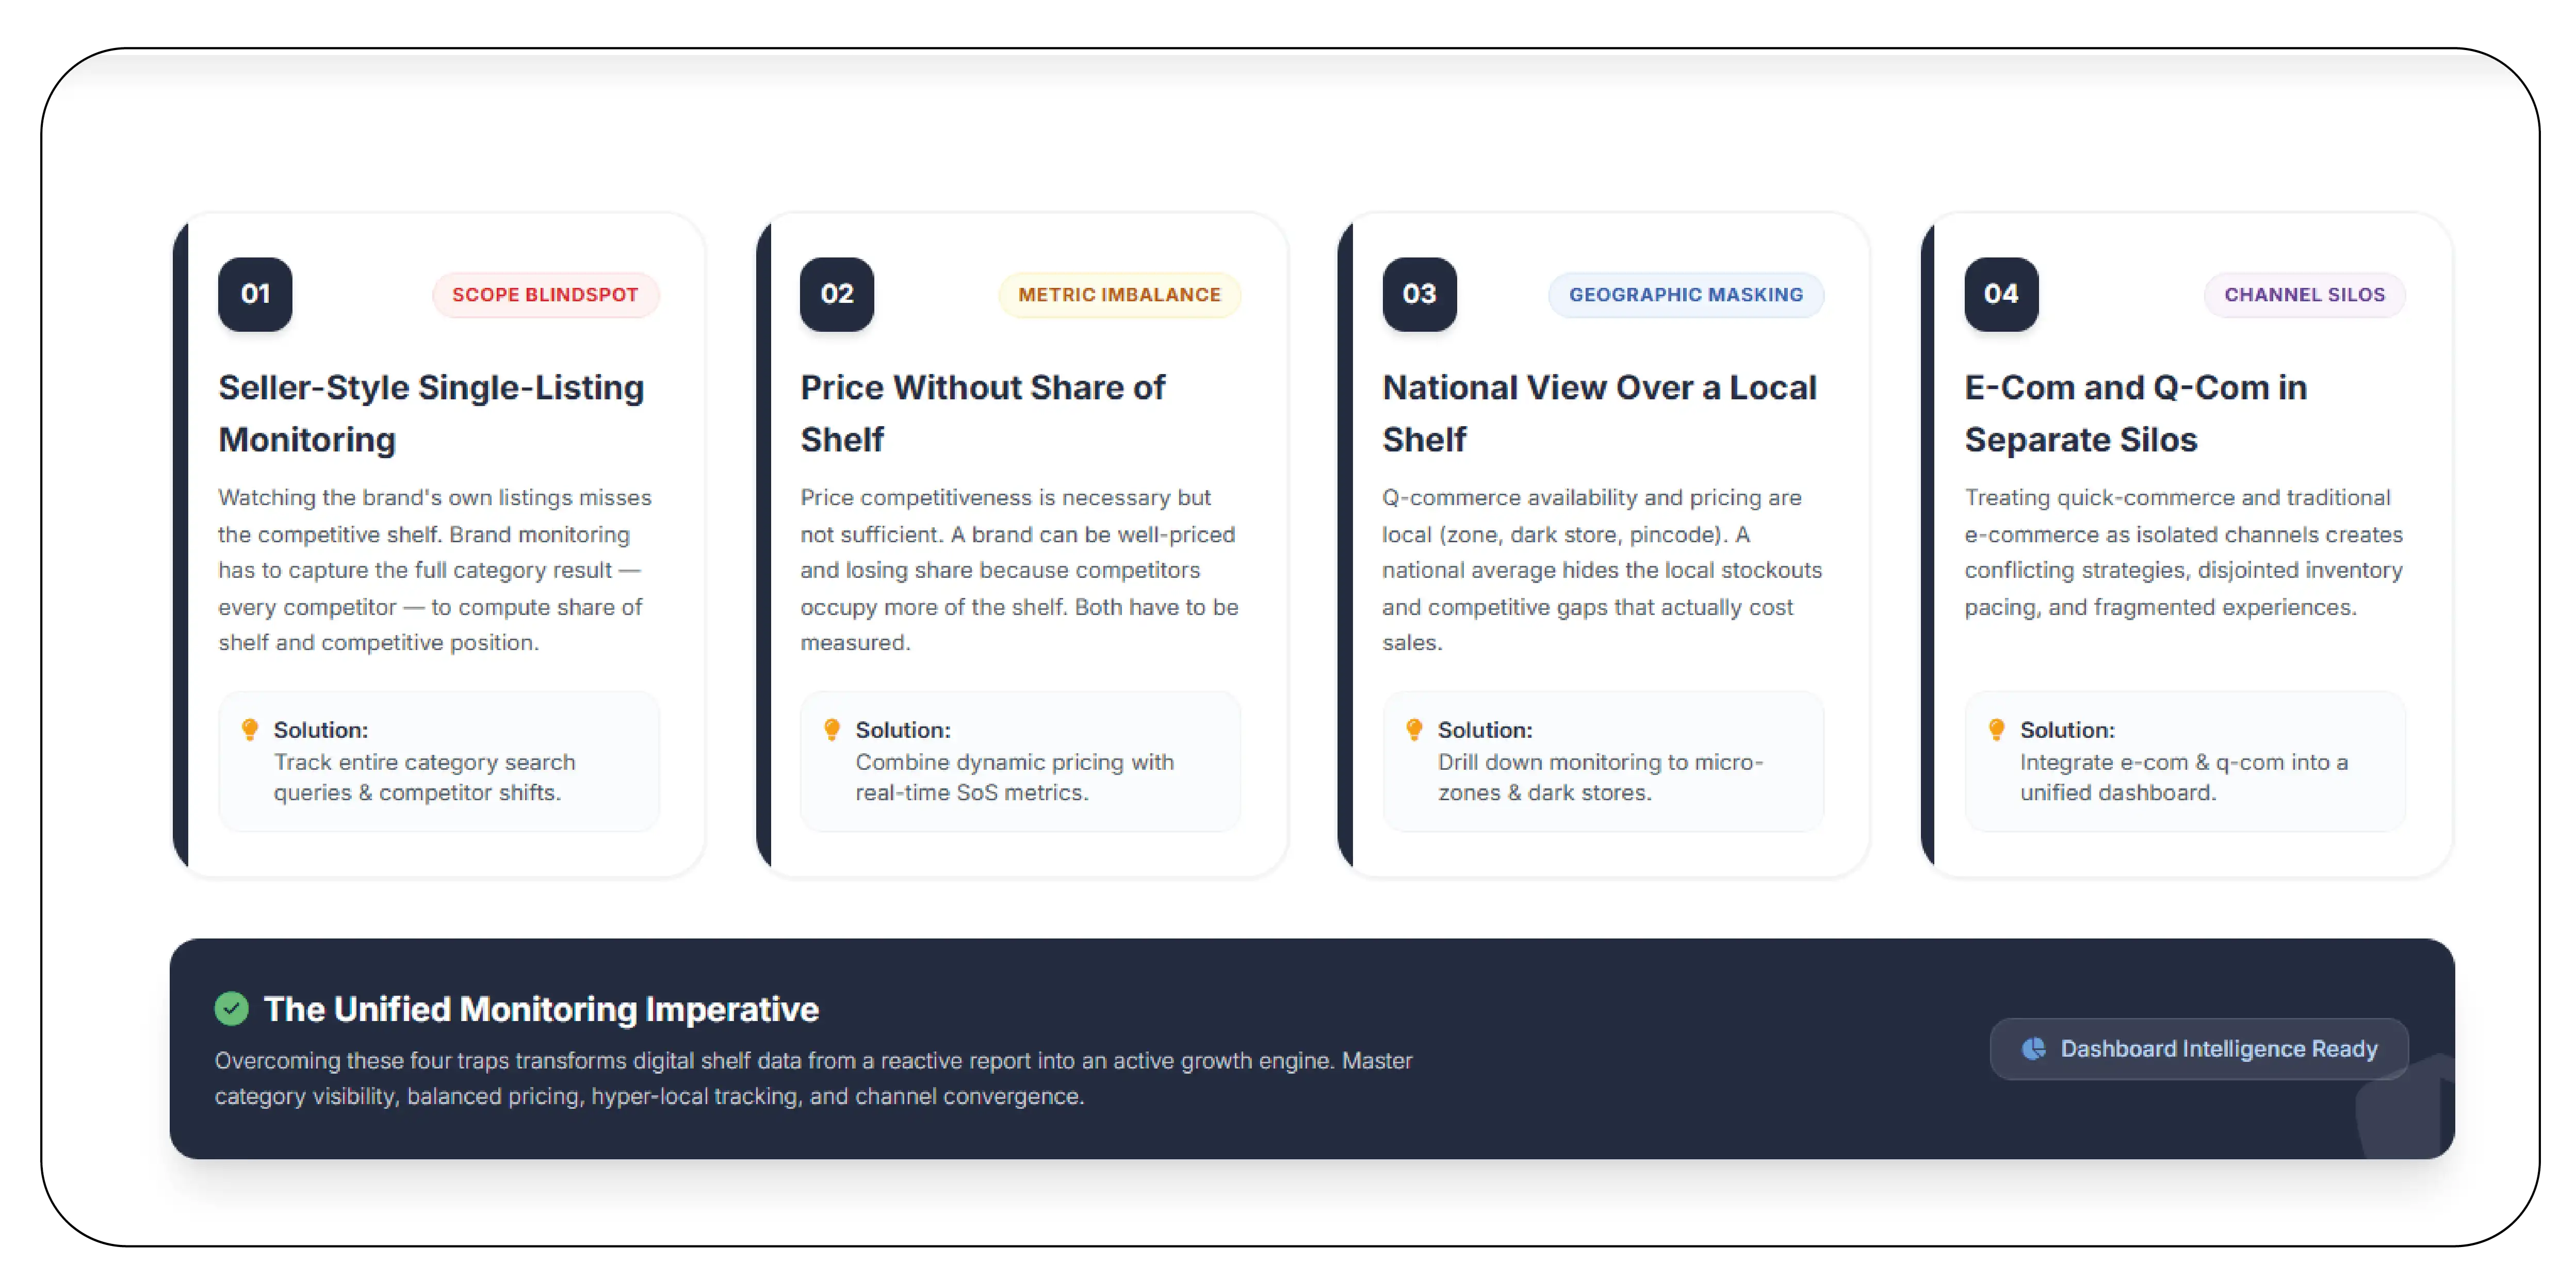
Trap one: seller-style single-listing monitoring
Watching the brand's own listings misses the competitive shelf. Brand monitoring has to capture the full category result — every competitor — to compute share of shelf and competitive position.
Trap two: price without share of shelf
Price competitiveness is necessary but not sufficient. A brand can be well-priced and losing share because competitors occupy more of the shelf. Both have to be measured.
Trap three: national view over a local shelf
Q-commerce availability and pricing are local (zone, dark store, pincode). A national average hides the local stockouts and competitive gaps that actually cost sales.
Trap four: e-com and q-com in separate silos
A brand needs one comparable view across both channel types. Measuring them with different definitions makes the cross-channel picture incoherent.
What a Usable FMCG Brand Dataset Captures
| Field group |
Fields |
| Identity |
brand_sku, competitor_sku, platform, channel_type, location_id |
| Pricing |
price, base_price, promo_price, promo_type, price_per_unit |
| Availability |
in_stock, stock_signal, oos_duration |
| Shelf |
search_term, position, share_of_shelf, competitor_positions |
| Competitive |
competitor_price, competitor_promo, competitor_availability |
| Capture |
captured_at, capture_window |
The Shelf group (share of shelf and competitor positions per search term) is what turns price-and-stock capture into brand-level intelligence.
Sample Data: Brand Presence on One Category Shelf
An illustrative share-of-shelf and availability view for one search term across channel types.
| Platform (type) |
Location |
Our share of top 10 |
Our price |
Comp best price |
Our stock |
| Platform A (e-com) |
National |
20% |
149 |
145 |
In stock |
| Platform B (q-com) |
Zone X |
30% |
152 |
148 |
In stock |
| Platform B (q-com) |
Zone Y |
10% |
152 |
139 |
Out of stock |
| Platform C (q-com) |
Zone X |
0% |
— |
142 |
Not listed |
Illustrative figures.
The rows tell a brand-level story no single listing could: strong shelf share on Platform B in Zone X, but out of stock in Zone Y where a competitor is cheaper and taking the shelf, and entirely absent from Platform C in the same zone. Those are three different, specific, actionable channel-health findings — a distribution gap, a stockout, and a competitive-price exposure — each tied to a location.
The structured record:
{
  "brand_sku": "FMCG-SNACK-BRANDA-150G",
  "platform": "platform_b",
  "channel_type": "quick_commerce",
  "location_id": "zone_y",
  "search_term": "potato chips 150g",
  "captured_at": "2026-07-15T16:00:00+05:30",

  "pricing": {"price": 152, "promo_price": null, "price_per_unit": 1.01, "currency": "INR"},
  "availability": {"in_stock": false, "stock_signal": "out_of_stock", "oos_duration_hours": 6},

  "shelf": {
    "our_position": null,
    "share_of_shelf_top10_pct": 10,
    "competitor_positions": [
      {"competitor": "comp_a", "position": 1, "price": 139, "in_stock": true},
      {"competitor": "comp_b", "position": 2, "price": 145, "in_stock": true}
    ]
  }
}
What the Data Enables
Share-of-shelf tracking. Brands measure how much of the category they own versus competitors, per platform and location.
Channel-health monitoring. Where the brand is out of stock or unlisted, and which competitor takes the shelf there, becomes visible and addressable.
Effective-price competitive view. Brand and competitor pricing and promotions are compared on a matched basis across e-com and q-com.
Market-entry and expansion intelligence. For a brand entering a market or category, the data shows demand, competitive intensity, and whitespace across platforms — the shape behind requests to see "what's in demand, units sold, price range, and top-performing platforms."
Who Uses FMCG Brand Data
FMCG brands monitor price, availability, and share of shelf across all e-com and q-com platforms — the brand-side view behind "monitor price competitiveness across brands on all e-com and q-com platforms."
Category and trade teams allocate trade investment and promotions using share-of-shelf and competitive data by platform and location.
Market-entry strategists assess demand, competition, and whitespace before entering a category or market.
Brand analysts track competitive pricing and promotional intensity over time.
Limitations
Share of shelf depends on defined search terms and full-result capture. Q-commerce measurement requires location-level granularity. Cross-channel comparability depends on consistent definitions. We capture publicly available product, price, and availability data; sample figures illustrate structure rather than audited statistics.
About the Data
This report was produced using FMCG data scraping methods from Product Data Scrape. We build brand-side shelf-and-price datasets across e-commerce and quick-commerce platforms — brand and competitor pricing, availability with location granularity, share of shelf per search term, and competitor positions — measured comparably across both channel types.
Delivered as JSON, CSV, via API, or dashboard-ready feeds, segmented by platform, channel type, and location.
Managing an FMCG brand across e-com and q-com? Product Data Scrape will build a share-of-shelf and availability sample on your category, so you can see where you hold the shelf, where you're losing it, and where you're not on it at all.
Product Data Scrape — turning marketplace complexity into decision-ready data.


 Singapore
 EMAIL
EMAIL
 PHONE
PHONE















.webp)






