Introduction
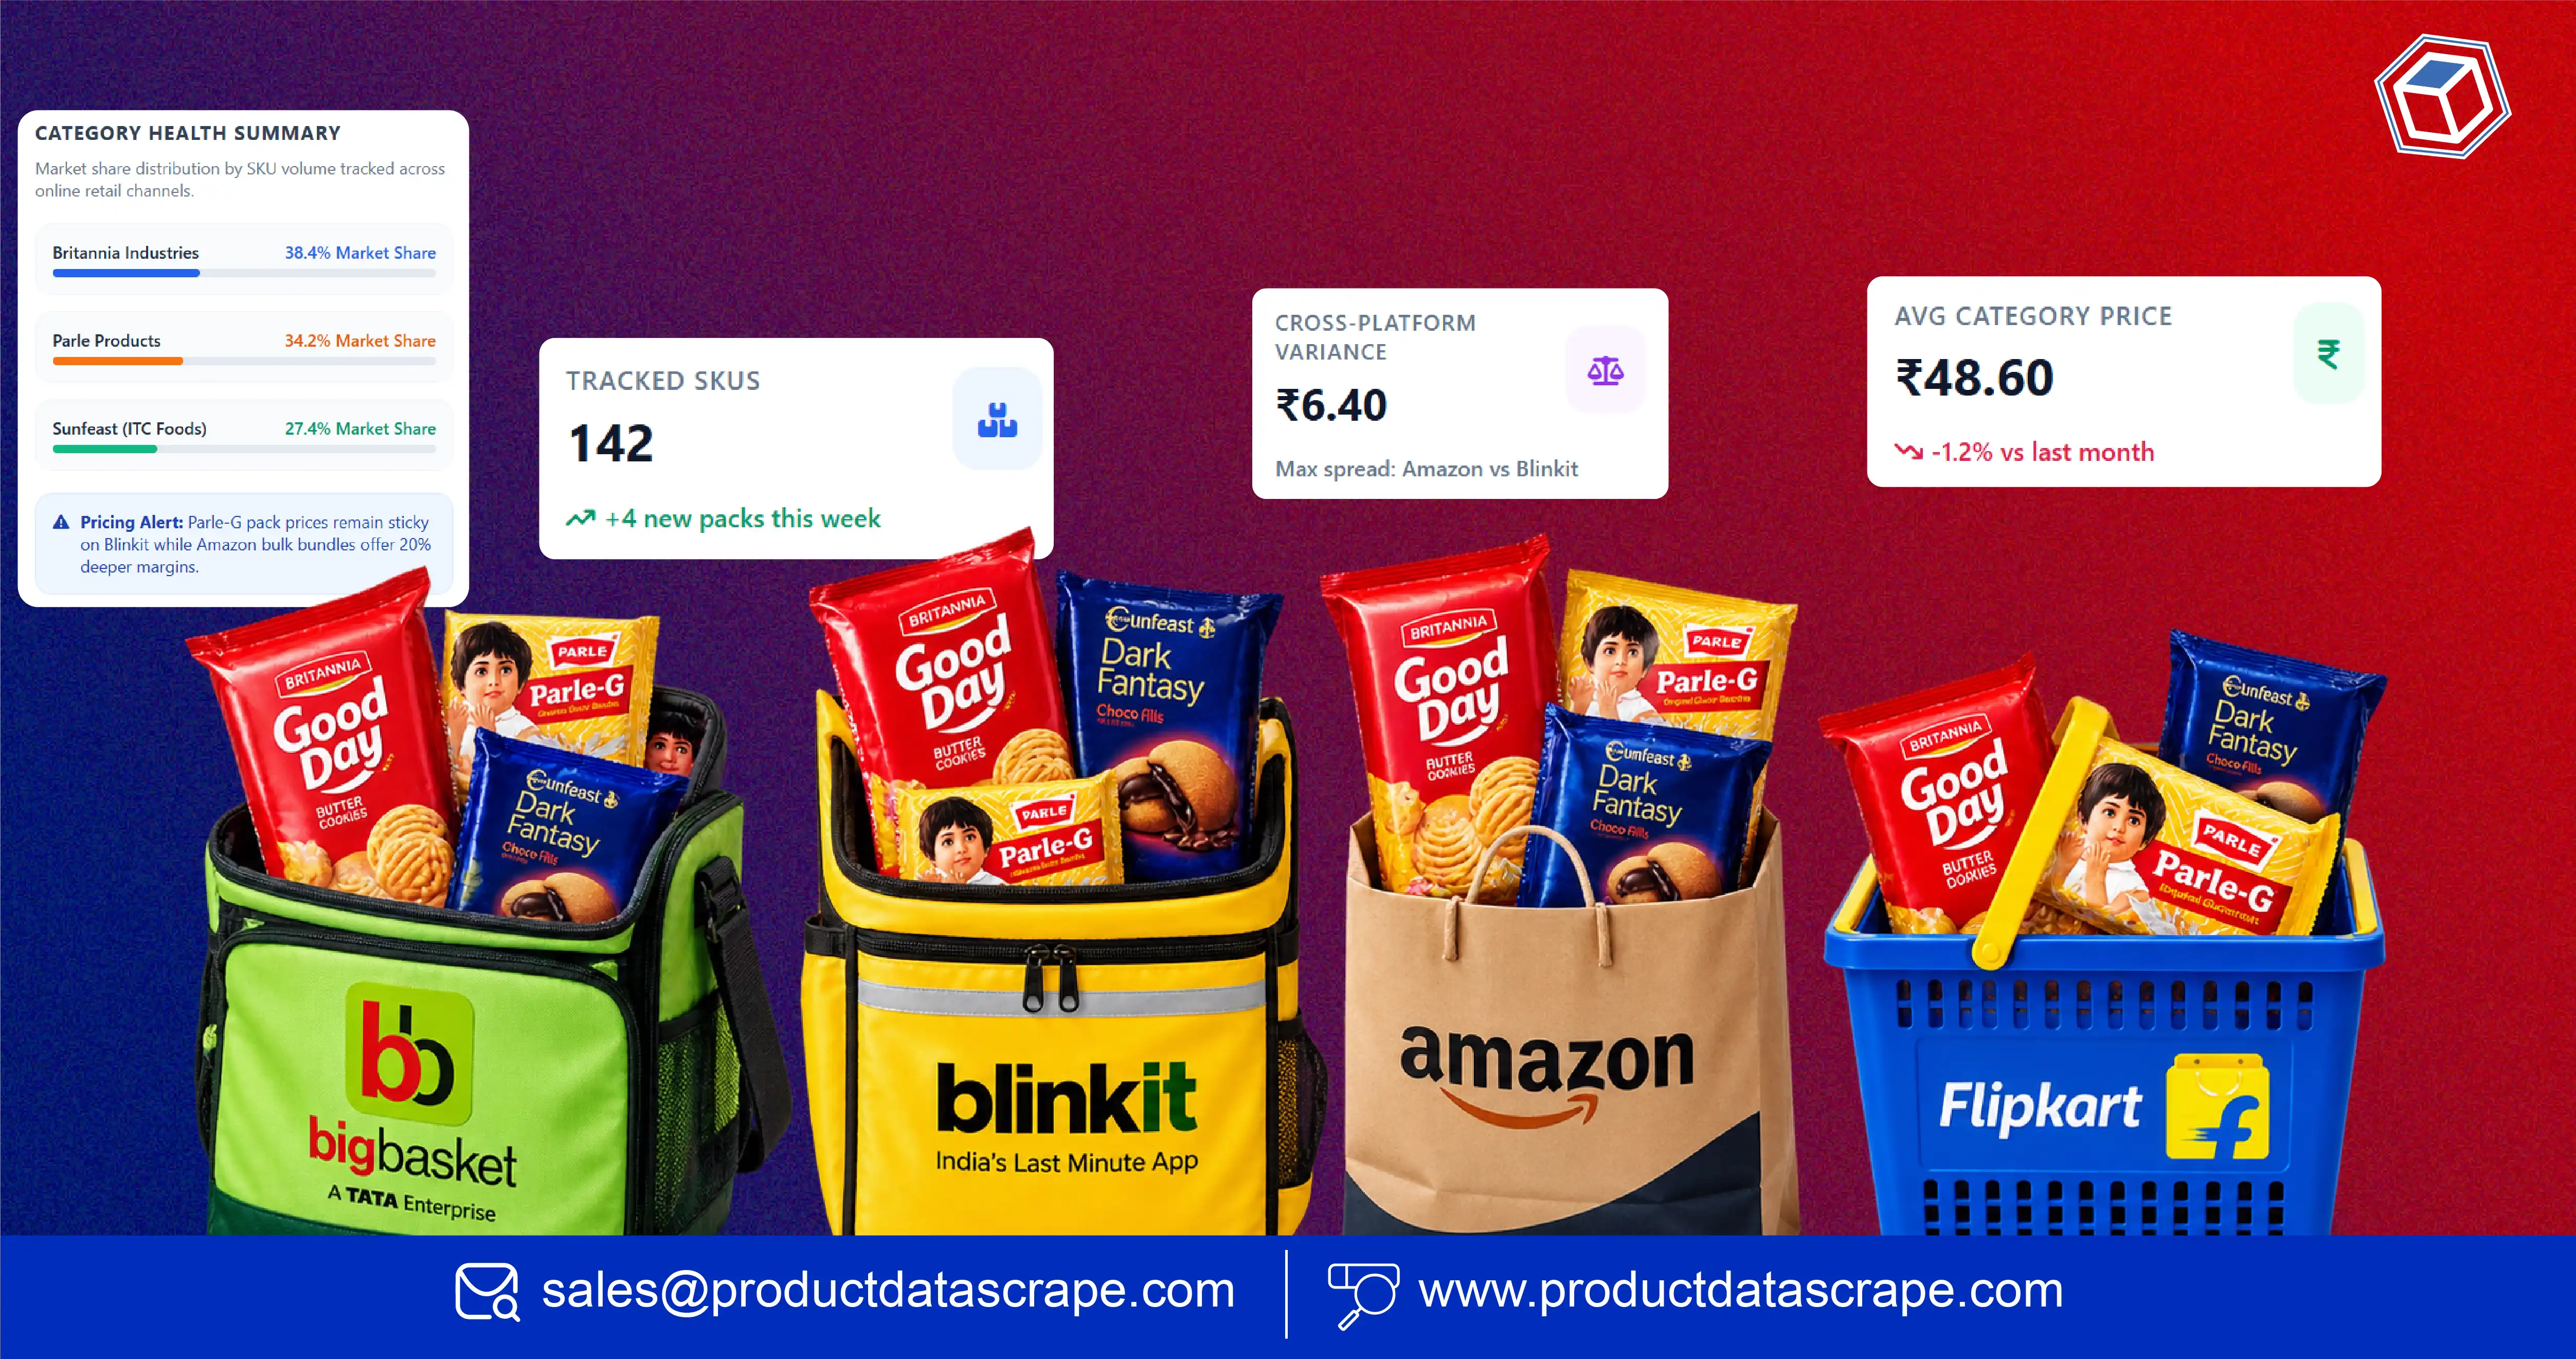
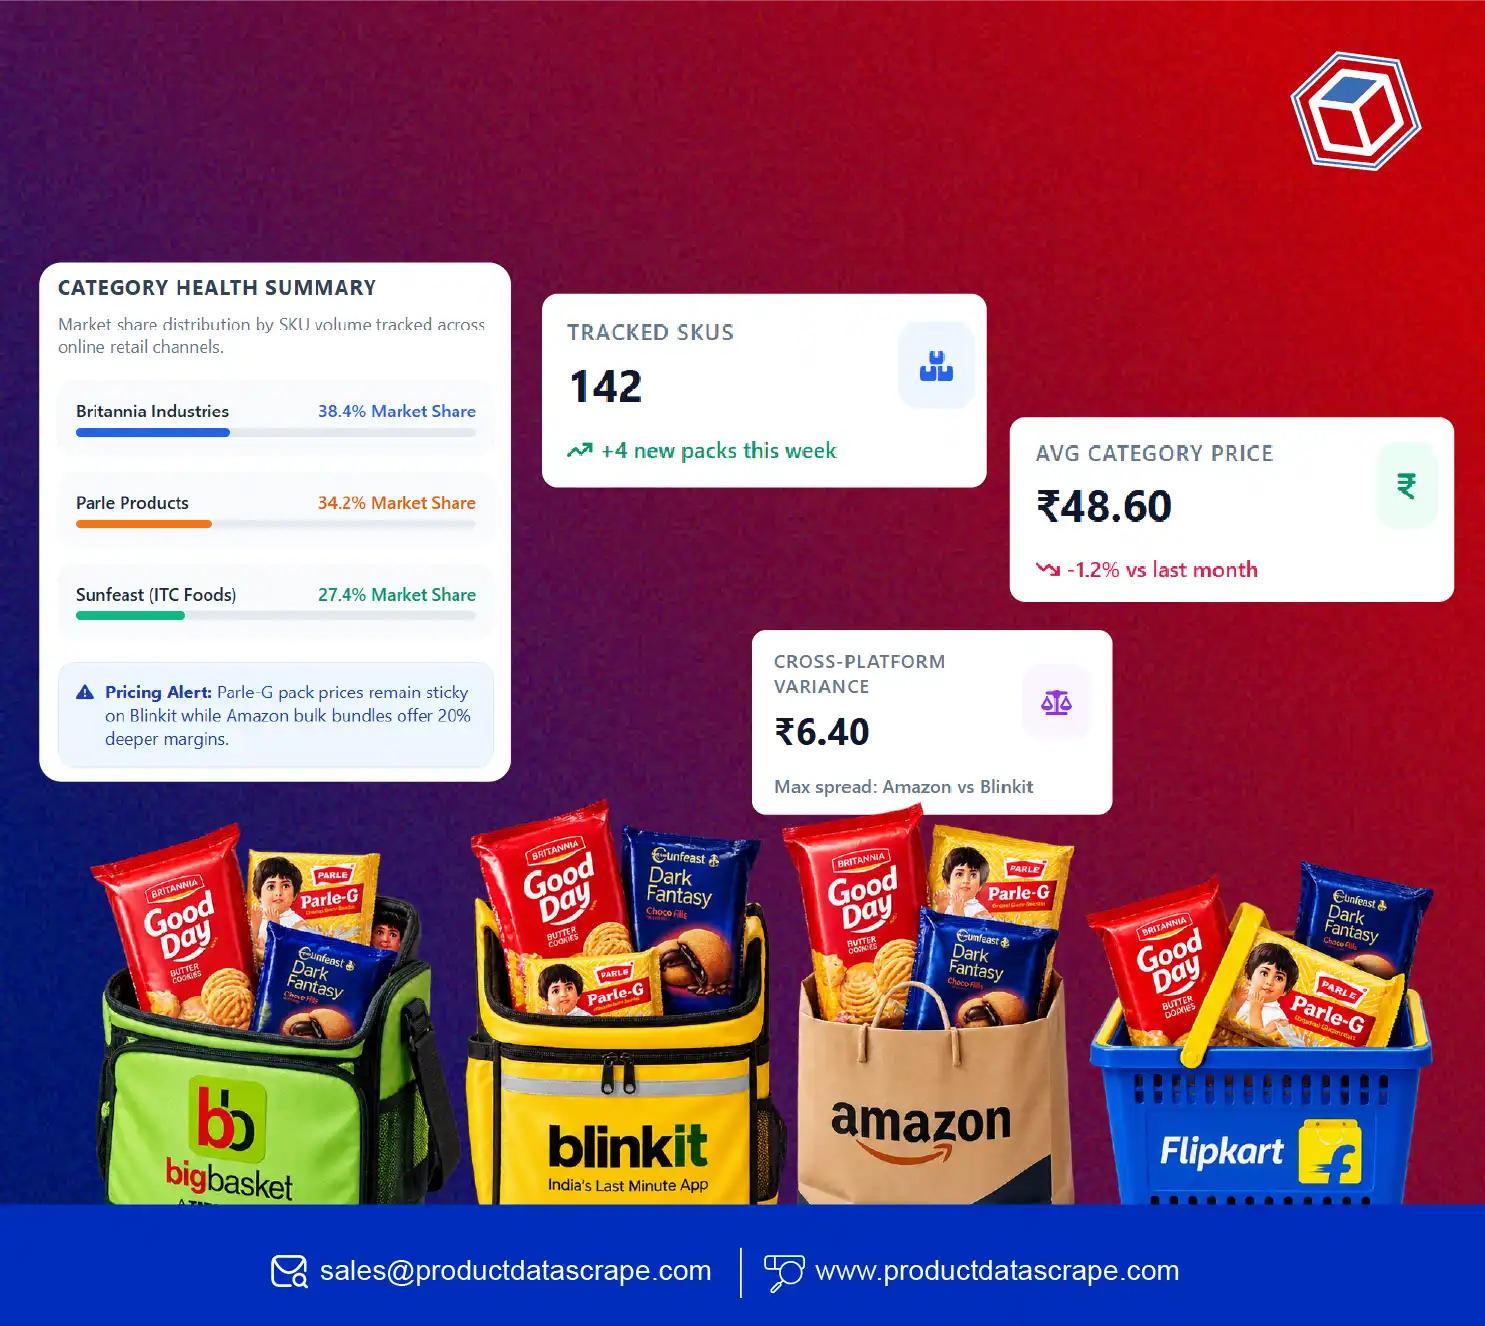
The Britannia, Parle, Sunfeast Market Analysis Dashboard helps FMCG brands, retailers, and category managers compare biscuit prices, product availability, promotions, ratings, and competitor activity across BigBasket, Blinkit, Amazon, and Flipkart. It converts fragmented marketplace information into structured data for faster pricing and category decisions.
Biscuit pricing changes with promotions, pack sizes, retailer strategies, and regional demand. Brands therefore need continuous visibility instead of occasional manual checks. Tracking market share alongside pricing and product activity can provide a broader view of competitive positioning.
For example, a category team can compare the prices of similar biscuit packs across four marketplaces. It can then identify price gaps, discount intensity, product assortment changes, and customer response.
Illustrative industry benchmark: A monitoring program covering 2,000 biscuit SKUs across four marketplaces can generate 8,000 product-marketplace observations per monitoring cycle.
Illustrative Monitoring Scale (2020–2026)
| Year |
Illustrative SKUs Tracked |
Marketplaces |
Monitoring Focus |
| 2020 |
400 |
2 |
Basic price tracking |
| 2021 |
600 |
2 |
Product comparison |
| 2022 |
900 |
3 |
Discount monitoring |
| 2023 |
1,200 |
3 |
Competitor intelligence |
| 2024 |
1,500 |
4 |
Promotion analysis |
| 2025 |
2,000 |
4 |
Automated monitoring |
| 2026 |
2,500+ |
4+ |
Continuous pricing intelligence |
The figures above are illustrative benchmarks for explaining how a monitoring program can scale. The actual value depends on SKU coverage, marketplace availability, locations, and collection frequency.
How Can Businesses Understand Britannia's Online Biscuit Positioning?
Britannia is one of India's most recognized biscuit brands. Its large product portfolio creates a need for detailed monitoring across digital retail channels. A structured Britannia biscuit market analysis can help businesses evaluate product prices, pack sizes, discounts, availability, and category positioning.
Pricing is only one part of the analysis. Brands can also track whether products remain available, how frequently promotions appear, and how competing products are priced.
FMCG Biscuit Category Pricing Data provides the foundation for this comparison. A structured dataset can contain product names, brands, pack sizes, MRP, selling price, discount percentage, ratings, reviews, availability, and timestamps.
The data can be compared across BigBasket, Blinkit, Amazon, and Flipkart. This creates a consistent view of online biscuit pricing.
Illustrative Britannia Monitoring Scale (2020–2026)
| Year |
Illustrative Britannia SKUs |
Price Checks/Month |
Main Insight |
| 2020 |
400 |
800 |
Basic price comparison |
| 2021 |
550 |
1,200 |
Pack-size comparison |
| 2022 |
750 |
2,500 |
Discount tracking |
| 2023 |
1,000 |
5,000 |
Competitive benchmarking |
| 2024 |
1,250 |
10,000 |
Promotion monitoring |
| 2025 |
1,500 |
20,000 |
Dynamic pricing analysis |
| 2026 |
1,800+ |
35,000+ |
Continuous monitoring |
These figures represent an illustrative monitoring model.
A category manager can use this data to identify price gaps between marketplaces. A brand manager can identify which products receive the most promotional support. A retailer can compare its own pricing against competing channels.
Pack-size normalization is also important. A ₹50 pack and a ₹100 pack should not be compared only by their selling prices. Unit-level calculations can provide a better comparison.
Historical records make the analysis more valuable. Teams can see whether a price change is temporary or part of a longer trend.
This helps businesses make more informed biscuit category pricing decisions.
How Can Parle Pricing Trends Reveal Competitive Opportunities?
Parle has a broad biscuit portfolio covering different consumer segments and price points. This makes competitive pricing intelligence important for businesses monitoring the category.
Parle biscuit pricing intelligence can track product prices, discounts, pack sizes, availability, and promotional activity across online marketplaces.
The objective is to understand how products are positioned against similar Britannia and Sunfeast offerings. Comparable products can be grouped by category, pack size, brand, and other attributes.
For example, a pricing team can compare similar glucose biscuits across four marketplaces. It can calculate the price difference between brands and determine which retailer offers the strongest discount.
Illustrative Parle Monitoring Scale (2020–2026)
| Year |
Illustrative Parle SKUs |
Average Price Checks/Month |
Key Analysis |
| 2020 |
300 |
600 |
Price benchmarking |
| 2021 |
450 |
1,000 |
Pack-size comparison |
| 2022 |
650 |
2,000 |
Discount analysis |
| 2023 |
850 |
4,000 |
Competitive positioning |
| 2024 |
1,100 |
8,000 |
Promotion tracking |
| 2025 |
1,400 |
16,000 |
Price movement analysis |
| 2026 |
1,700+ |
30,000+ |
Automated intelligence |
These figures are illustrative.
A historical pricing dataset can answer several important questions:
- Which products have the largest price differences?
- Which SKUs receive frequent discounts?
- Which marketplace consistently offers lower prices?
- Which pack sizes experience the strongest promotional activity?
- Which products frequently become unavailable?
The answers can support category planning.
Businesses can also identify pricing clusters. Products can be grouped into economy, mainstream, premium, and family-pack segments. This provides more context than looking at individual prices.
Promotional timing also matters. A product may have a stable base price but receive discounts during weekends, festivals, or major shopping events.
Continuous monitoring captures these changes.
This makes pricing intelligence useful for brands, distributors, retailers, and category managers that need a clearer view of competitive movements.
How Can Businesses Measure Sunfeast Product Performance?
Sunfeast competes across several biscuit categories and consumer segments. Its digital product performance can be evaluated using pricing, availability, ratings, reviews, assortment, and promotional data.
Sunfeast product performance analytics combines these signals into a broader view of product positioning. Price alone does not explain performance. A product with a competitive price may still have low visibility or weak customer sentiment.
Customer feedback can provide additional context. Businesses can Extract Customer Ratings and Reviews from supported marketplace listings to understand customer response to individual products.
A structured review dataset can include rating scores, review counts, review text, review dates, and product identifiers where publicly available.
Illustrative Sunfeast Monitoring Scale (2020–2026)
| Year |
Illustrative Sunfeast SKUs |
Reviews Monitored/Month |
Main Metric |
| 2020 |
250 |
500 |
Average rating |
| 2021 |
350 |
800 |
Review volume |
| 2022 |
500 |
1,500 |
Product sentiment |
| 2023 |
700 |
3,000 |
Rating trends |
| 2024 |
900 |
6,000 |
Customer response |
| 2025 |
1,200 |
12,000 |
Sentiment comparison |
| 2026 |
1,500+ |
25,000+ |
Product intelligence |
These numbers are illustrative monitoring benchmarks.
Combining price and customer feedback can reveal useful patterns. For example, a product may have a low price but weak ratings. Another product may command a higher price while maintaining stronger ratings.
Businesses can also monitor review changes after promotions or packaging changes.
Availability provides another signal. A product that frequently goes out of stock may have demand or supply issues. A product with consistently high availability and strong ratings may have a different competitive position.
This multi-dimensional approach helps brands understand online product performance beyond simple sales assumptions.
It also creates better inputs for category strategy, assortment planning, pricing analysis, and promotional decisions.
How Can Brands Build a Unified View of Their Biscuit Portfolios?
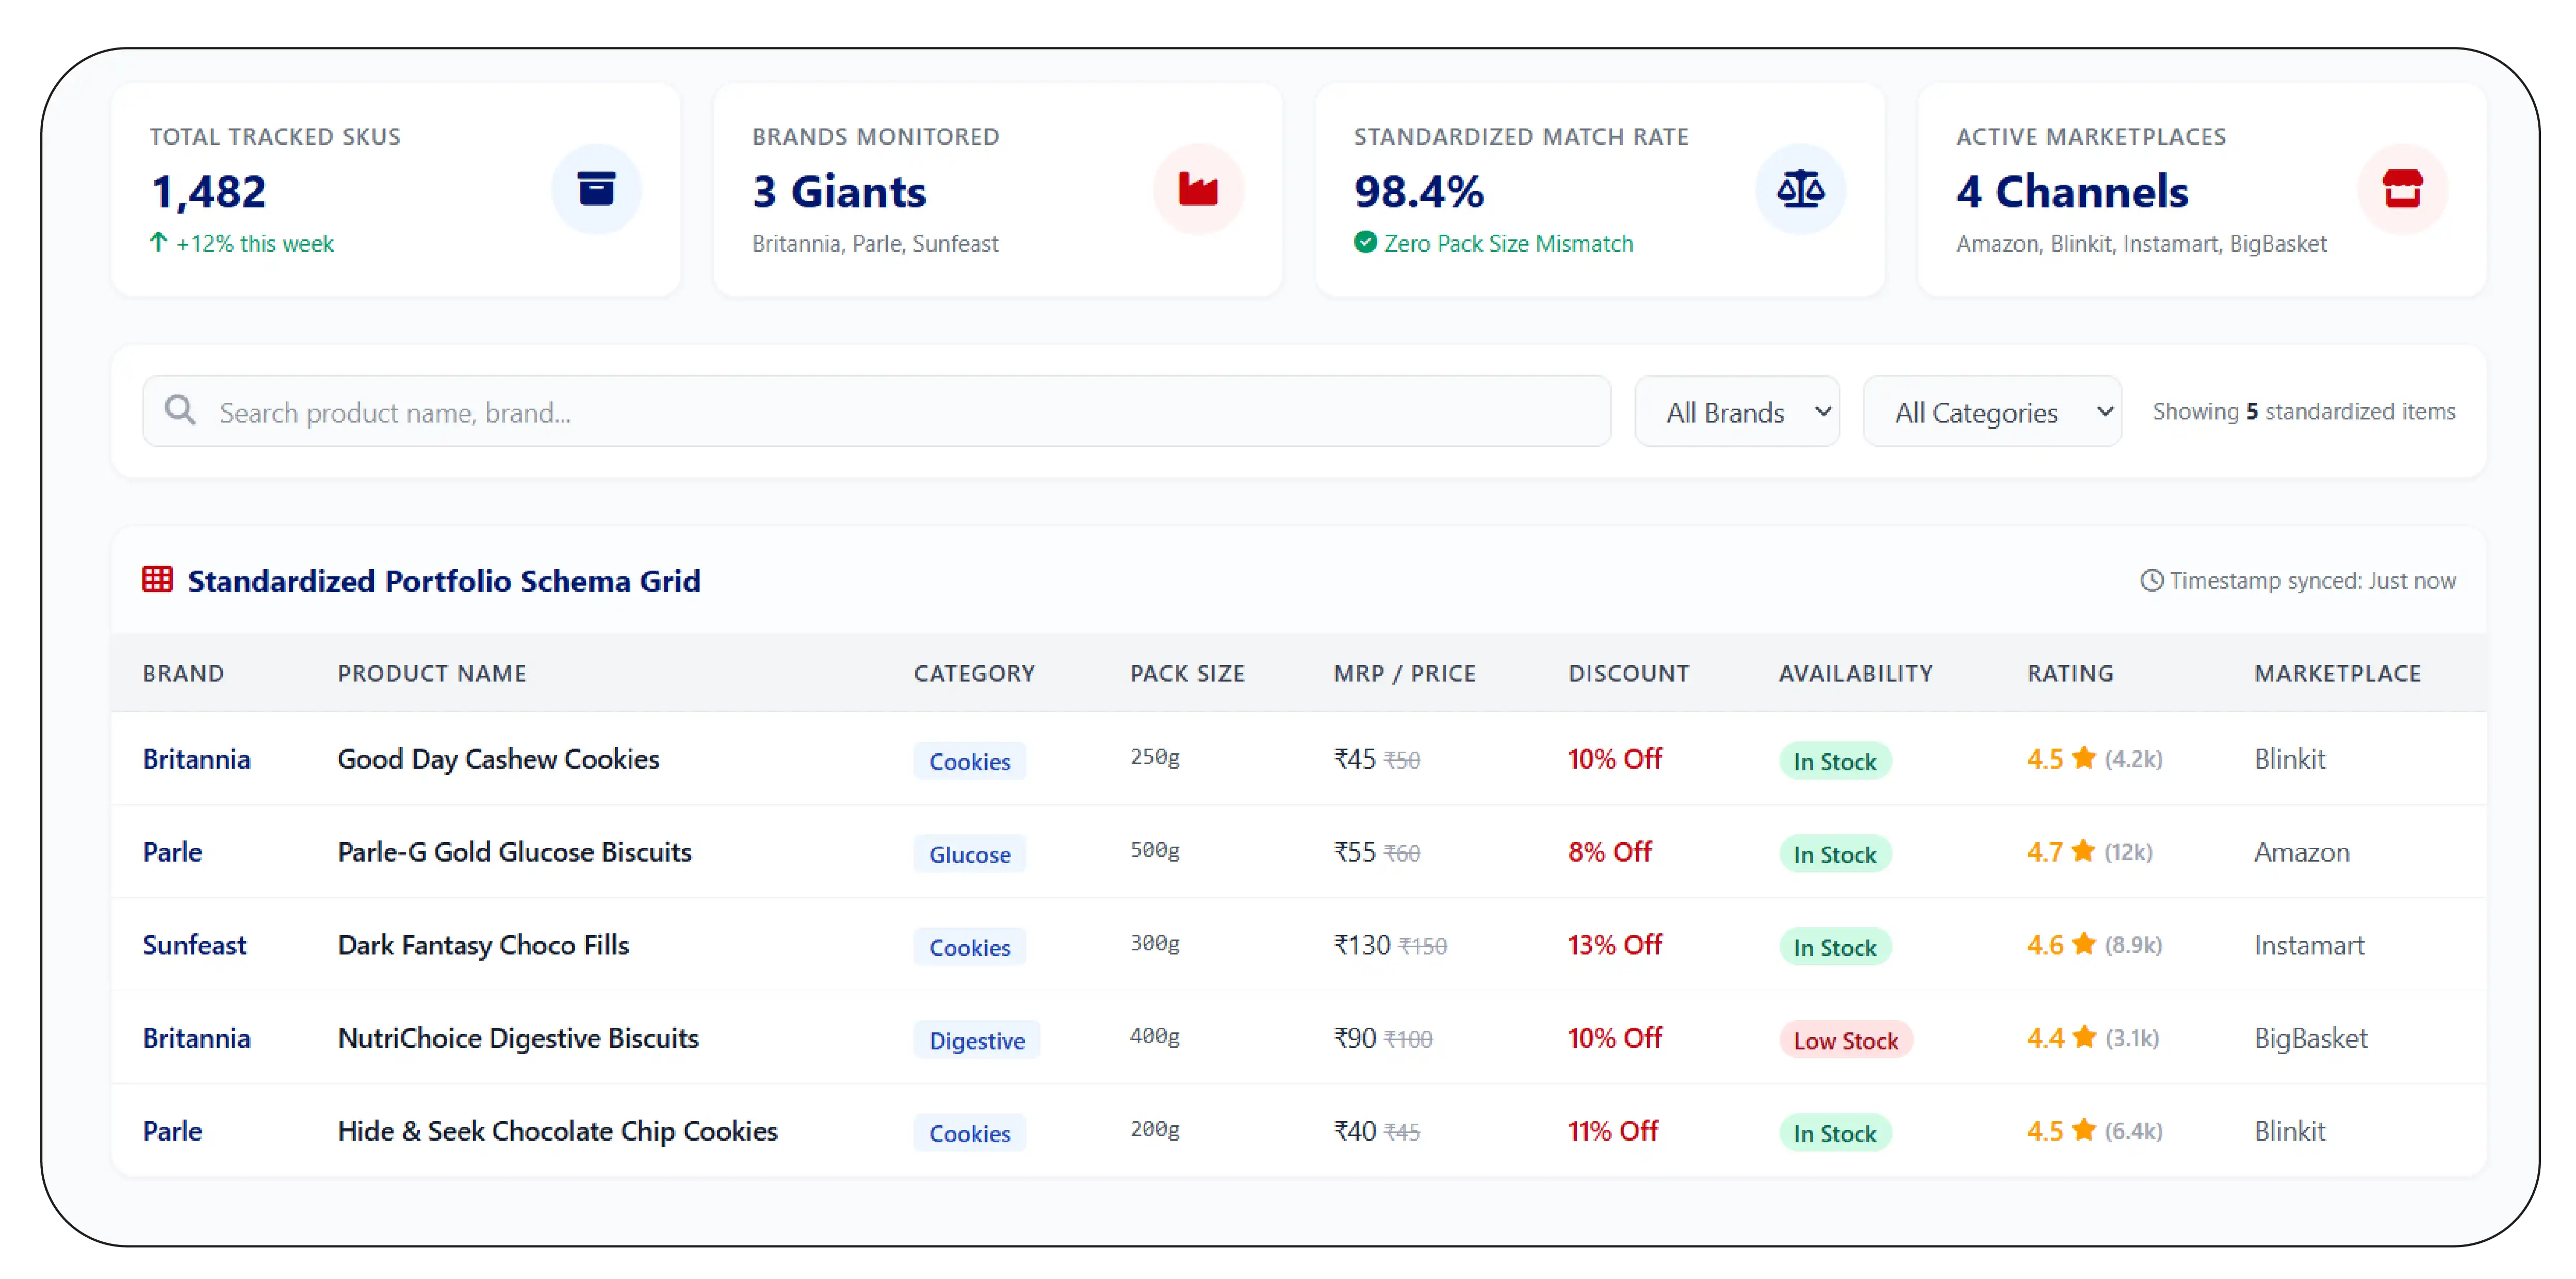
Comparing Britannia, Parle, and Sunfeast requires consistent data. Each marketplace can use different product names, descriptions, pack-size formats, and category structures.
A unified extraction workflow can Extract Britannia, Parle, and Sunfeast product data and standardize it into a common schema.
The dataset can include:
- Brand
- Product name
- Category
- Pack size
- MRP
- Selling price
- Discount
- Availability
- Ratings
- Reviews
- Product URL
- Marketplace
- Collection timestamp
Product matching is essential. A 500-gram pack should not be incorrectly compared with a 250-gram pack. Standardized product attributes help reduce these errors.
Illustrative Unified Dataset Scale (2020–2026)
| Year |
Illustrative Total SKUs |
Marketplaces |
Data Fields |
| 2020 |
800 |
2 |
6 |
| 2021 |
1,200 |
2 |
8 |
| 2022 |
1,800 |
3 |
10 |
| 2023 |
2,500 |
3 |
12 |
| 2024 |
3,500 |
4 |
14 |
| 2025 |
4,500 |
4 |
16 |
| 2026 |
5,000+ |
4+ |
18+ |
These figures illustrate how a unified dataset can expand over time.
Once standardized, the data can support cross-brand comparison.
A dashboard can show the average selling price for each brand. It can also display discount percentages, availability rates, rating averages, and price changes.
For category managers, this creates a single analytical view.
Instead of opening multiple marketplace pages, teams can work from structured records.
This also makes historical analysis easier. Businesses can compare current pricing with previous periods and identify significant changes.
The unified approach supports both brand-level and category-level analysis.
How Can Automated Data Collection Improve Biscuit Pricing Analysis?
Manual product monitoring becomes difficult when businesses track thousands of SKUs across multiple marketplaces. Product pages can change frequently. Prices and promotions can also update throughout the day.
An Automated biscuit data scraping API can help create recurring collection workflows for relevant marketplace information.
The Britannia, Parle, Sunfeast Market Analysis Dashboard can then organize this information into useful views for pricing teams, brand managers, and category analysts.
Automation can collect records at scheduled intervals. It can then normalize product fields and compare new records against historical data.
Illustrative Automation Scale (2020–2026)
| Year |
Illustrative SKUs |
Collection Frequency |
Business Application |
| 2020 |
800 |
Monthly |
Market research |
| 2021 |
1,200 |
Weekly |
Price comparison |
| 2022 |
1,800 |
Weekly |
Discount tracking |
| 2023 |
2,500 |
Daily |
Competitive analysis |
| 2024 |
3,500 |
Multiple/day |
Promotion monitoring |
| 2025 |
4,500 |
Hourly |
Price intelligence |
| 2026 |
5,000+ |
Near real-time |
Automated alerts |
These are illustrative figures.
A useful automated workflow should include validation. Incorrect product matches or incomplete records can reduce the value of a pricing dataset.
Change detection is also important. The system can identify when:
- A price changes.
- A discount starts or ends.
- A product becomes unavailable.
- A new product appears.
- A product listing disappears.
- A rating changes significantly.
These events can feed dashboards or alert systems.
Automation also makes historical storage easier. Every observation can include a timestamp. This creates a record of pricing movements over time.
For example, a category manager can examine how biscuit prices changed during a festival period. A brand manager can measure competitor discounts during a campaign.
The same data can support internal reporting.
This reduces manual effort and gives teams more time to focus on analysis and strategy.
How Can Businesses Track Biscuit Promotions and Discounts?
Promotions influence online biscuit pricing. Retailers may use percentage discounts, fixed-price offers, multi-pack deals, coupons, and other promotional mechanisms.
Biscuit promotions and discount tracking helps businesses identify these changes across marketplaces.
A monitoring workflow can record the original price, current price, discount amount, discount percentage, and collection time. It can then compare these values across platforms and periods.
Illustrative Promotion Tracking Scale (2020–2026)
| Year |
Illustrative Promotions Tracked/Month |
Average Platforms |
Primary Focus |
| 2020 |
500 |
2 |
Basic discounts |
| 2021 |
900 |
2 |
Promotional comparison |
| 2022 |
1,500 |
3 |
Campaign monitoring |
| 2023 |
3,000 |
3 |
Competitor promotions |
| 2024 |
6,000 |
4 |
Discount intensity |
| 2025 |
12,000 |
4 |
Promotion frequency |
| 2026 |
25,000+ |
4+ |
Automated promotion intelligence |
These figures are illustrative.
Discount tracking can reveal several useful patterns.
First, businesses can identify which products receive frequent promotions.
Second, they can compare discount levels across marketplaces.
Third, they can determine whether promotions are short-term or persistent.
Fourth, they can monitor competitor campaign timing.
For example, if a competitor repeatedly discounts a specific biscuit pack during weekends, a brand can identify that pattern through historical monitoring.
Promotion data can also be combined with availability. A large discount may have limited impact if the product is unavailable.
The same data can support category planning. Teams can determine which products are highly promotional and which products maintain stable pricing.
Price history is especially useful here. A current discount does not tell the complete story. Historical records show how often the product was discounted and how long the promotion lasted.
This creates a more accurate view of competitive pricing behavior.
Why Should Businesses Choose a Specialized Data Partner?
Modern FMCG pricing programs need scalable collection, structured datasets, historical storage, and flexible delivery. A specialized data partner can bring these capabilities together.
Grocery data scraping can help businesses collect structured information across online grocery and retail marketplaces.
A centralized Britannia, Parle, Sunfeast Market Analysis Dashboard can then turn that information into practical pricing and category insights.
Key advantages include:
- Scalable data collection: Track thousands of products across multiple marketplaces.
- Structured information: Standardize prices, pack sizes, discounts, ratings, and availability.
- Historical tracking: Store observations for long-term trend analysis.
- Automated refreshes: Schedule data collection based on business requirements.
- Competitive benchmarking: Compare brands and marketplaces using consistent metrics.
- Custom outputs: Deliver datasets for dashboards, databases, analytics tools, and reporting systems.
The approach can start with a focused biscuit category and expand into cookies, crackers, snacks, breakfast products, and other FMCG categories.
Businesses can also select specific cities, product groups, brands, and marketplaces.
This flexibility makes the solution suitable for FMCG manufacturers, distributors, retailers, agencies, and market intelligence teams.
The goal is simple. Turn fragmented marketplace information into reliable data that supports faster decisions.
Conclusion
Online biscuit pricing changes constantly. Britannia, Parle, and Sunfeast compete across multiple categories, pack sizes, price points, and promotional strategies. BigBasket, Blinkit, Amazon, and Flipkart add another layer of complexity because each marketplace can display different prices, discounts, availability, and customer signals.
Promotion and deal intelligence helps brands understand when competitors change prices and how frequently they use discounts. Historical datasets also reveal seasonal patterns and long-term pricing movements.
A centralized Britannia, Parle, Sunfeast Market Analysis Dashboard gives category teams a clearer view of these signals.
Businesses can compare prices, monitor promotions, analyze customer feedback, track assortment changes, and identify competitive gaps.
Partner with Product Data Scrape to build a customized FMCG biscuit pricing intelligence solution that tracks your brands, competitors, marketplaces, products, and promotions!
FAQs
1. What can a biscuit market analysis dashboard track?
A dashboard can track product prices, discounts, availability, pack sizes, ratings, reviews, promotions, assortment changes, and competitor pricing across multiple online marketplaces.
2. Which marketplaces can be monitored for biscuit pricing?
Businesses can monitor platforms such as BigBasket, Blinkit, Amazon, and Flipkart to compare biscuit prices, discounts, availability, and product positioning across digital retail channels.
3. Why is historical biscuit pricing data important?
Historical data helps identify price trends, seasonal movements, promotional frequency, competitor strategies, and long-term changes that cannot be understood from a single marketplace snapshot.
4. Can biscuit customer reviews be included?
Yes. Where publicly available, customer ratings and reviews can be collected and structured alongside product information. This supports sentiment, product performance, and customer response analysis.
5. Can Product Data Scrape provide customized FMCG datasets?
Yes. Product Data Scrape can create customized datasets based on selected brands, SKUs, marketplaces, locations, pricing fields, promotional attributes, ratings, reviews, and required collection frequency.


 Singapore
 EMAIL
EMAIL
 PHONE
PHONE















.webp)






