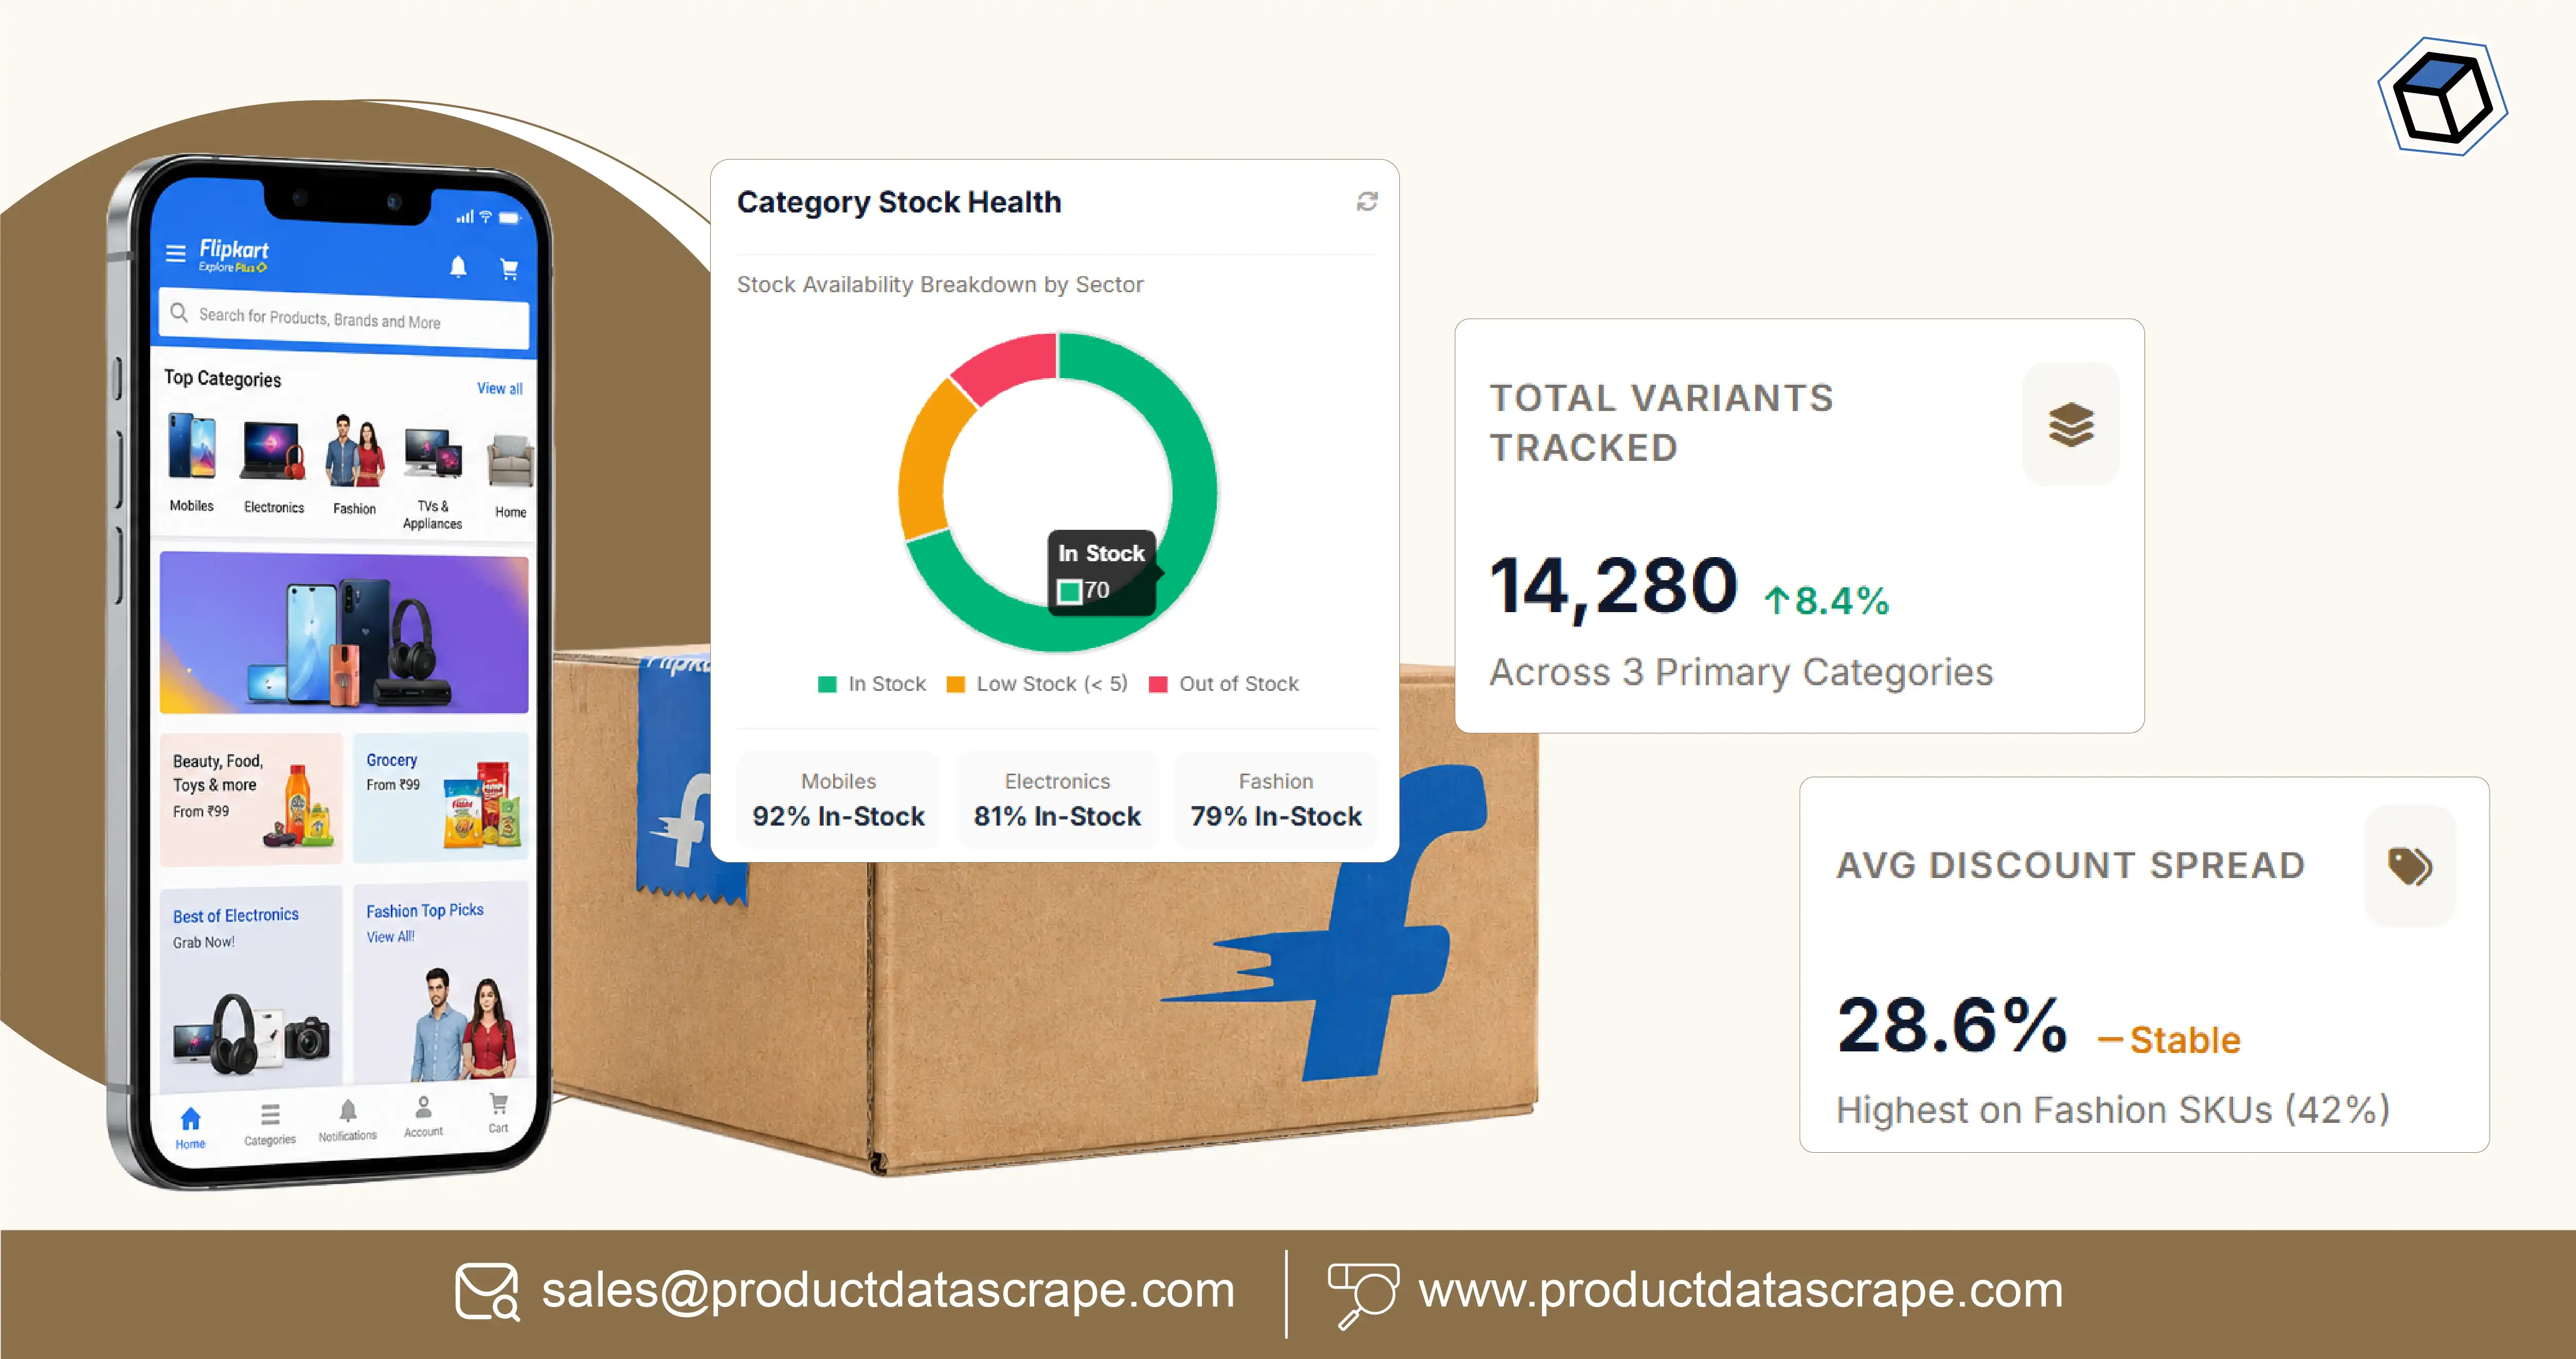
Introduction
"In stock" is the most misleading field in e-commerce.
Not because it is wrong — the product page renders it honestly. It is misleading because of what it hides. A listing can be entirely, truthfully "in stock" while the two sizes that account for most of its sales have been unavailable for three weeks. It can be "in stock" while the storage configuration everyone actually wants sold out on the first morning of the sale, leaving only the one nobody buys.
The customer who wanted a medium does not see "in stock." They see that there is no medium. Then they leave.
This is the central problem that Flipkart variant data extraction solves, and it is one of the few problems in marketplace analytics where the fix is unglamorous, immediate, and almost always finds money.
A Flipkart "Product" Is Not a Product
On Flipkart, the unit that carries a price and the unit that carries stock are the same thing, and it is not the product page. It is the variant.
| Category |
The variant matrix |
Typical size |
| Mobiles |
RAM × storage × colour |
6–18 variants |
| Fashion |
Size × colour |
15–60 variants |
| Televisions |
Screen size × model year × panel type |
4–12 variants |
| Laptops |
Processor × RAM × storage × screen |
8–30 variants |
| Large appliances |
Capacity × finish × energy rating |
5–15 variants |
| FMCG and grocery |
Pack size × flavour × multipack |
4–20 variants |
A pipeline that returns one row per product page is returning one row for a commercial object that has, in the fashion case, sixty independent price-and-stock realities inside it.
The Four Failures of Flattening
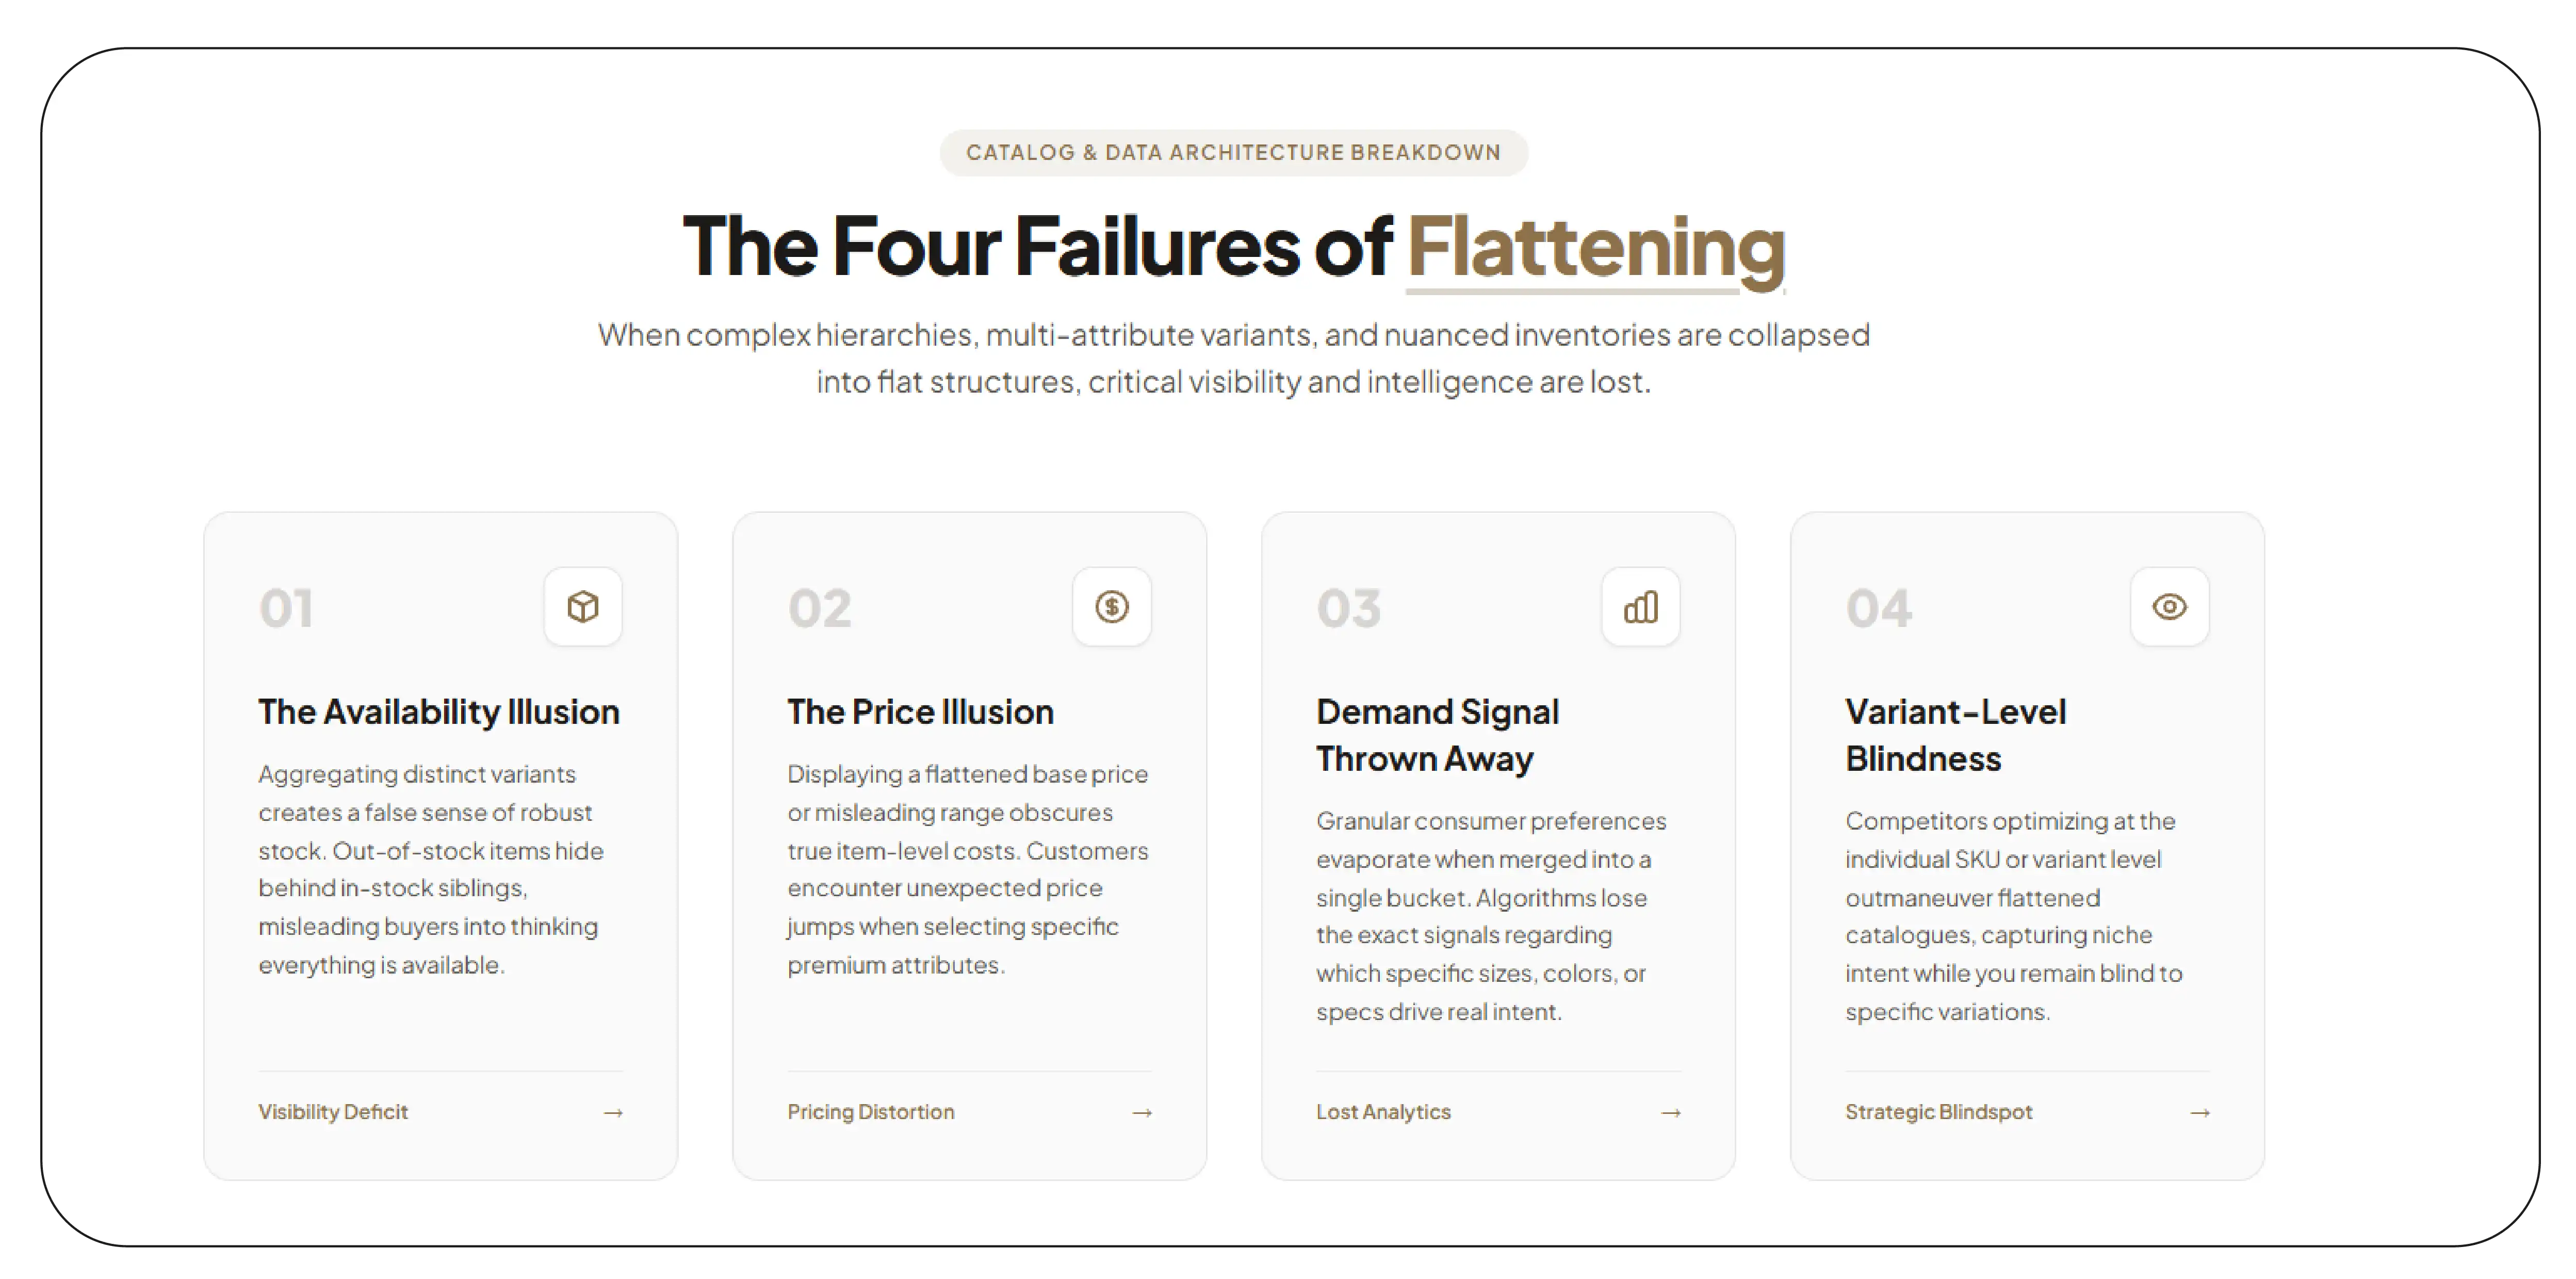
1. The availability illusion
This is the expensive one.
A listing is marked in stock if any variant is purchasable. So a hero style with sizes XS through XXL, where M and L — the two sizes representing the bulk of demand — have been sold out for a fortnight, reports as available. Nothing in the dashboard fires. Nothing in the supply review escalates. The listing looks healthy right up until someone eventually asks why conversion has halved.
The revenue is not lost slowly. It is lost immediately and continuously, and it is invisible.
2. The price illusion
Variants carry different prices. A generic scraper captures whichever price the page renders first — usually the cheapest or the default variant. So a mobile "priced at 24,999" is priced at 24,999 in the 6 GB / 128 GB configuration, and at 33,999 in the 12 GB / 512 GB configuration.
If your competitive benchmark compares your 8 GB / 256 GB price against a competitor's captured price — which happens to be their base variant — you are not comparing two prices. You are comparing two different products and drawing conclusions from the difference.
3. The demand signal that gets thrown away
Per-variant stock, captured over time, is a demand signal you get for free.
The variant that goes out of stock first, and fastest, and most often, is the variant the market wants. That is information a merchandising team would otherwise pay for through survey work or infer from lagging sell-through reports. It is sitting in the availability field, and it is discarded by every pipeline that flattens.
4. Competitive blindness at the variant level
Your competitor lists eleven variants of their hero SKU. You list six. Their range covers three price bands; yours covers two. Their entry-level configuration sits fifteen hundred rupees below your cheapest option, which means they appear in a filter bracket you do not appear in at all.
None of this is visible from product-level data. All of it is visible from variant-level data, and all of it is directly actionable.
The Fields
| Field |
Description |
| variant_id |
Platform identifier for the variant |
| variant_label |
Human-readable configuration ("8 GB / 256 GB", "M / Navy") |
| variant_attributes |
Structured — {ram: "8GB", storage: "256GB", colour: "Midnight Blue"} |
| variant_price |
Listed price for this configuration |
| variant_plus_price |
Flipkart Plus price for this configuration |
| variant_mrp |
MRP for this configuration |
| in_stock |
Purchasable at capture time |
| stock_signal |
Low-stock indicators where surfaced ("few left", quantity hints) |
| is_default_variant |
Which configuration the page opens on |
| variant_seller |
Which seller serves this variant — it is not always the same seller |
| variant_f_assured |
Badge status at the variant-seller level |
| captured_at |
Timestamp — mandatory for stockout duration |
Two of these deserve a note.
variant_seller surprises people. The seller who wins the default position on the base configuration is not always the seller who wins it on the premium configuration. On contested SKUs, different sellers hold different variants. If you are only capturing the product-level default seller, you are seeing one cell of a grid.
captured_at is what converts a stockout from a status into a duration. "Out of stock" is not actionable. "Out of stock for eleven consecutive days, across every capture" is an escalation.
Sample Data: One Product, One Variant Matrix
An illustrative capture for a fashion SKU. Structured attributes make the matrix analysable rather than merely readable.
{
  "product_id": "TSHRT9K2QP7WZXY",
  "title": "BrandF Cotton Crew Neck T-Shirt",
  "brand": "BrandF",
  "category": "Fashion > Men > T-Shirts",
  "captured_at": "2026-07-14T10:22:31+05:30",
  "pincode": "560001",

  "product_level_in_stock": true,

  "variants": [
    {"variant_label": "S / Navy",   "attributes": {"size": "S",   "colour": "Navy"},   "variant_price": 799, "in_stock": true,  "stock_signal": null,        "seller": "PartnerA"},
    {"variant_label": "M / Navy",   "attributes": {"size": "M",   "colour": "Navy"},   "variant_price": 799, "in_stock": false, "stock_signal": "out_of_stock", "seller": "PartnerA"},
    {"variant_label": "L / Navy",   "attributes": {"size": "L",   "colour": "Navy"},   "variant_price": 799, "in_stock": false, "stock_signal": "out_of_stock", "seller": "PartnerA"},
    {"variant_label": "XL / Navy",  "attributes": {"size": "XL",  "colour": "Navy"},   "variant_price": 799, "in_stock": true,  "stock_signal": "few_left",  "seller": "PartnerA"},
    {"variant_label": "XXL / Navy", "attributes": {"size": "XXL", "colour": "Navy"},   "variant_price": 799, "in_stock": true,  "stock_signal": null,        "seller": "PartnerA"},
    {"variant_label": "S / Black",  "attributes": {"size": "S",   "colour": "Black"},  "variant_price": 799, "in_stock": true,  "stock_signal": null,        "seller": "PartnerA"},
    {"variant_label": "M / Black",  "attributes": {"size": "M",   "colour": "Black"},  "variant_price": 749, "in_stock": true,  "stock_signal": null,        "seller": "PartnerB"},
    {"variant_label": "L / Black",  "attributes": {"size": "L",   "colour": "Black"},  "variant_price": 749, "in_stock": false, "stock_signal": "out_of_stock", "seller": "PartnerB"}
  ]
}
The analyst's view:
| Size |
Navy |
Black |
Combined availability |
| S |
In stock |
In stock |
✅ |
| M |
Out |
In stock (different seller, lower price) |
⚠️ Partial |
| L |
Out |
Out |
❌ Unavailable in any colour |
| XL |
Few left |
— |
⚠️ |
| XXL |
In stock |
— |
✅ |
product_level_in_stock: true.
Size L is unpurchasable in every colour. Size M is available only in one colour, from a different seller, at a different price — meaning the brand's own price ladder has an inconsistency it does not know about.
A product-level pipeline reports this listing as healthy.
The Four Analyses Variant Data Unlocks
1. Variant-level lost revenue
The most direct output, and usually the one that pays for the programme in the first month.
lost_revenue ≈ Σ (days_out_of_stock × variant_daily_velocity × variant_price)
You supply the velocity from your own sales data. The stockout duration comes from the captured time series. Nothing else is needed, and no other data source can produce the duration retrospectively — if you were not capturing it, that number is simply gone.
2. Price ladder integrity
Your variant price ladder is a strategy: the base configuration hits an entry price band, the mid configuration carries the volume, the premium configuration carries the margin. When one variant's price is set by a different seller — or when a seller undercuts a single rung — the ladder breaks in a way that is invisible unless you look at the whole matrix at once.
The sample above shows exactly this: the black M sits fifty rupees below every other variant, from a different seller. That is a broken rung.
3. Assortment coverage against a competitor
A matched variant matrix — yours against theirs — answers questions that product-level data cannot even pose:
- Which configurations do they offer that we do not?
- Which price bands do they occupy that we are absent from?
- Which colours or sizes are they consistently in stock on while we are not?
The third question is often the most valuable. Consistent availability on a variant where your competitor is chronically out of stock is a competitive position you may already hold and not know about.
4. Demand inference from stockout velocity
Rank variants by how quickly and how often they stock out. That ranking is your true demand curve, revealed by the market, updated continuously, and available without a single survey.
For fashion in particular — where size curves are notoriously hard to plan and notoriously wrong — this is the highest-value output of the entire dataset.
Category-Specific Notes
Mobiles. The RAM/storage matrix is where the margin lives. The base configuration is a traffic instrument; the mid configuration is the volume; the premium configuration is the profit. Stockouts on the mid configuration are the most damaging and the most common, because they are the hardest to forecast.
Fashion. The size curve is the whole game. M and L stockouts on a hero style are not a supply problem — they are a conversion problem, and they show up in your marketing dashboard as a rising cost per acquisition long before anyone connects it to inventory.
Electronics and appliances. Configuration and finish variants often have different sellers and different F-Assured status. The variant grid and the seller grid interact, and neither is legible without the other.
Building the Pipeline
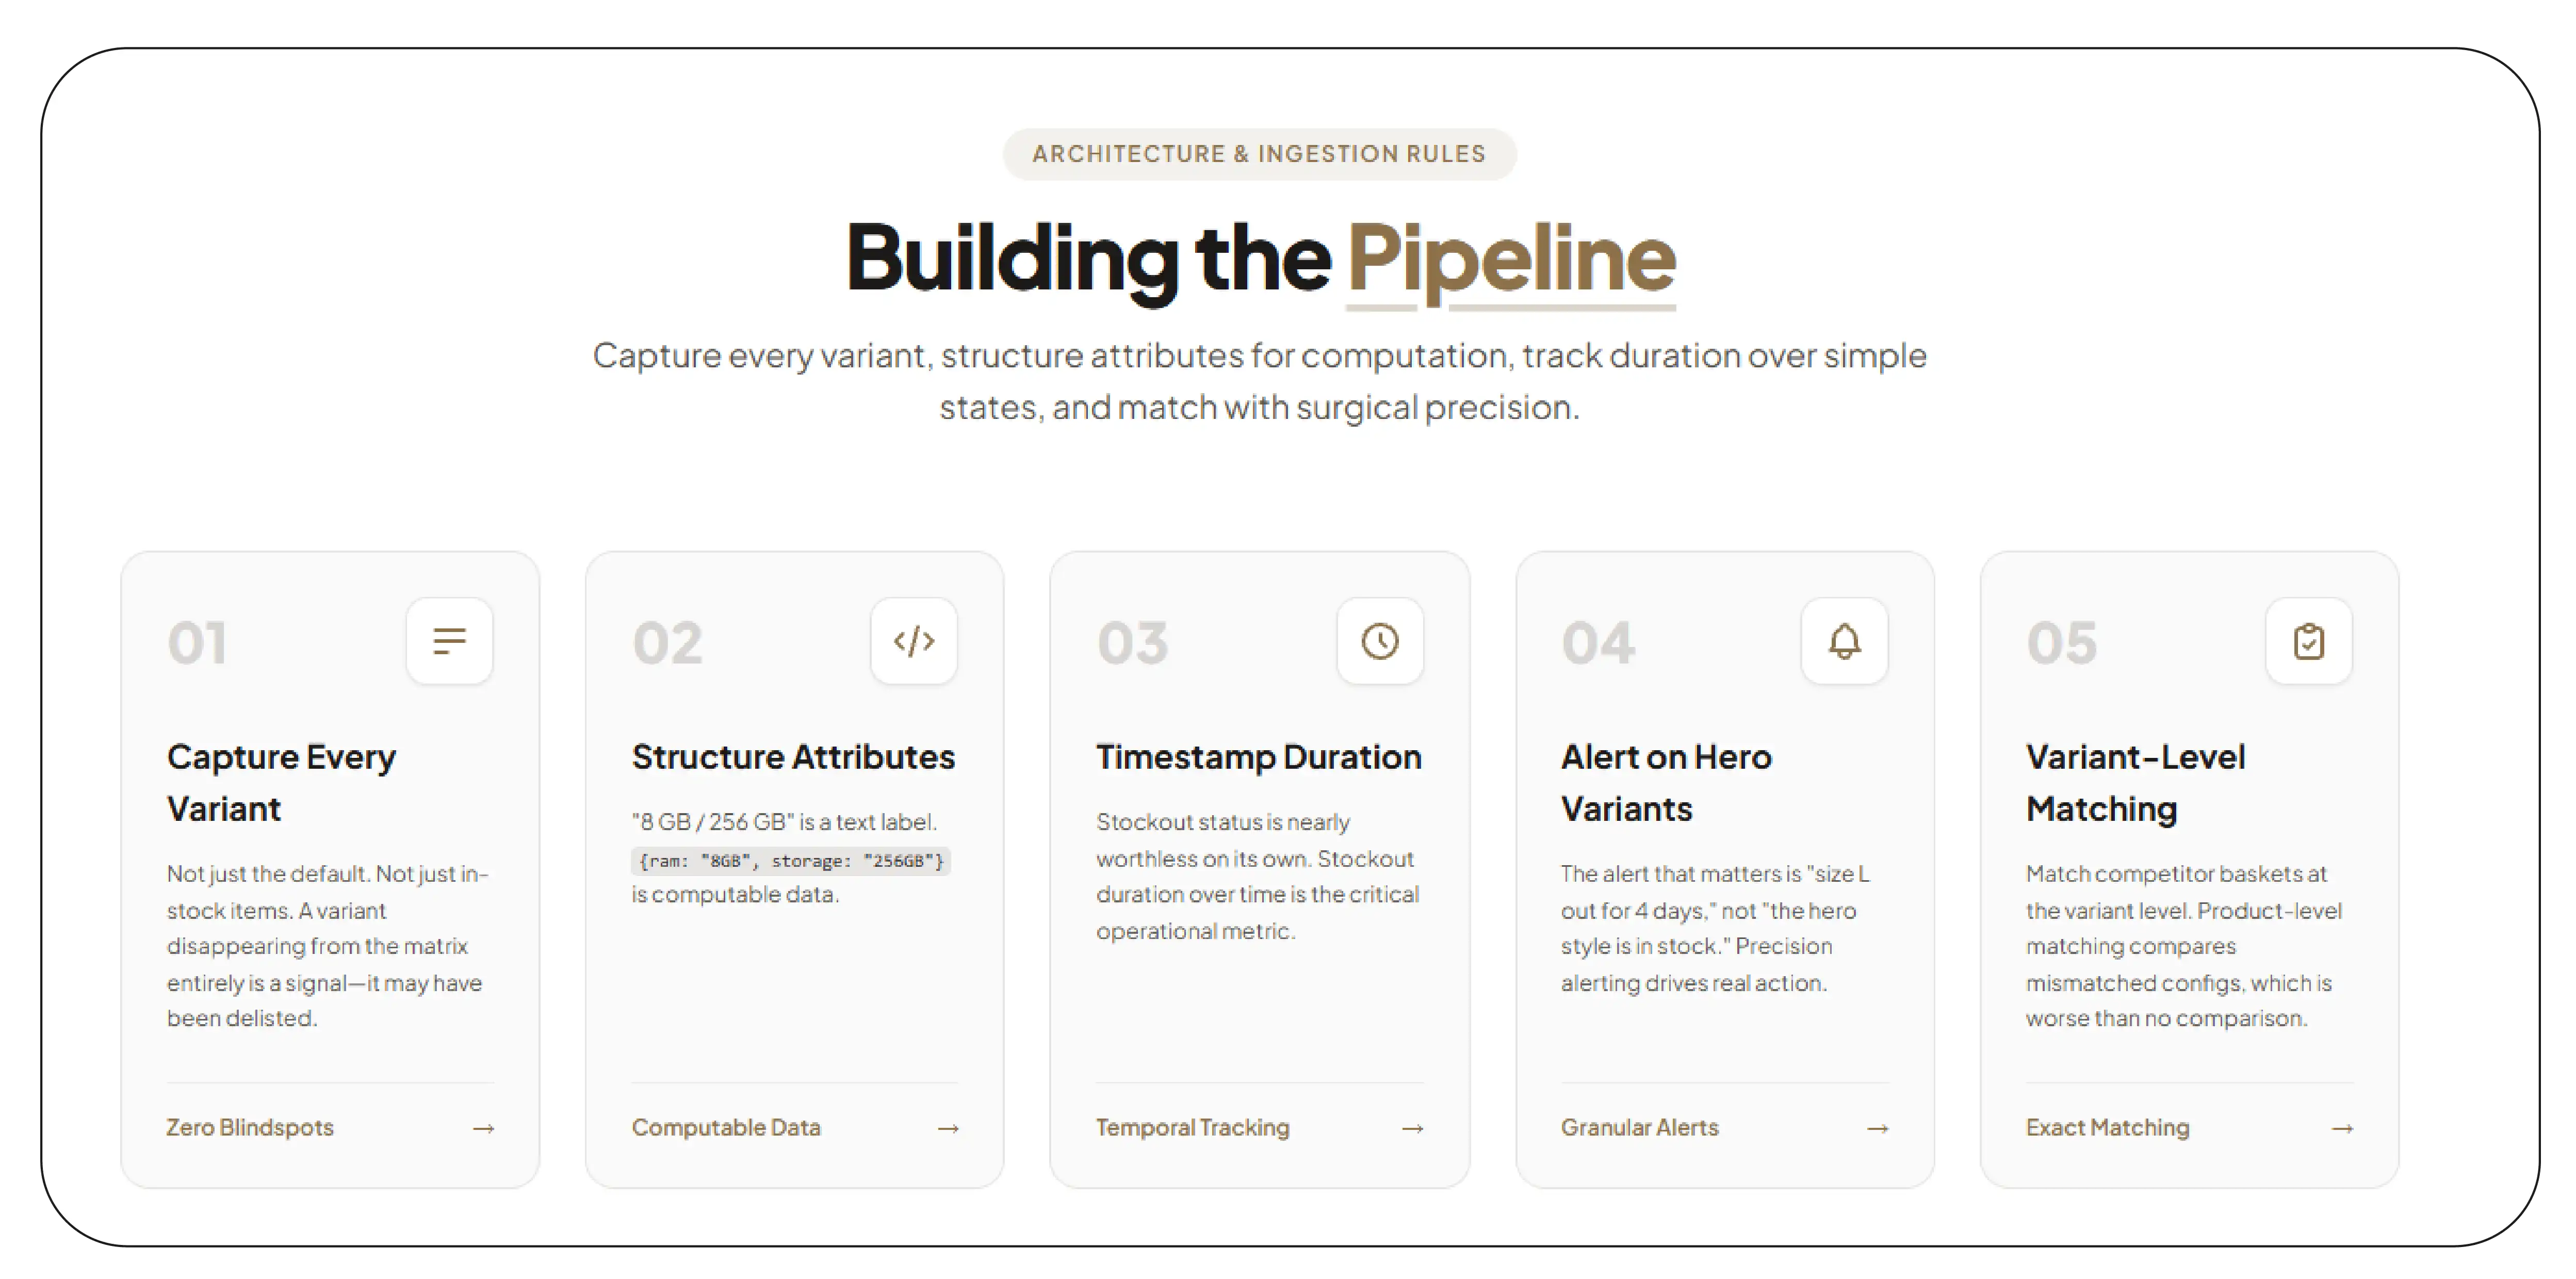
Capture every variant, every time. Not just the default. Not just the in-stock ones. A variant that disappears from the matrix entirely is itself a signal — it may have been delisted.
Structure the attributes. "8 GB / 256 GB" is a label. {ram: "8GB", storage: "256GB"} is data. Only the second can be grouped, filtered, or matched against a competitor's matrix.
Timestamp for duration. Stockout status is nearly worthless. Stockout duration is the metric.
Alert on hero variants, not hero products. The alert that matters is "size L on the hero style has been out for four days," not "the hero style is in stock."
Match against a competitor basket at the variant level. Product-level competitor matching produces comparisons between different configurations, which is worse than no comparison at all.
Frequently Asked Questions
How many variants can you capture per product?
The full matrix, regardless of depth — including fashion listings running to several dozen size and colour combinations.
Do you capture stock, or just price?
Both, per variant, with low-stock signals where the platform surfaces them, and with timestamps that make stockout duration computable.
Can you tell us which variant a competitor is out of stock on?
Yes — competitor variant matrices are captured on exactly the same schema, which is what makes matched comparison possible.
How often should variant data be captured?
Daily as a baseline; several times a day on hero SKUs; every 15 minutes during sale events, when variants sell through fast enough that a daily snapshot misses the entire episode.
What formats do you deliver in?
JSON with nested variant arrays, flattened CSV, REST API, or direct pushes to your warehouse.
Stop Reporting "In Stock"
Your bestselling size is probably out of stock somewhere right now, on a listing your dashboard is reporting as healthy. You will find out in six weeks, from a conversion report, and you will not be able to reconstruct how long it lasted.
Product Data Scrape delivers Flipkart variant data extraction across the full matrix — per-variant pricing, per-variant stock with low-stock signals, structured variant attributes, variant-level seller and F-Assured status, and timestamped capture that turns stockouts into durations.
Ask us for a variant-level diagnostic on your hero SKUs. It is the fastest way we know to find revenue you are already losing.
Product Data Scrape — turning marketplace complexity into decision-ready data.


 Singapore
 EMAIL
EMAIL
 PHONE
PHONE















.webp)






