Executive Summary
Quick commerce is described in minutes. It is decided in metres.
The public conversation about India's 10-minute delivery services is conducted at the level of cities and promises — we operate in eleven metros, we deliver in ten minutes. Both statements can be true and neither is useful, because coverage is not a city-level property and delivery time is not a constant.
This study examines Flipkart Quick dark store coverage across a pincode panel spanning Indian metros, and finds that the operative facts about the service are all sub-city: coverage collapses toward the periphery, the observed ETA distribution is far wider than the headline promise, assortment depth varies substantially between stores in the same city, and availability degrades sharply at the evening peak — the moment demand is highest.
Headline findings:
Coverage is a gradient, not a footprint. It falls off sharply from the metro core outward, and the boundary is ragged rather than circular.
The observed ETA distribution is wide. The headline promise describes the best case, not the median, and the spread widens with distance from the core and with time of day.
Assortment is a curated subset, and the subset differs by store — sometimes materially, within the same city.
Evening availability degrades. Stockout rates rise at exactly the point in the day when demand peaks.
This report is published by Product Data Scrape. Figures are representative of observed patterns across our monitoring panel and are illustrative rather than a market census.
1. Methodology
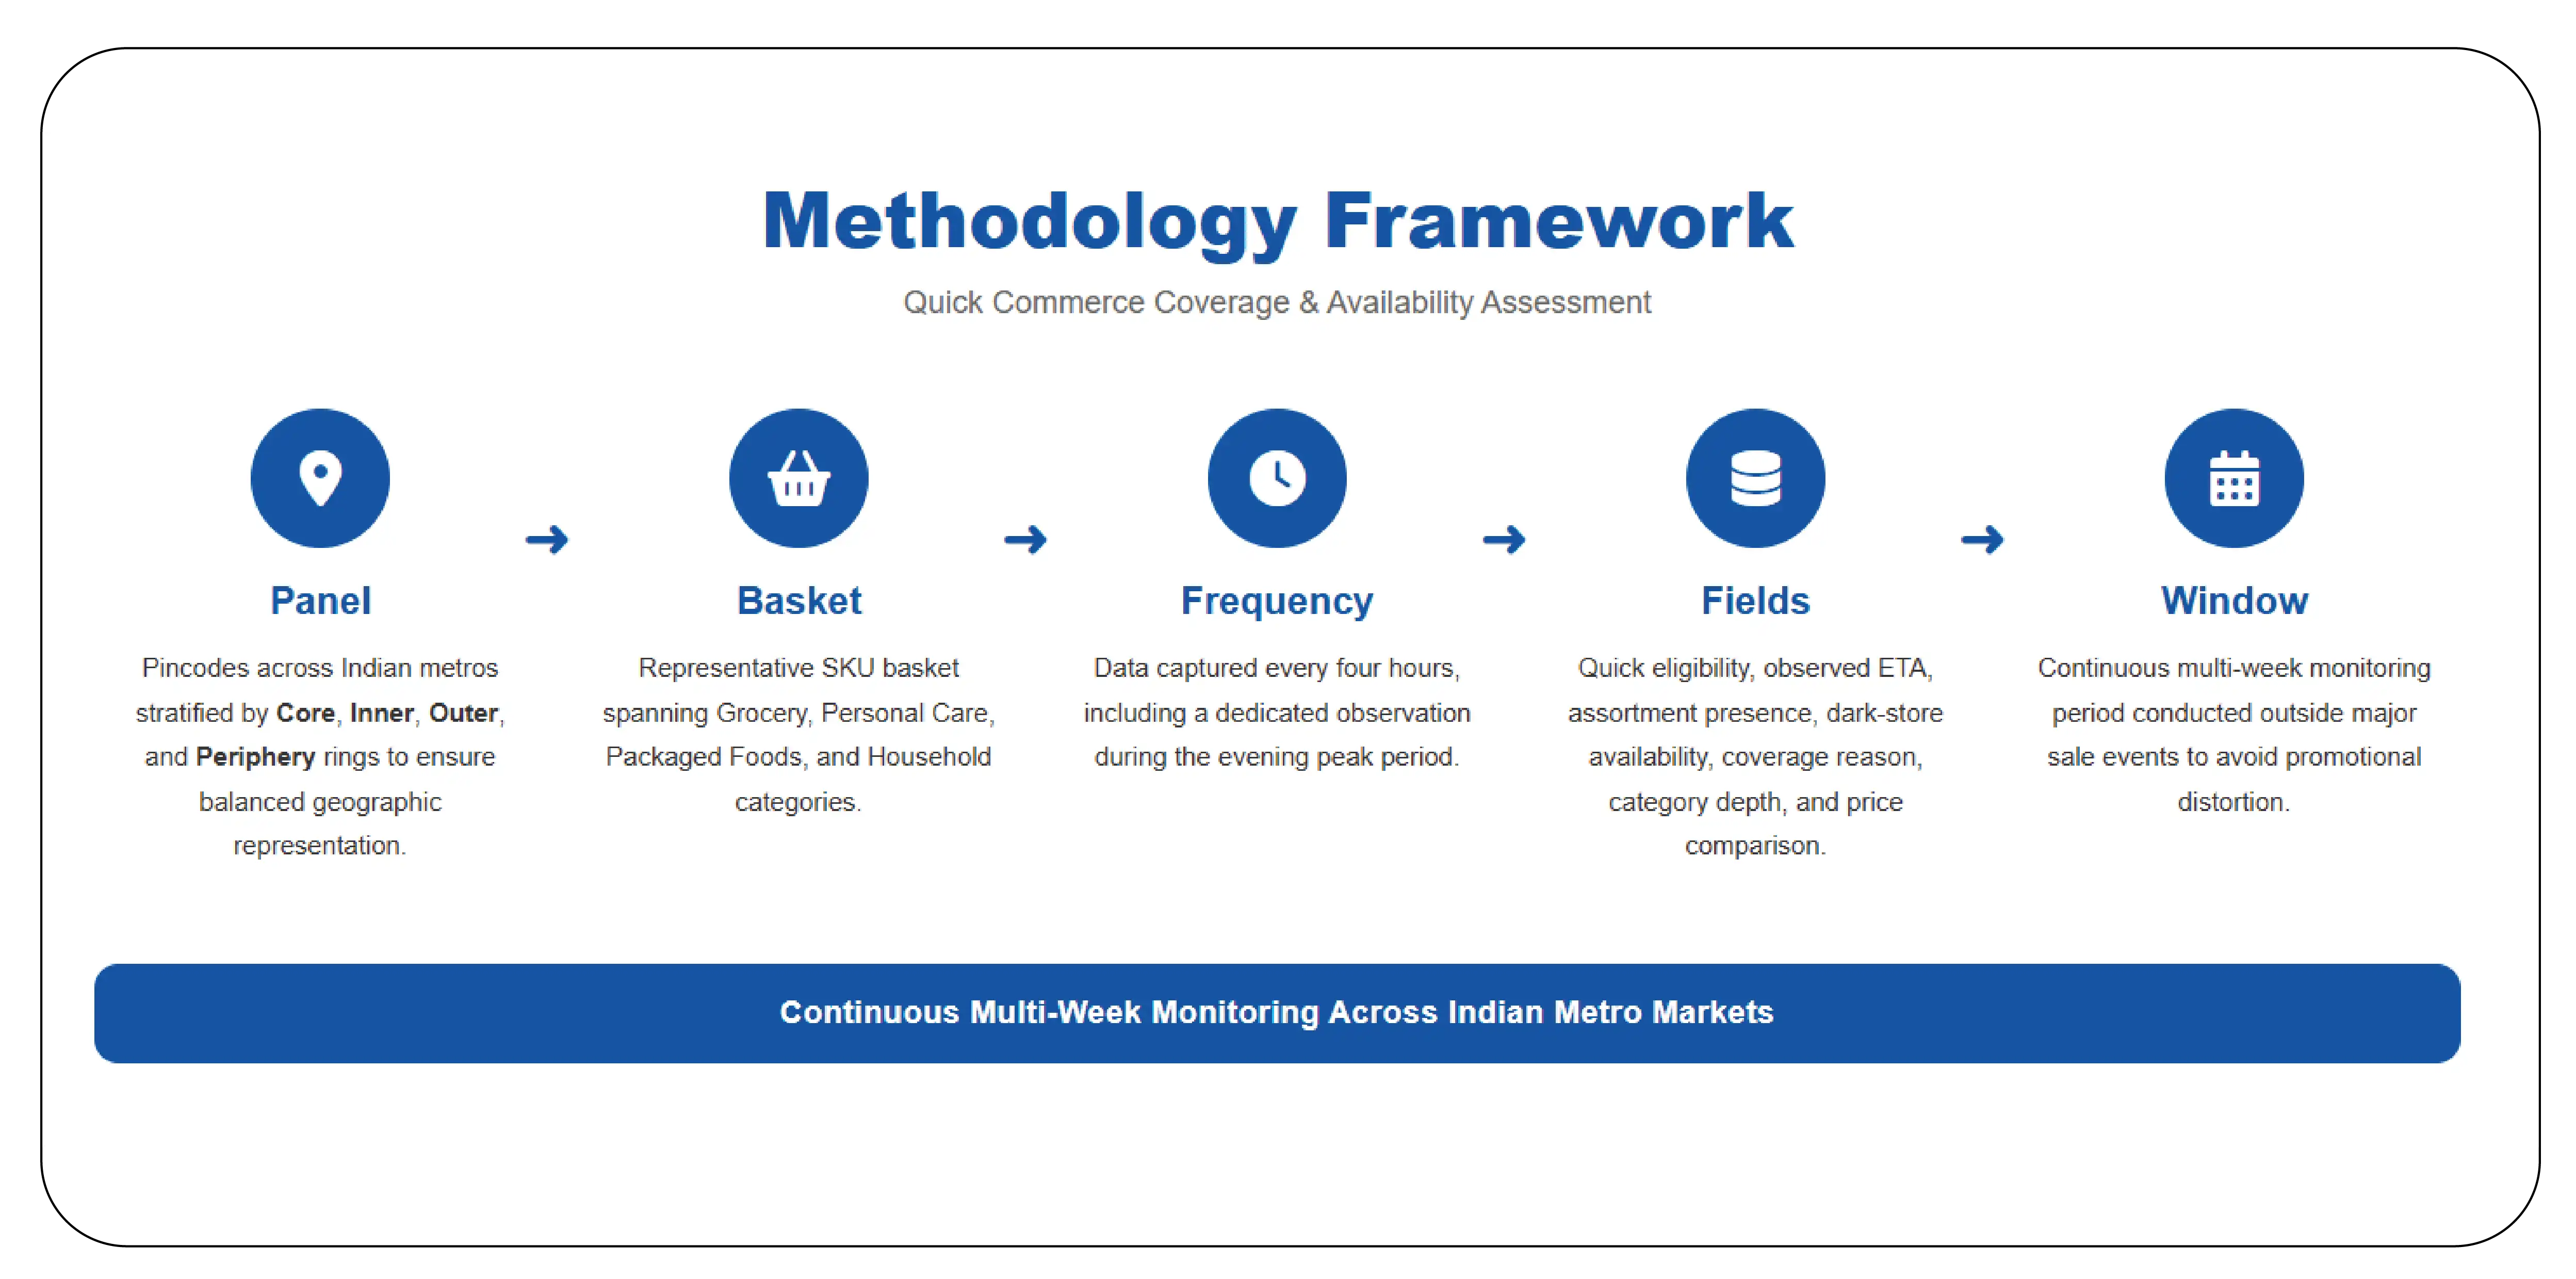
- Panel: Pincodes across Indian metros, stratified by ring — core, inner, outer, periphery — so that each ring is represented rather than sampled by convenience. Convenience sampling in q-commerce almost always oversamples the core, which is exactly where the service looks best.
- Basket: A representative SKU basket across grocery, personal care, packaged foods, and household categories.
- Frequency: Every four hours, including a capture inside the evening peak window.
- Fields: Quick eligibility, observed ETA, assortment presence, dark-store availability, availability reason (not assorted / out of stock / no coverage), category depth, Quick price versus main marketplace price.
- Window: A continuous multi-week window outside any major sale event.
A methodological note that materially affects the results: we distinguish no coverage, not assorted, and out of stock. Most q-commerce analysis collapses these into a single "unavailable" state. They are three different findings, owned by three different functions, and collapsing them destroys most of the value of the dataset.
2. Finding One: Coverage Is a Gradient
| Ring |
Panel Pincodes |
Quick Coverage % |
Median Observed ETA |
| Core |
— |
~91% |
~12 min |
| Inner |
— |
~78% |
~15 min |
| Outer |
— |
~44% |
~22 min |
| Periphery |
— |
~11% |
~29 min |
Illustrative figures.
Coverage roughly halves between the inner and outer rings, then collapses at the periphery.
The boundary is also ragged. Adjacent pincodes in the outer ring frequently differ — one covered, one not — which reflects dark-store siting decisions rather than any clean radial logic. The practical consequence is that a coverage map cannot be modelled. It has to be measured. Any analysis that assumes a serving radius around a known store location will misstate coverage in the ring where the answer actually matters.
Implication for brands: your addressable q-commerce market is not the metro population. It is the population inside the covered pincodes, and that is a substantially smaller and more precisely locatable number.
Implication for operators: the outer ring is where competitive coverage is genuinely contested, and it is the only ring where entry does not mean fighting a well-supplied incumbent on its strongest ground.
3. Finding Two: The ETA Distribution Is Wide
The promise is a number. The reality is a distribution.
| Ring |
25th percentile ETA |
Median ETA |
75th percentile ETA |
| Core |
~9 min |
~12 min |
~17 min |
| Inner |
~11 min |
~15 min |
~22 min |
| Outer |
~16 min |
~22 min |
~31 min |
Illustrative figures.
Two patterns hold consistently. ETAs widen with distance from the core, and they widen again at peak hours — the evening window shows both a higher median and a substantially longer tail.
Implication: competitive ETA comparison must be conducted at the pincode-and-hour level. A city-level ETA average tells you almost nothing, and it flatters whichever operator has the most core-concentrated footprint. In the outer ring at peak, the observed ETA gap between competing services is frequently small enough that speed is not the deciding variable at all — which changes the basis on which an entrant should compete.
4. Finding Three: Assortment Is a Curated Subset, and It Varies by Store
A dark store carries a fraction of the main marketplace catalogue. That is by design — it is a small physical space optimised for pick speed.
What is less widely appreciated is that the subset differs between stores in the same city.
| Metric |
Observed range across panel |
| Category depth (SKUs carried per category, per store) |
Wide — the deepest stores carried roughly twice the SKU count of the thinnest |
| Share of a brand's catalogue assorted |
Varies by store within the same city |
| Pack-size skew |
Consistently toward small, high-turn packs |
Illustrative.
The pack-size finding is the most actionable in the study. Dark stores systematically favour small, fast-moving pack formats — the economics of a constrained shelf demand it.
Implication: a brand whose q-commerce range is weighted toward large or family packs is losing the slot fight before price or promotion enters the conversation. The correct response is a pack strategy, not a discount. This is one of the few findings we produce that regularly changes a brand's product roadmap rather than its pricing.
5. Finding Four: Evening Availability Degrades
The most consequential operational finding.
| Capture window |
Median availability (basket) |
Stockout rate |
| Morning (~09:00) |
High |
Low |
| Midday (~13:00) |
High |
Low–moderate |
| Evening peak (~19:00–21:00) |
Materially lower |
Substantially higher |
| Late (~23:00) |
Partially recovered |
Moderate |
Illustrative.
Availability degrades at the evening peak — which is to say, availability is worst at the moment demand is greatest. This is not a failure specific to any operator; it is the structural consequence of shallow inventory meeting concentrated demand, and it is visible across the sector.
Implication for brands: any q-commerce availability metric captured only in the morning is systematically overstating your availability, and overstating it by the most in the window that generates the most revenue. If you capture once a day, capture in the evening.
Implication for operators: the evening stockout rate is the sharpest available external read on a competitor's replenishment discipline — and a competitor with a high evening stockout rate has an operational weakness that capital alone will not fix.
6. Finding Five: Quick Price Is Not Always Marketplace Price
Quick pricing and main- marketplace pricingfor the same SKU diverged on a meaningful share of records in the panel.
Implication: a brand tracking its main-marketplace price and assuming Quick parity is tracking the wrong number for the q-commerce channel. Capture the Quick price as a distinct field. Treating the two as one is a small schema decision with a compounding analytical cost.
7. What Brands and Operators Should Change
Measure coverage; do not model it. Serving radii are not circles, and the boundary is where the decision is.
Stratify the panel by ring. A panel that oversamples the core will tell you the service is excellent everywhere. It is not.
Capture at the evening peak. If you take one thing from this report, take this one.
Separate "not assorted" from "out of stock." They are different problems with different owners and different fixes. Collapsing them produces trade conversations aimed at the wrong party.
Compute share of shelf with a real denominator. Category depth has to be captured, not assumed.
Treat pack size as a strategic variable. The dark-store shelf selects for it.
Capture Quick price separately. Parity is an assumption, not a fact.
8. Limitations
Findings reflect a monitored panel rather than a census, and coverage, assortment, and ETA behaviour change as dark-store networks expand and contract. Ring definitions are analytical constructs and vary in how cleanly they map onto any given city's geography. Category composition materially affects assortment and stockout figures. Observed ETAs are the platform's promised delivery windows at capture time, not measured fulfilment times. All figures are illustrative of observed patterns rather than audited statistics, and this sector moves quickly enough that any figure should be treated as directional.
9. About the Data
This report was produced using Flipkart Quick availability data collected by Product Data Scrape. Our q-commerce datasets capture Quick eligibility, observed ETAs, dark-store availability, the assortment-versus-stockout distinction, category depth, pack-size coverage, and Quick pricing — across configurable pincode panels, at frequencies including evening-peak capture, and on a single schema that permits cross-platform comparison with India's other q-commerce services.
Delivered as JSON, CSV, via REST API, or pushed directly to cloud storage and data warehouses.
Want this panel run on your category, in your cities? Product Data Scrape will build a stratified pincode panel and show you where your products actually reach — and where they do not.
Product Data Scrape — turning marketplace complexity into decision-ready data.


 Singapore
 EMAIL
EMAIL
 PHONE
PHONE


.webp)
.webp "thumb")
.webp "thumb")
.webp "thumb")













.webp)






