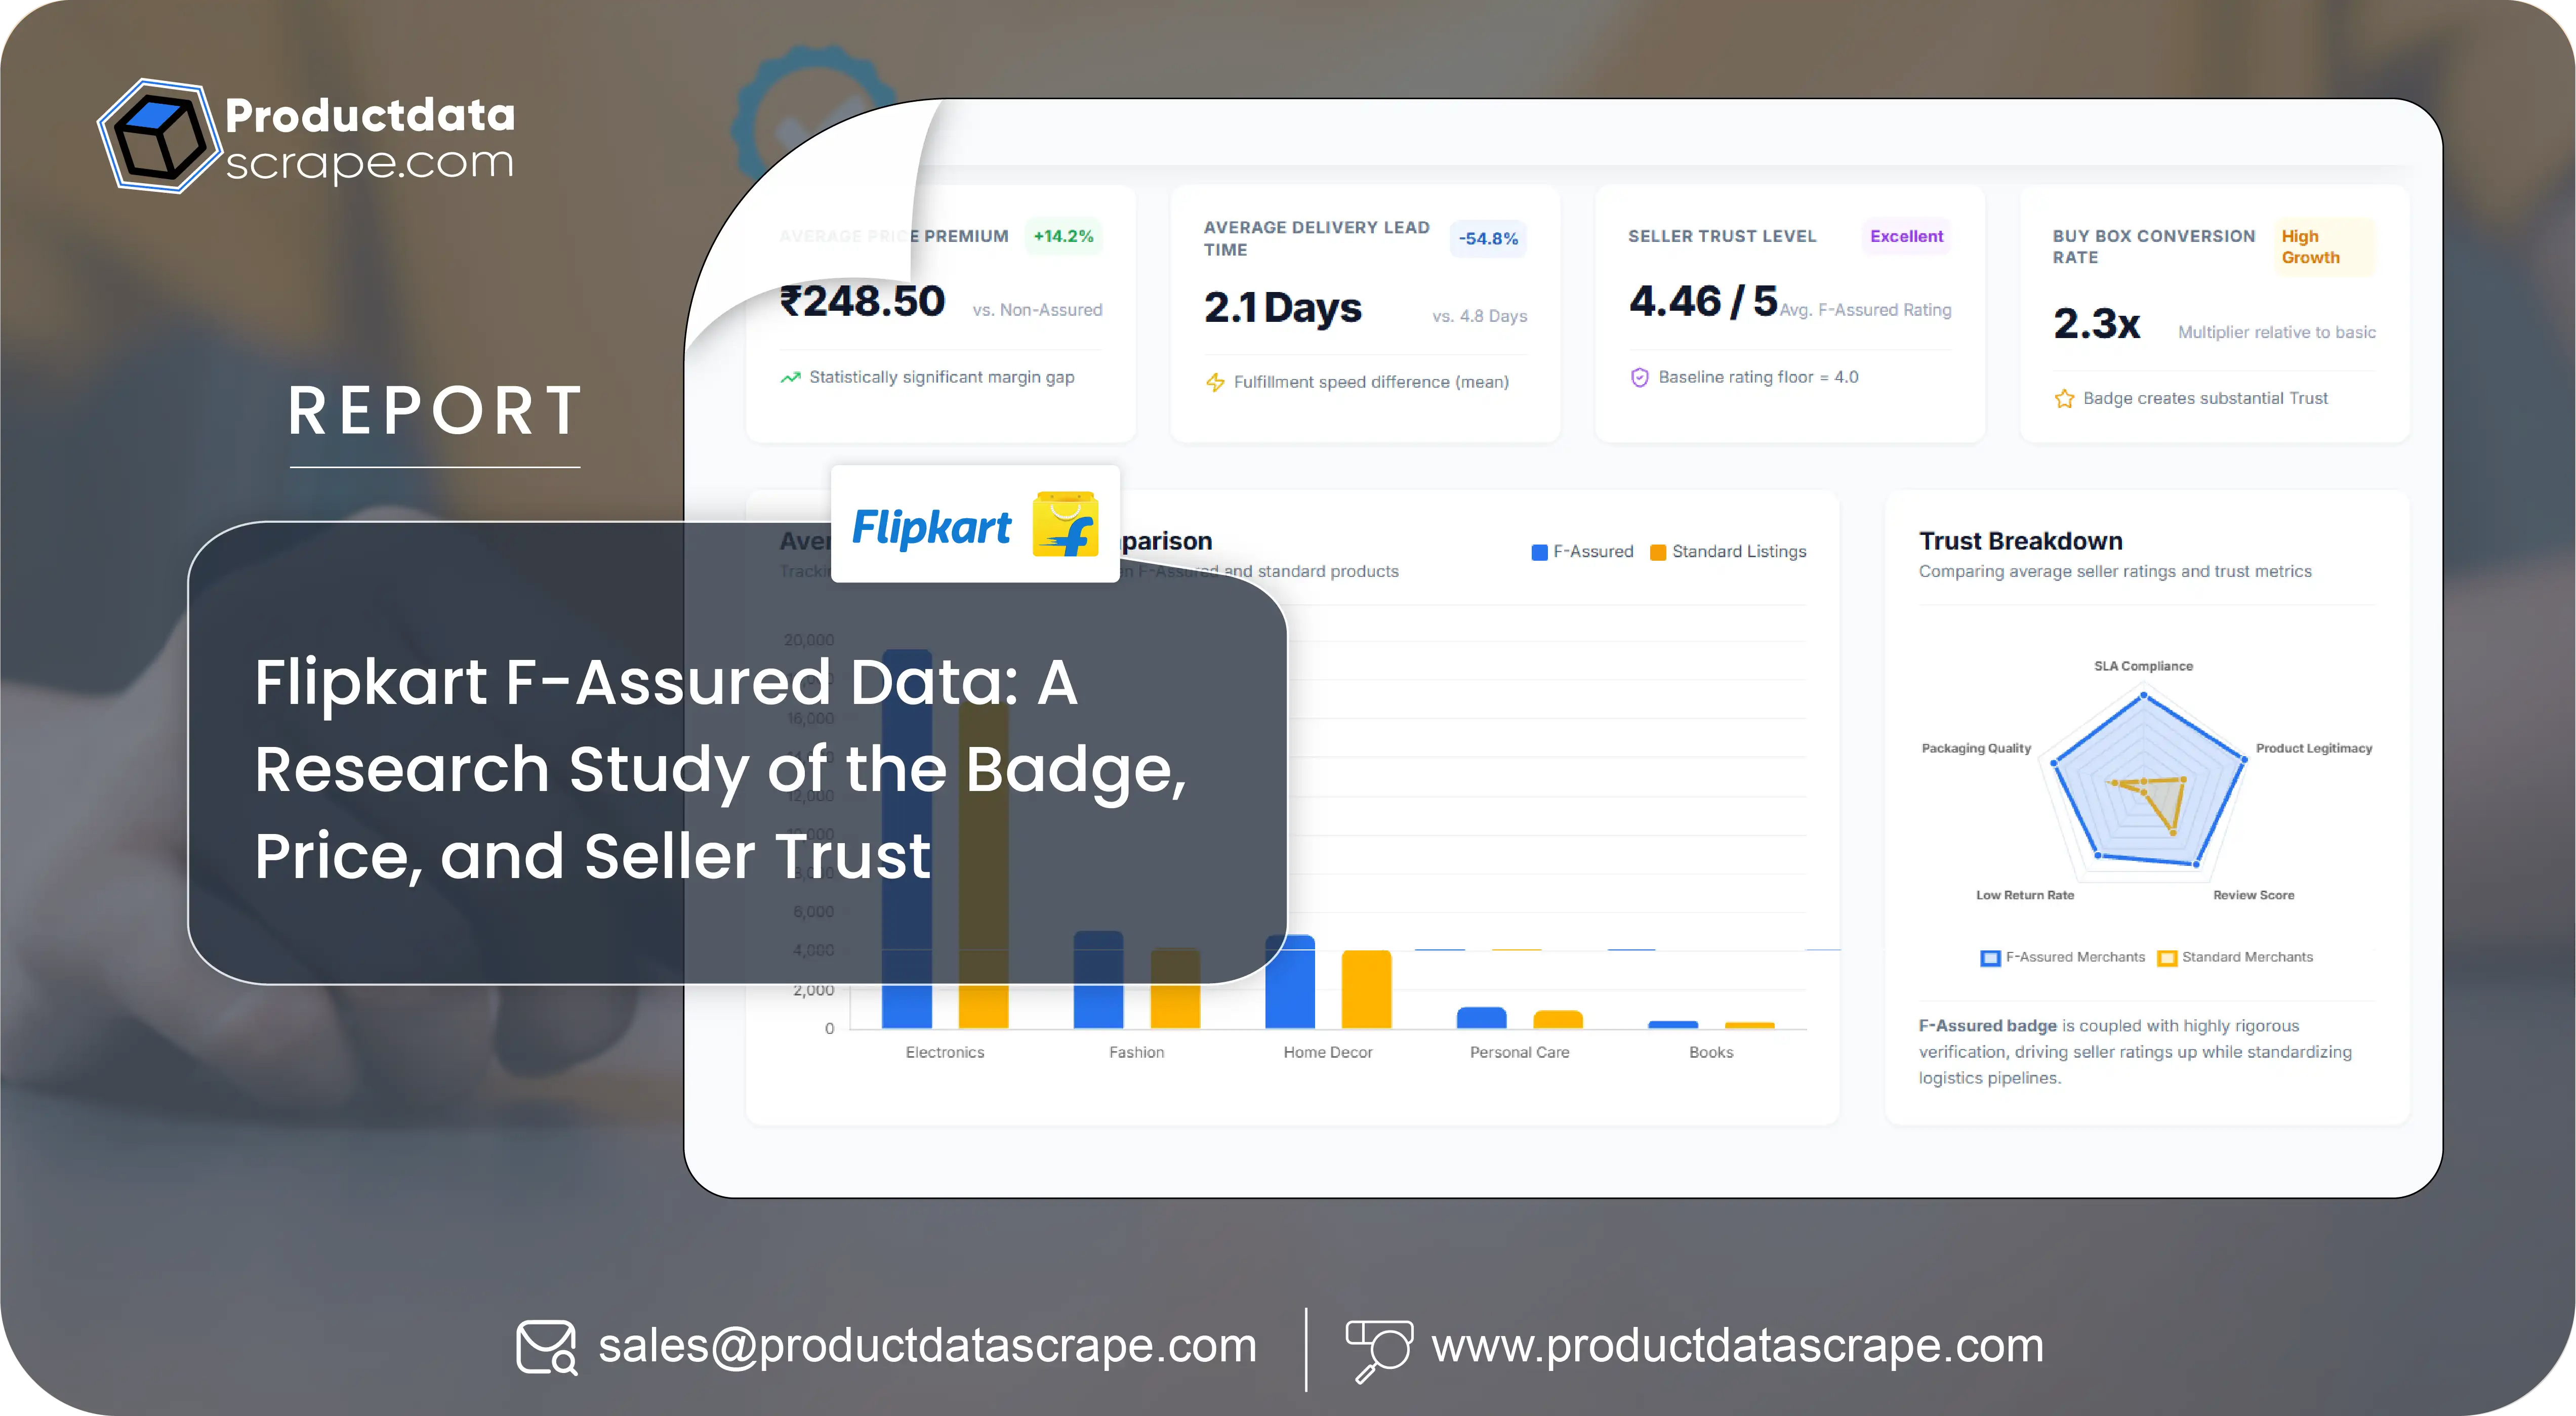
Flipkart F-Assured Data: A Research Study of the Badge, Price, and Seller Trust

Executive Summary

The F-Assured badge is the most visible trust signal on a Flipkart listing. It marks products that meet the platform's quality and delivery assurance standards, and for buyers it functions as shorthand for this one is safe.

For brands, it is something else entirely: a data field with unusual diagnostic power.

This study examines Flipkart F-Assured data across a monitored panel of SKUs and their full seller arrays. The central finding is that F-Assured status is not a product attribute — it is a seller-SKU attribute, and it is distributed unevenly across the sellers competing on the same listing. That unevenness turns out to be the single most useful brand-protection signal available in publicly visible Flipkart data.

The headline finding: across the monitored panel, sellers without F-Assured status were substantially more likely to be priced below the brand's authorised floor — and the combination of "no F-Assured, no Plus pricing, below-floor price" identified unauthorised listings with a hit rate high enough to be operationally useful as a first-pass filter.

This report is published by Product Data Scrape. Figures are representative of observed patterns across our Flipkart monitoring panel and are illustrative rather than a market census.

1. The Common Misunderstanding

Most teams treat F-Assured as a property of the product. Is this SKU F-Assured? Yes or no.

That framing is wrong, and the error is consequential. F-Assured is assigned at the seller-SKU level. The same product, on the same listing, can be F-Assured from one seller and not from another.

A pipeline that captures a single is_f_assured boolean per product — which is what a generic scraper produces — collapses a distribution into a single value, and which value it collapses to depends entirely on which seller happened to be displayed at capture time. The field is not merely imprecise. It is arbitrary.

Captured correctly, F-Assured belongs inside the seller array:

"all_sellers": [
  {"seller_name": "AuthorisedPartner A", "price": 3499, "is_f_assured": true,  "is_default_seller": false},
  {"seller_name": "Unknown Seller 1",    "price": 3149, "is_f_assured": false, "is_default_seller": true},
  {"seller_name": "Unknown Seller 2",    "price": 3199, "is_f_assured": false, "is_default_seller": false}
]

That structure is what makes the rest of this study possible.

2. Methodology

  • Panel: Monitored SKUs across Mobiles & Accessories, Small Appliances, and Personal Care, with the full seller array captured on every record.
  • Fields: is_f_assured per seller-SKU, seller rating, price, Plus exclusive price, effective price after offers, default-seller flag, MAP floor where the brand supplied one.
  • Frequency: Multiple captures daily.
  • Window: A continuous multi-week window outside a major sale event.
  • Ground truth: For a subset of SKUs, brands supplied their authorised-seller lists, enabling the F-Assured signal to be tested against known authorisation status.

3. Finding One: F-Assured Coverage Is Uneven Within a Single Listing

Across monitored listings carrying more than one seller, F-Assured status was rarely uniform.

Sellers on Listing Share Where All Sellers F-Assured Share Where Some but Not All Share Where None
2 sellers ~44% ~41% ~15%
3–5 sellers ~19% ~68% ~13%
6+ sellers ~7% ~84% ~9%

Illustrative figures from the monitoring panel.

The more sellers on a listing, the more likely the badge is split across them. On listings with six or more sellers — the most contested, highest-velocity SKUs — a mixed F-Assured picture was close to universal.

Implication: on exactly the SKUs that matter most commercially, a single product-level is_f_assured value is close to meaningless.

4. Finding Two: Non-F-Assured Sellers Cluster at the Bottom of the Price Distribution

Segmenting sellers by badge status produced a consistent price relationship.

Seller Segment Median Price vs Listing Median Median Seller Rating Share Offering Plus Price
F-Assured sellers +2.1% 4.4 ~61%
Non-F-Assured sellers −4.7% 3.8 ~9%

Illustrative figures.

Non-F-Assured sellers were, on median, priced below the listing median — and priced further below than the badge-holding sellers were above it. They carried lower ratings. And they very rarely offered Flipkart Plus pricing.

This is not surprising once stated. F-Assured status reflects investment in fulfilment quality and reliability, and that investment carries cost. Sellers who have not made it compete on the one dimension left to them: price.

Implication: the signal cheap and unbadged is not neutral. It describes a specific and identifiable seller profile.

5. Finding Three: The Three-Signal Filter

The operationally important finding is what happens when the signals are combined.

Testing against brand-supplied authorised-seller lists, we evaluated three filters as predictors of an unauthorised listing:

Filter Precision (share of flagged listings that were unauthorised)
Price below MAP floor, alone Moderate
No F-Assured badge, alone Moderate
No F-Assured and no Plus pricing and below MAP floor High

Directional findings; precision varies by category and by how well the brand maintains its authorised-seller list.

Any single signal generates substantial false positives. An authorised seller can be temporarily below floor during a legitimate promotion. A legitimate seller may lack F-Assured on a newly listed SKU.

The conjunction of all three is a far narrower profile, and in the panel it identified unauthorised listings reliably enough to be used as a first-pass triage filter — the difference between a brand-protection team reviewing every seller on every SKU and reviewing a short, prioritised queue.

Implication: Flipkart F-Assured data is most valuable not as a standalone metric but as one leg of a composite signal.

6. Finding Four: The Badge and the Default Position

A further pattern: on listings where the default position was held by a non-F-Assured seller, the brand's authorised sellers were disproportionately likely to be experiencing a stockout on the highest-velocity variant.

In other words, the default position was frequently not taken by the unbadged seller. It was vacated by the brand.

This reframes a problem many brands treat as purely adversarial. A meaningful share of Buy Box loss to unauthorised sellers is downstream of the brand's own supply and allocation failures — and it is only visible if variant-level stock is captured alongside the seller array.

Implication: brand protection and supply planning are the same problem viewed from two angles, and the same dataset serves both.

7. What Brands Should Change

Move is_f_assured inside the seller array. It is not a product field. Capturing it as one destroys the signal.

Build the composite filter. No badge + no Plus price + below floor. Use it to triage, not to conclude — it produces a queue, not a verdict.

Trend badge coverage over time. A listing where F-Assured coverage is falling is a listing where unbadged sellers are entering. That is an early warning, and it fires before the price damage shows up.

Correlate default-position loss with your own variant stock. Before escalating to legal, check whether you handed the position away.

Preserve seller history. Enforcement requires timestamped evidence of who was listing at what price when. That history cannot be reconstructed after the fact — it either exists in your data or it does not.

8. Limitations

Findings reflect a monitored panel, not a platform census. Precision of the composite filter depends heavily on the completeness of the brand's authorised-seller list — a brand with a stale list will see inflated false-positive rates that reflect its own record-keeping rather than the signal. Category composition affects all figures. The observation window excluded Big Billion Days, during which badge and pricing dynamics differ. Figures are illustrative of observed patterns.

9. About the Data

This report was produced using Flipkart F-Assured data collected by Product Data Scrape. Our Flipkart datasets capture F-Assured status per seller-SKU inside the full multi-seller array, alongside standard and Plus pricing, per-variant pricing and stock, pincode-level pricing across India, bank offers and EMI terms, SuperCoin earn rates, and Big Billion Days deal flags.

Data is delivered as JSON, CSV, via REST API, or pushed directly to cloud storage and data warehouses.

Want this run on your own catalogue? Product Data Scrape will capture the full seller array on a sample of your SKUs, apply the composite filter, and show you the unauthorised-listing queue you are not currently seeing.

Product Data Scrape — turning marketplace complexity into decision-ready data.

LATEST BLOG

Analyze Zomato Delivery Pricing Before Opening a Restaurant - A Complete Guide to Smarter Restaurant Launch Planning

Analyze Zomato Delivery Pricing Before Opening a Restaurant to optimize menu pricing, delivery costs, profits, and market positioning.

Flipkart Big Billion Days Price Tracking: Capturing Every Deal, Drop, and Stockout in Real Time

Big Billion Days price tracking done right - capture every deal, price drop, stockout and repricing move on Flipkart in real time. Fields and sample data inside.

Pincode-Level Flipkart Price Scraping: Why Hyperlocal Pricing Data Matters for India FMCG Brands

Pincode-level Flipkart price scraping reveals how price, delivery and stock shift across India. See the fields, sample data and workflows FMCG brands rely on.

Case Studies

Discover our scraping success through detailed case studies across various industries and applications.

WHY CHOOSE US?

Product Data Scrape for Retail Web Scraping

Choose Product Data Scrape to access accurate data, enhance decision-making, and boost your online sales strategy effectively.

Reliable Insights

Reliable Insights

With our Retail Data scraping services, you gain reliable insights that empower you to make informed decisions based on accurate product data and market trends.

Data Efficiency

Data Efficiency

We help you extract Retail Data product data efficiently, streamlining your processes to ensure timely access to crucial market information and operational speed.

Market Adaptation

Market Adaptation

By leveraging our Retail Data scraping, you can quickly adapt to market changes, giving you a competitive edge with real-time analysis and responsive strategies.

Price Optimization

Price Optimization

Our Retail Data price monitoring tools enable you to stay competitive by adjusting prices dynamically, attracting customers while maximizing your profits effectively.

Competitive Edge

Competitive Edge

THIS IS YOUR KEY BENEFIT.
With our competitive price tracking, you can analyze market positioning and adjust your strategies, responding effectively to competitor actions and pricing in real-time.

Feedback Analysis

Feedback Analysis

Utilizing our Retail Data review scraping, you gain valuable customer insights that help you improve product offerings and enhance overall customer satisfaction.

5-Step Proven Methodology

How We Scrape E-Commerce Data?

01
Identify Target Websites

Identify Target Websites

Begin by selecting the e-commerce websites you want to scrape, focusing on those that provide the most valuable data for your needs.

02
Select Data Points

Select Data Points

Determine the specific data points to extract, such as product names, prices, descriptions, and reviews, to ensure comprehensive insights.

03
Use Scraping Tools

Use Scraping Tools

Utilize web scraping tools or libraries to automate the data extraction process, ensuring efficiency and accuracy in gathering the desired information.

04
Data Cleaning

Data Cleaning

After extraction, clean the data to remove duplicates and irrelevant information, ensuring that the dataset is organized and useful for analysis.

05
Analyze Extracted Data

Analyze Extracted Data

Once cleaned, analyze the extracted e-commerce data to gain insights, identify trends, and make informed decisions that enhance your strategy.

Start Your Data Journey
99.9% Uptime
GDPR Compliant
Real-time API

See the results that matter

Read inspiring client journeys

Discover how our clients achieved success with us.

6X

Conversion Rate Growth

“I used Product Data Scrape to extract Walmart fashion product data, and the results were outstanding. Real-time insights into pricing, trends, and inventory helped me refine my strategy and achieve a 6X increase in conversions. It gave me the competitive edge I needed in the fashion category.”

7X

Sales Velocity Boost

“Through Kroger sales data extraction with Product Data Scrape, we unlocked actionable pricing and promotion insights, achieving a 7X Sales Velocity Boost while maximizing conversions and driving sustainable growth.”

"By using Product Data Scrape to scrape GoPuff prices data, we accelerated our pricing decisions by 4X, improving margins and customer satisfaction."

"Implementing liquor data scraping allowed us to track competitor offerings and optimize assortments. Within three quarters, we achieved a 3X improvement in sales!"

Resource Hub: Explore the Latest Insights and Trends

The Resource Center offers up-to-date case studies, insightful blogs, detailed research reports, and engaging infographics to help you explore valuable insights and data-driven trends effectively.

Get In Touch

Analyze Zomato Delivery Pricing Before Opening a Restaurant - A Complete Guide to Smarter Restaurant Launch Planning

Analyze Zomato Delivery Pricing Before Opening a Restaurant to optimize menu pricing, delivery costs, profits, and market positioning.

Flipkart Big Billion Days Price Tracking: Capturing Every Deal, Drop, and Stockout in Real Time

Big Billion Days price tracking done right - capture every deal, price drop, stockout and repricing move on Flipkart in real time. Fields and sample data inside.

Pincode-Level Flipkart Price Scraping: Why Hyperlocal Pricing Data Matters for India FMCG Brands

Pincode-level Flipkart price scraping reveals how price, delivery and stock shift across India. See the fields, sample data and workflows FMCG brands rely on.

Mattress Share of Shelf Tracking Across Amazon, Flipkart, and Pepperfry

A Home Furnishings Assortment Gap Analysis found the white-space a furniture brand was missing — the exact SKUs competitors listed that it did not, ranked to launch.

Driving Higher Sales with Real-Time Quick Commerce Inventory Monitoring Through Real-Time OOS on QC Dark Stores, Competitor Pricing, and Ad-Set Optimization

Real-Time Quick Commerce Inventory Monitoring helps track stock, pricing, and availability to reduce OOS, optimize sales, and improve decisions.

Skincare Review Sentiment Analysis: How a D2C Brand Used Nykaa and Amazon Reviews to Reformulate a Bestseller

Home Decor Catalog Enrichment turned 50,000+ thin marketplace listings into complete, search-ready product pages. See the field-level lift and the conversion gain.

Albertsons Grocery Delivery Scraper API - Market Intelligence, Inventory Monitoring, and Grocery Retail Benchmarking

ASDA Grocery Data Scraping helps track grocery prices, promotions, inventory, and competitor trends across the UK retail market.

Costco Alcohol & Liquor Price Data scraping to Track Consumer Buying Trends and Inventory Intelligence

Costco Alcohol & Liquor Price Data scraping helps brands track pricing, promotions, inventory trends, and competitor insights.

B&M Stores Pet Supplies Data Scraping for Market Research and Pet Product Trend Analysis in Retail Chains

B&M Stores Pet Supplies Data Scraping helps businesses collect pricing, stock, and product insights to optimize pet retail strategies.

Reducing Returns with Myntra AND AJIO Customer Review Datasets

Analyzed Myntra and AJIO customer review datasets to identify sizing issues, helping brands reduce garment return rates by 8% through data-driven insights.

Before vs After Web Scraping - How E-Commerce Brands Unlock Real Growth

Before vs After Web Scraping: See how e-commerce brands boost growth with real-time data, pricing insights, product tracking, and smarter digital decisions.

Scrape Data From Any Ecommerce Websites

Easily scrape data from any eCommerce website to track prices, monitor competitors, and analyze product trends in real time with Real Data API.

Fresh Citrus Price Wars - Coles vs Aldi — What Does the Data Say?

Fresh Citrus Price Wars — Coles vs Aldi: data-driven comparison of prices, trends, and savings to see which retailer wins on value for shoppers.

Retail Inflation 2025 – Comparing Grocery Baskets in Dubai vs. Abu Dhabi (Noon)

Retail Inflation 2025 – Comparing Grocery Baskets in Dubai vs. Abu Dhabi (Noon) highlights price differences and real-world grocery costs across UAE cities.

Unlock Winning Products on Pinduoduo - How Scraping Bestseller Data Reveals Top Titles, Prices & Sales Trends

Scrape Pinduoduo bestseller data to analyze top-selling products, pricing trends, sales performance, for smarter eCommerce and intelligence decisions.

FAQs

E-Commerce Data Scraping FAQs

Our E-commerce data scraping FAQs provide clear answers to common questions, helping you understand the process and its benefits effectively.

E-commerce scraping services are automated solutions that gather product data from online retailers, providing businesses with valuable insights for decision-making and competitive analysis.

We use advanced web scraping tools to extract e-commerce product data, capturing essential information like prices, descriptions, and availability from multiple sources.

E-commerce data scraping involves collecting data from online platforms to analyze trends and gain insights, helping businesses improve strategies and optimize operations effectively.

E-commerce price monitoring tracks product prices across various platforms in real time, enabling businesses to adjust pricing strategies based on market conditions and competitor actions.

Get a free sample dataset

See the exact fields, accuracy and format — for your products, on your target sites — before you spend a rupee or a dollar.

  • Sample delivered within 24 hours
  • Scoped to your real use case, not a generic demo
  • No obligation, no long contract

Tell us what you need

A specialist replies within one business day.