The Client
A consumer electronics seller operating on Flipkart across large appliances and home entertainment — televisions, audio systems, and small appliances. High average selling price, thin margins, and a category where financing and exchange offers are central to how customers buy.
Client details are anonymised. Figures are representative of the engagement.
The Problem: Cutting Price and Still Losing
The seller was in the middle of a sale period and losing share on its highest-value SKUs. Its response was the obvious one: cut price.
It cut. It kept losing. It cut again. It kept losing.
By the third cut on its flagship 55-inch television SKU, the seller was 900 rupees below the nearest competitor on listed price — comfortably, visibly, and painfully below — and still watching the competitor hold the default seller position and win the volume.
The internal conclusion was that something must be wrong with the listing. Perhaps the images. Perhaps the review count. Perhaps the delivery promise. A meeting was convened to discuss A+ content.
Nobody in the room had considered that the seller might not actually be cheaper.
The Diagnosis: The Wrong Number on the Dashboard
Product Data Scrape ran a diagnostic pass across the seller's top 40 SKUs and the matched competitor basket, capturing the full offer stack rather than the listed price alone.
The flagship television produced this. Illustrative figures.
| Layer |
Our SKU |
Competitor SKU |
| MRP |
74,999 |
74,999 |
| Listed price |
41,999 |
42,899 |
| Flipkart Plus price |
41,999 (no Plus tier) |
41,899 |
| Best bank offer (cap-aware) |
−1,000 (Bank A, cap binding at 1,000) |
−2,100 (Bank C, cap not binding) |
| No-cost EMI |
Not offered |
Offered, 3–12 months |
| Exchange offer (advertised max) |
−8,000 |
−12,000 |
| SuperCoins earnable |
180 |
420 |
| Best-case effective price |
32,819 |
27,379 |
| Realised effective price (weighted) |
39,321 |
36,988 |
The seller was 900 rupees cheaper on listed price and 2,333 rupees more expensive on realised effective price.
On the number a customer actually encounters at checkout — and on the number the deal aggregators, review sites, and price-comparison tools were publishing — the competitor was decisively cheaper. Not marginally. Decisively.
Every price cut the seller had made had been aimed at the one layer where it was already winning.
Where the Gap Actually Was
The diagnostic broke the 2,333-rupee gap into its parts, and the composition was more instructive than the total.
Bank offer cap (−1,100). Both sellers advertised a bank offer. The seller's offer was a 10 percent discount capped at 1,000 rupees. On a 42,000-rupee television, that cap bound hard — the customer got 1,000, not 4,200. The competitor's offer was 5 percent capped at 3,000, which on the same basket delivered 2,100. The seller's offer looked more generous and delivered half as much. Nobody internally had noticed, because the offer was stored in their systems as the display string "10% instant discount."
No-cost EMI (absent). The competitor offered no-cost EMI across four tenures. The seller did not. In a category where a substantial share of purchases are financed, this is not a promotional detail — it is a gate. Customers who intended to pay in instalments were not comparing the two SKUs at all. They were seeing one option.
Exchange ceiling (−4,000 advertised, −1,233 realised). The competitor's exchange programme was both more generous at the ceiling and more generous at the median.
SuperCoins (−240). Small, but real, and it moved the same direction as everything else.
Four layers. None of them the listed price. All of them invisible on a dashboard that captured one number.
The Solution: Effective Price as the Benchmark
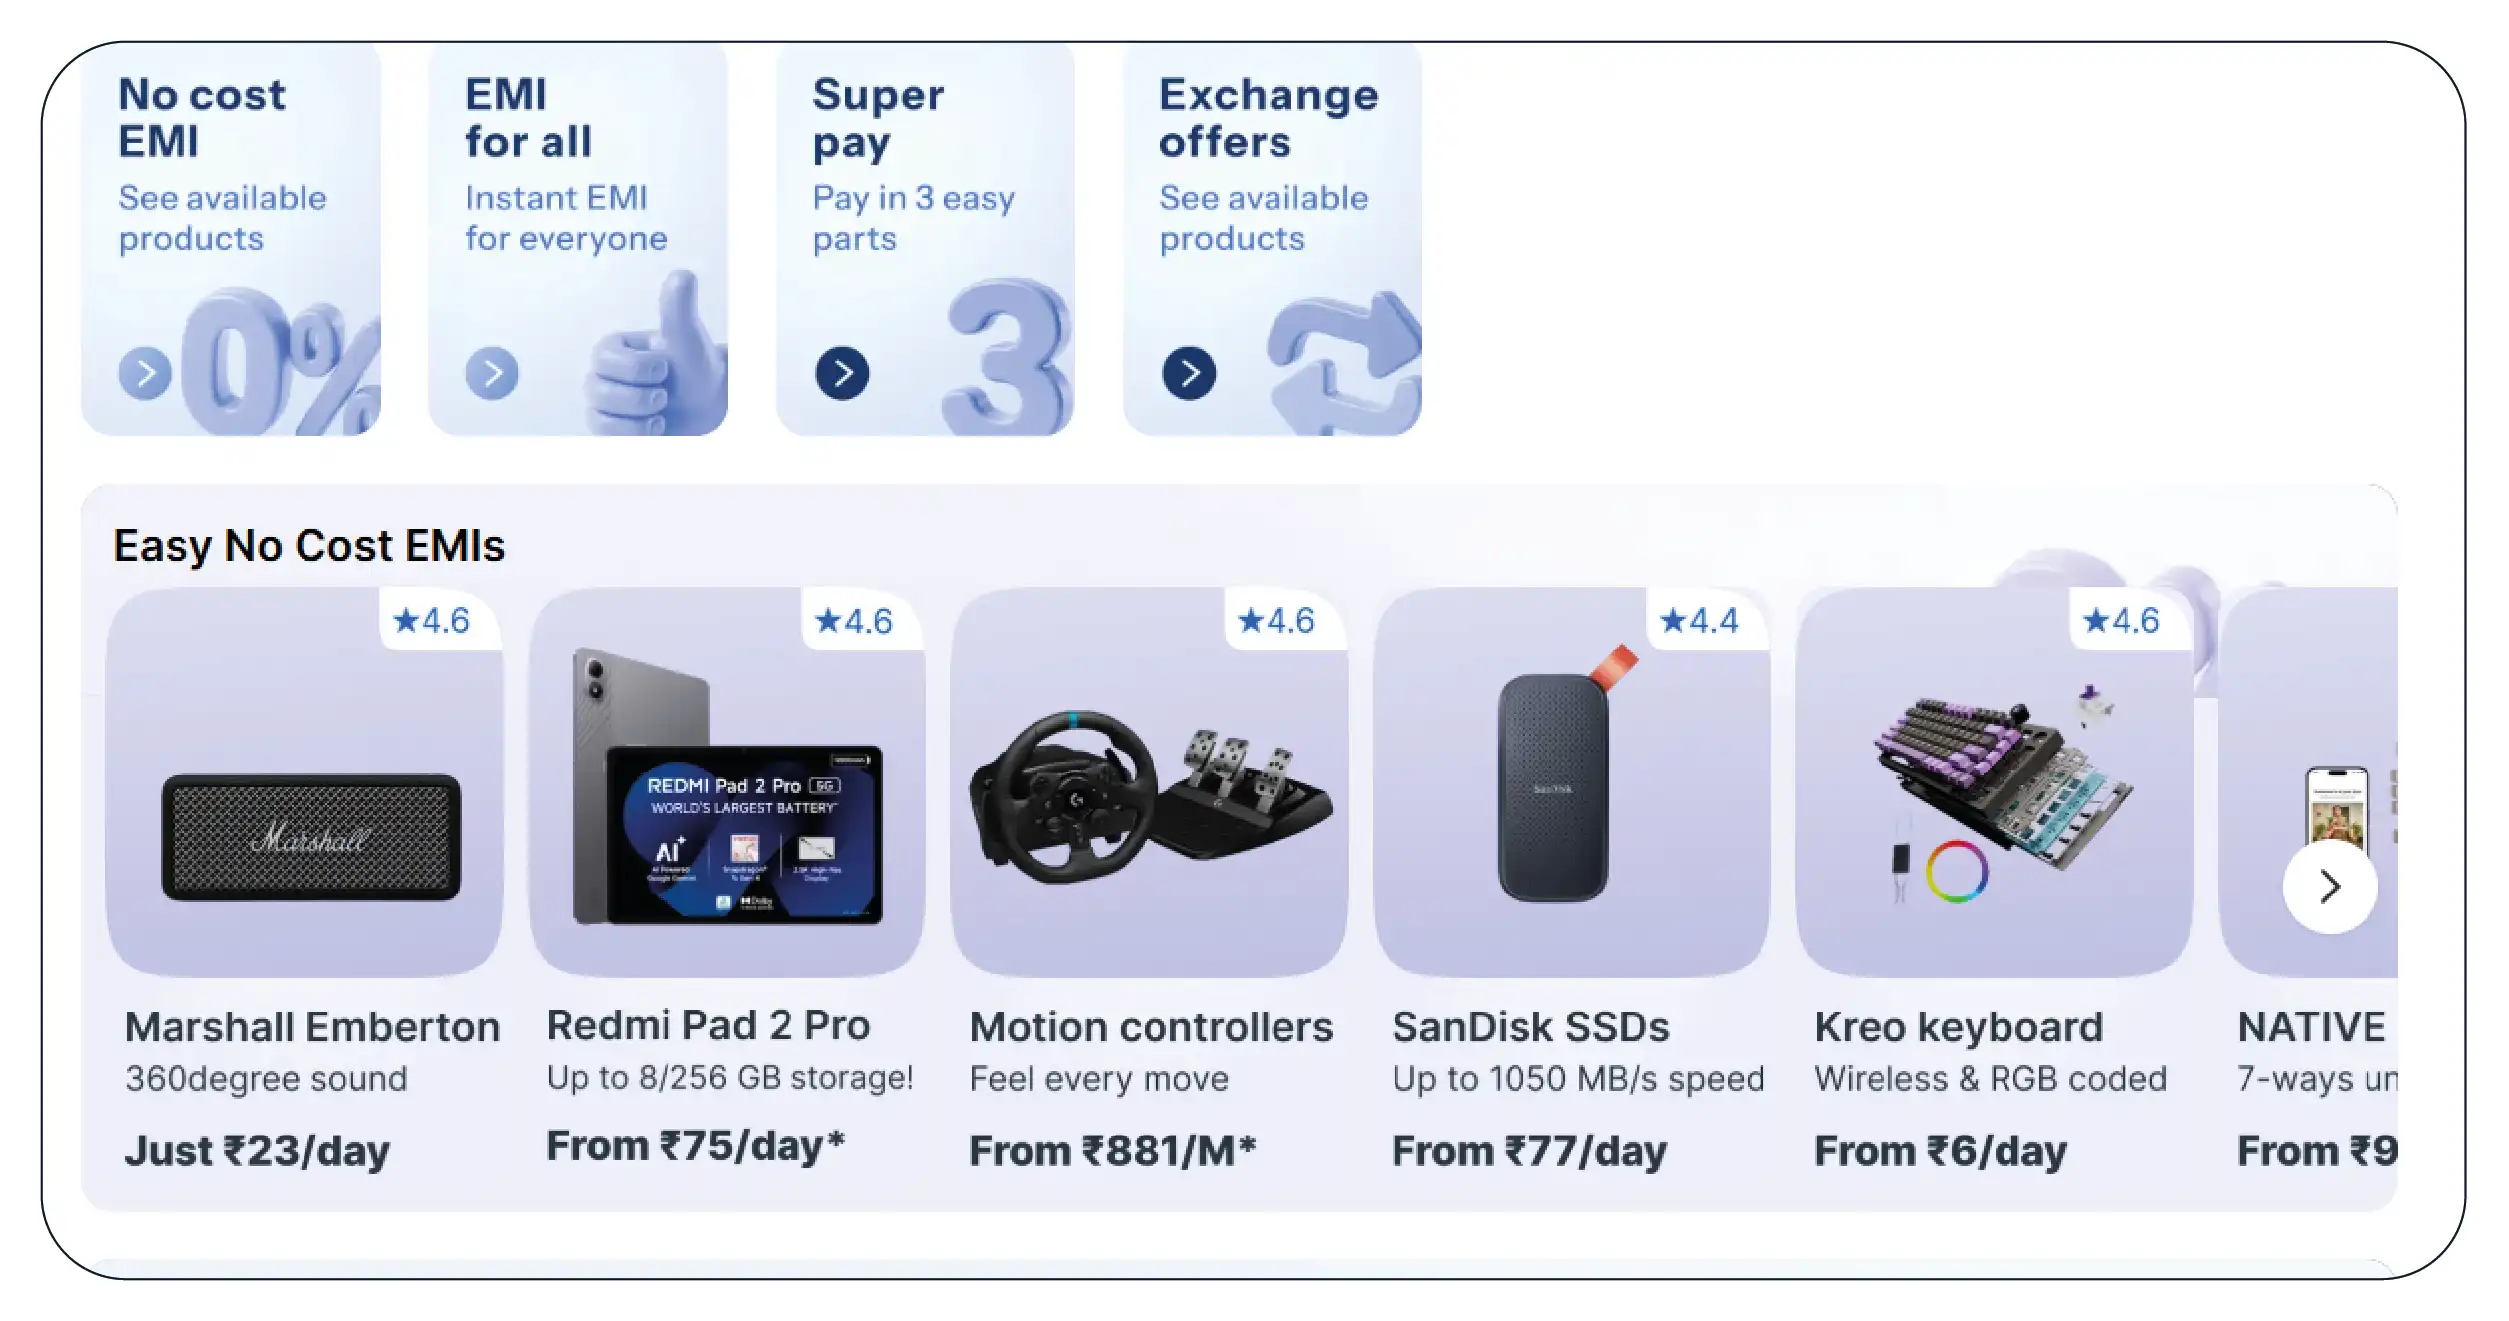
Product Data Scrape deployed continuous Flipkart effective price monitoring across the seller's catalogue and a competitor basket:
- Structured offer capture — every bank offer stored as bank, card type, offer type, percentage, cap, and minimum transaction, so the discount is computed rather than read.
- Cap-aware best-offer selection on every record.
- No-cost EMI terms — availability, tenures, and monthly instalment.
- Exchange valuation — advertised ceiling, captured separately from the seller's own realised-value weights.
- SuperCoin earn rate per SKU.
- Dual effective price — best-case and realised, with the seller's own redemption and participation weights applied.
- Alerting on effective-price gap, not on listed-price gap.
Capture ran hourly during the sale window, four times daily outside it.
What the Seller Did — Mid-Sale
The engagement began during an active sale period, which is not ideal but turned out to be instructive. The seller could not wait for a clean planning cycle. It had to act inside the event.
Week 1 — Reverse the price cuts. The first recommendation was counterintuitive enough that it took a conversation: raise the listed price back up. The seller had cut 900 rupees into a competitive gap that did not exist on the layer where competition was actually happening. Those cuts were pure margin donation. The listed price was restored to parity.
Week 1 — Renegotiate the offer cap. The bank offer was restructured with the banking partner: a lower headline percentage with a materially higher cap, which delivered more actual discount to the customer at a lower cost to the seller than a deeper listed-price cut would have. This single change closed roughly half the effective-price gap and cost less than the price cuts it replaced.
Week 2 — Enable no-cost EMI. Enabled across three tenures on the top 12 high-ASP SKUs. The subvention cost was modelled explicitly and booked as a promotional cost line — visible, quantified, and deliberate, rather than absent.
Week 3 — Exchange programme. Exchange ceilings raised on the flagship SKUs, benchmarked against the competitor's captured ceilings.
Ongoing — New alerting. The pricing team's alert now fires on effective-price gap. Twice in the following month, a competitor cut its listed price while its effective price did not move — the discount had simply migrated from the offer layer to the price layer. Under the old benchmark, the seller would have matched both cuts. Under the new one, it correctly matched neither.
The Results (One Quarter)
| Metric |
Before |
After One Quarter |
| Listed price vs competitor (flagship) |
−900 (we were cheaper) |
At parity |
| Realised effective price vs competitor |
+2,333 (we were dearer) |
−310 (we are cheaper) |
| Default seller position held, top 12 high-ASP SKUs |
3 of 12 |
9 of 12 |
| Unnecessary price cuts made |
3 in the prior month |
0 |
| Bank offer cost per unit converted |
Higher |
Lower |
| Gross margin, top 12 SKUs, indexed |
100 |
118 |
| Revenue, top 12 SKUs, indexed |
100 |
136 |
Figures are representative of the engagement outcome.
Revenue up 36 percent. Margin up 18 percent. And the listed price ended the quarter higher than it began.
The Lesson
The seller's instinct was correct — it was losing on price. Its diagnosis was wrong about which price.
This is the most common and most expensive failure in marketplace pricing, and it is a failure of measurement rather than of judgement. Listed price is the layer that is easiest to capture, easiest to compare, and easiest to cut. It is also, in a category built on financing and exchange, the layer that decides the least.
Every rupee this seller cut from its listed price was a rupee it could have spent widening its bank offer cap — where the same rupee bought several times more competitive effect, because the cap was binding and the price gap was not.
You cannot make that trade if you cannot see both sides of it.
Work With Product Data Scrape
Product Data Scrape delivers Flipkart effective price monitoring: structured bank offers with caps and thresholds, cap-aware best-offer computation, no-cost EMI terms, exchange valuations, SuperCoin earn rates, Plus pricing, and dual best-case and realised effective price — delivered as JSON, CSV, API, or straight into your warehouse.
If you are cutting price and still losing, the problem is probably not your price. Ask us for a diagnostic pass on your top SKUs and the competitor basket, and we will show you where the gap actually is.
Product Data Scrape — turning marketplace complexity into decision-ready data.


 Singapore
 EMAIL
EMAIL
 PHONE
PHONE


.webp)
.webp "thumb")
.webp "thumb")
.webp "thumb")













.webp)






