The Client
A mid-sized D2C consumer-electronics brand selling audio accessories and smart-home devices across India. The company operated through two authorised Flipkart sellers and treated the marketplace as its single largest revenue channel — roughly 40 percent of total online sales.
Client details are anonymised at the brand's request. Figures are representative of the engagement.
The Problem: Winning the Category, Losing the Listing

The brand's Flipkart revenue had flattened over two consecutive quarters while category demand was still growing. Search rankings looked healthy. Review counts were rising. Ad spend was steady. On every metric the internal team tracked, the brand appeared to be performing.
The team's dashboard tracked one price per SKU — the price shown on the product page — and one seller, the one Flipkart happened to be displaying at the moment of capture. That single snapshot was hiding three problems at once.
Problem one: unknown sellers. Nobody at the brand knew how many sellers were actually listing their SKUs. The assumption was two. The reality, as the data would later show, was considerably higher.
Problem two: silent Buy Box loss. On Flipkart's marketplace, the seller holding the default position on a listing captures the overwhelming majority of the sale. The brand's authorised sellers were losing that position on their highest-velocity SKUs — and because the internal dashboard only captured whichever seller was displayed, the loss was invisible. The dashboard showed a price. It just wasn't the brand's price.
Problem three: price leakage. Sellers the brand had never authorised were undercutting the brand's own MAP floor. Every undercut both stole the default position and dragged the brand's perceived price down across the category.
The brand's leadership described the situation plainly: they could see the category, but they could not see their own listings.
Why the Existing Setup Could Not Solve It
The brand had an in-house scraper built by a contractor. It worked, in the narrow sense that it returned data. But it was built on the assumption that a product page has one price and one seller — the assumption almost every generic scraper makes, and the one Flipkart breaks.
It captured no seller array. It made no distinction between the standard price and the Flipkart Plus price. It did not record F-Assured status per seller. It flattened variants into a single row, so a stockout on the highest-selling storage configuration looked identical to full availability. And during the previous Big Billion Days, it had gone down for the better part of two days — the two days that mattered most.
The brand did not need more data. It needed the right shape of data.
The Solution: Full Seller-Array Flipkart Seller Data Scraping
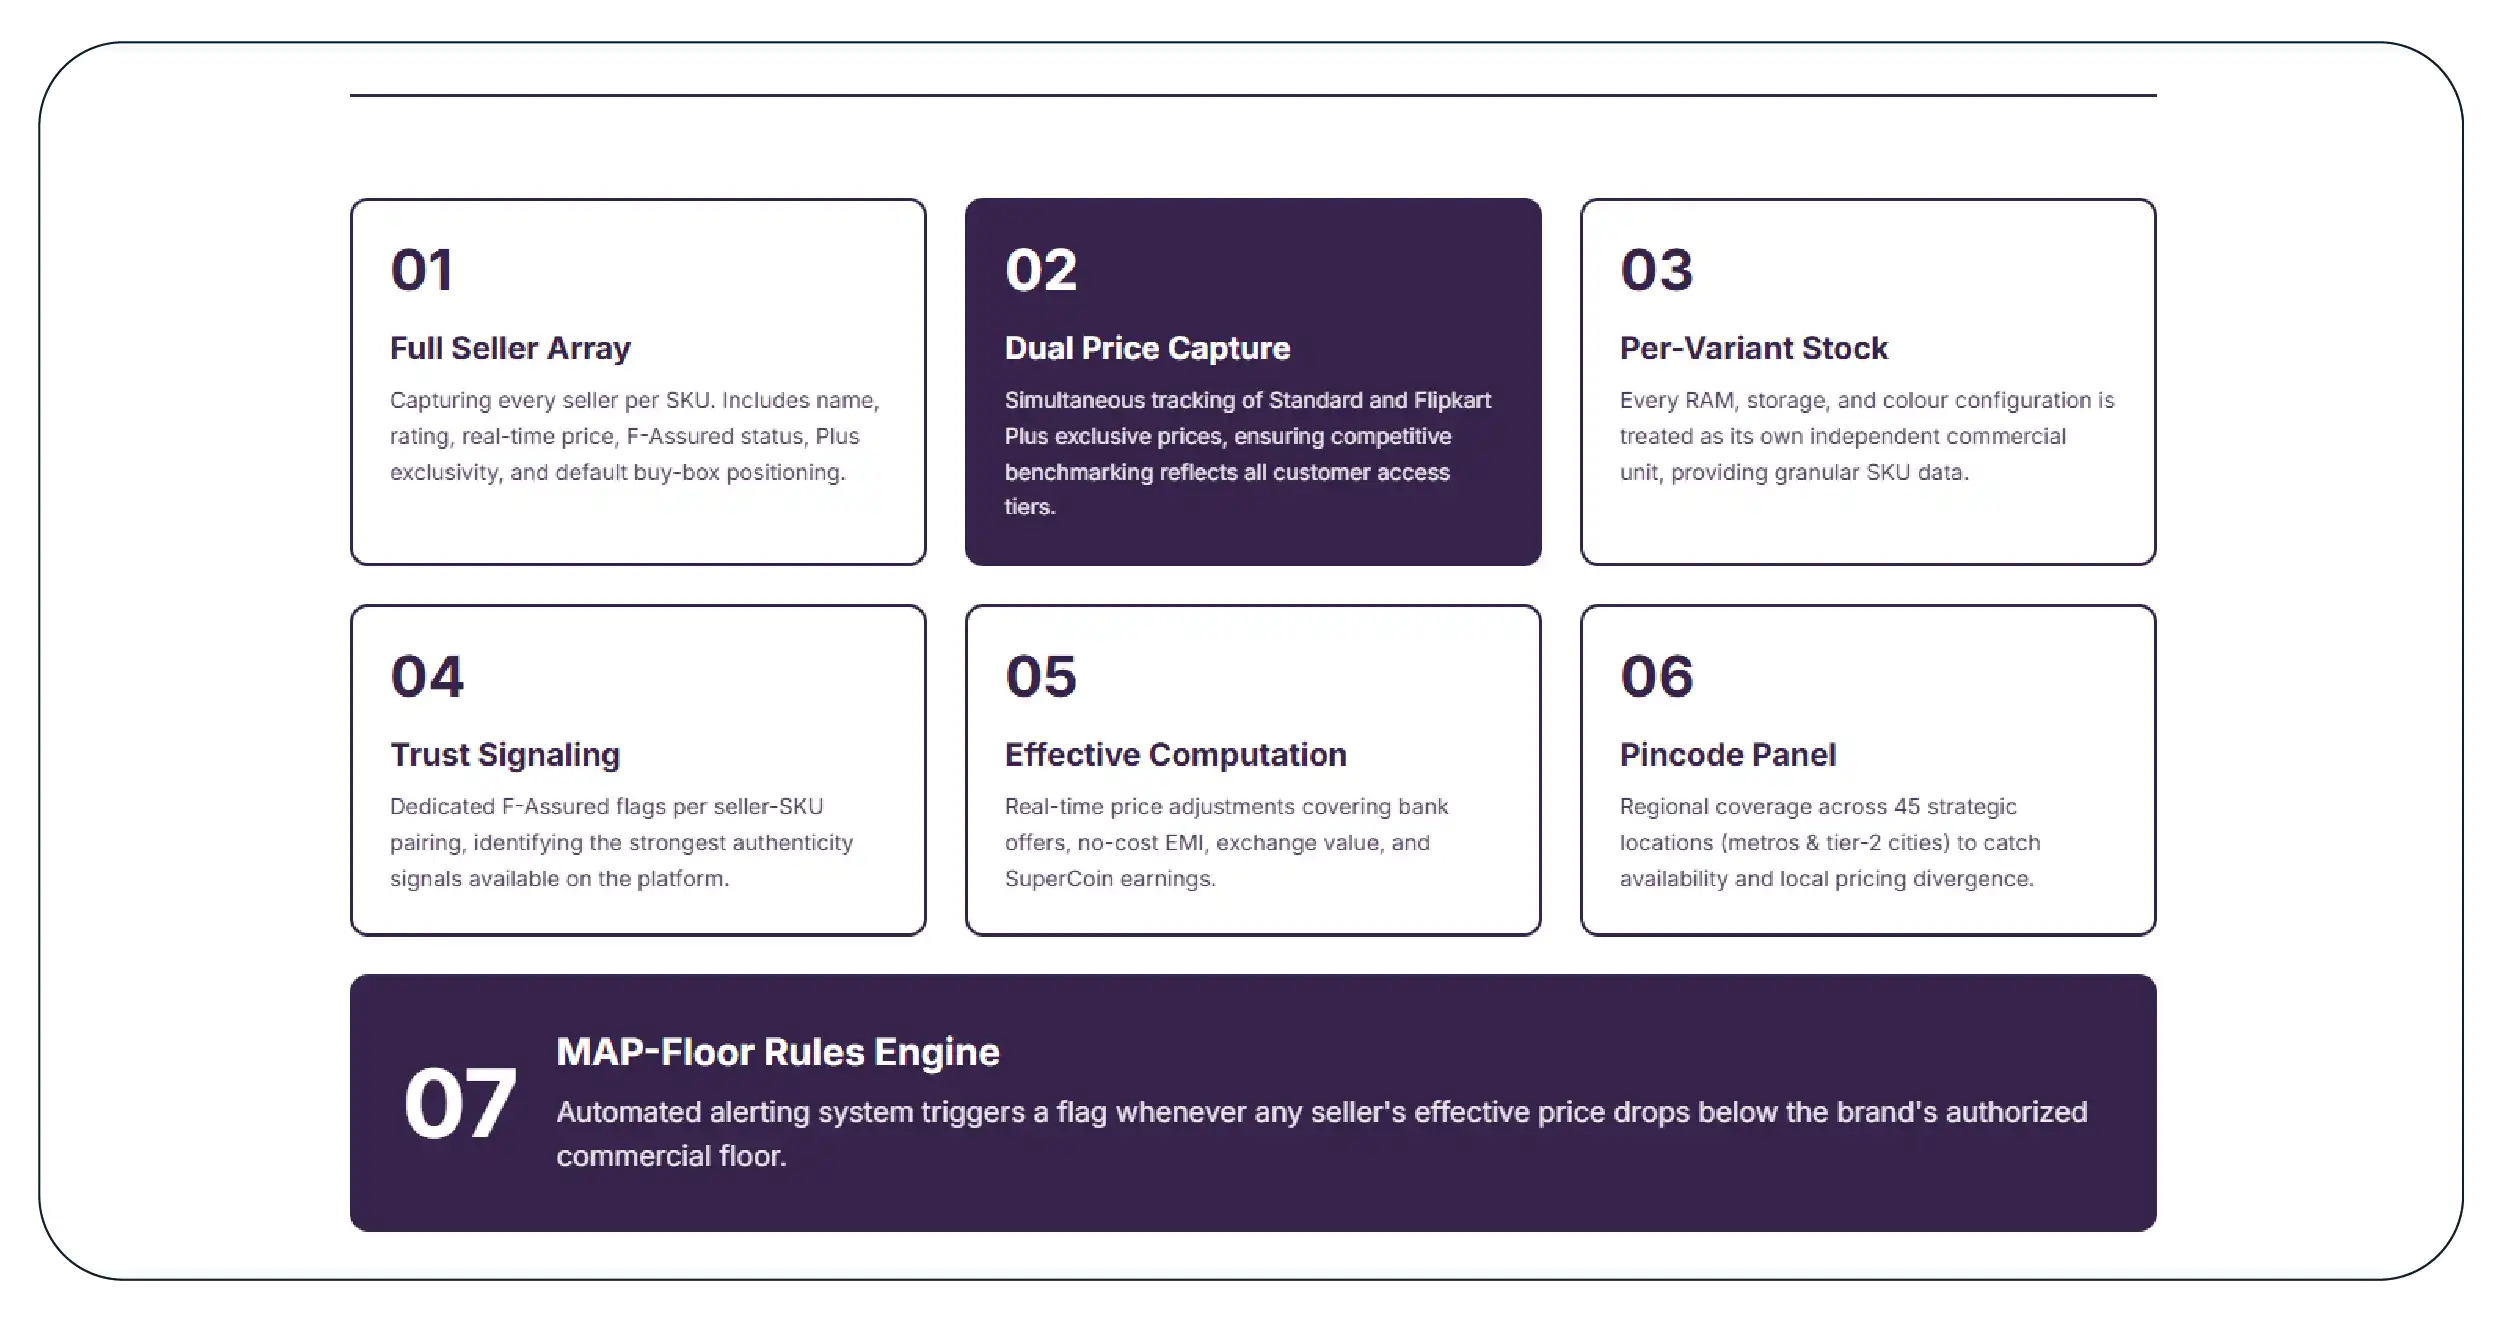
Product Data Scrape rebuilt the brand's Flipkart monitoring around a Flipkart-aware schema. The central change was simple to describe and transformative in practice: capture every seller on every SKU, every time.
The deployed pipeline covered:
- Full seller array per SKU — seller name, seller rating, price, F-Assured status, Plus exclusivity, and whether that seller currently held the default position.
- Dual price capture — standard price and Flipkart Plus exclusive price on every record, so competitive benchmarking reflected both customer tiers.
- Per-variant pricing and stock — every RAM, storage, and colour configuration tracked as its own commercial unit.
- F-Assured flags per seller-SKU — the strongest available authenticity signal on the platform.
- Effective price computation — listed price adjusted for bank offers, no-cost EMI, exchange offers, and SuperCoin earn value.
- Pincode panel — 45 pincodes across metros and tier-2 cities, to catch regional price and availability divergence.
- MAP-floor rules engine — an automatic flag whenever any seller's effective price crossed below the brand's authorised floor.
Capture frequency was set to four times daily for hero SKUs and daily for the long tail, escalating to hourly during sale windows.
Sample Data: The Row That Started the Conversation
The first delivered dataset produced this record — a flagship SKU the brand believed was cleanly controlled by its own authorised sellers. Values are illustrative.
| Seller |
Price |
Effective Price |
F-Assured |
Plus Price |
Default Seller? |
Authorised? |
| AuthorisedPartner A |
3,499 |
3,349 |
Yes |
3,299 |
No |
Yes |
| AuthorisedPartner B |
3,499 |
3,349 |
Yes |
3,299 |
No |
Yes |
| Unknown Seller 1 |
3,149 |
2,999 |
No |
— |
Yes |
No |
| Unknown Seller 2 |
3,199 |
3,049 |
No |
— |
No |
No |
| Unknown Seller 3 |
3,249 |
3,099 |
Yes |
— |
No |
No |
Three unknown sellers. The default position held by an unauthorised seller with no F-Assured badge, priced 350 rupees below the brand's MAP floor. And an effective price after bank offers that sat 500 rupees below what the brand's own authorised partners were charging.
Across the monitored catalogue, the first full pass surfaced:
- 31 sellers listing the brand's SKUs — against an assumed 2.
- 19 of 64 hero SKUs where the default position was held by an unauthorised seller.
- 26 SKUs with at least one seller below the MAP floor on effective price.
- 7 SKUs where the highest-velocity variant had been out of stock at the brand's own authorised sellers for more than ten consecutive days — while unauthorised sellers stayed in stock and took the position by default.
That last finding reframed the problem. Part of the Buy Box loss was not competitive aggression at all. It was the brand's own supply chain handing the position away.
What the Brand Did With It
Week 1–2 — Enforcement. The brand's legal team issued takedown and cease-and-desist notices against the sellers with the clearest MAP violations, using the timestamped price history from the dataset as evidence. Sixteen of the flagged listings were removed or brought back above the floor within three weeks.
Week 2–6 — Supply correction. The variant-level stock data went to the supply team. Seven high-velocity variants that had been chronically under-allocated to the authorised sellers were re-prioritised in the replenishment plan.
Week 3–10 — Pricing response. The effective-price data changed the brand's benchmarking. The team had been comparing listed prices; competitors were competing on post-offer effective price. The brand restructured its own bank-offer participation on six SKUs to close the gap without discounting the headline price.
Ongoing — Monitoring. A daily alert now fires whenever a new seller appears on a brand SKU, whenever the default position shifts away from an authorised seller, or whenever any effective price crosses the MAP floor.
The Results (First 90 Days)
| Metric |
Before |
After 90 Days |
| Sellers listing brand SKUs |
31 (16 unauthorised) |
14 (3 unauthorised) |
| Hero SKUs where authorised seller held default position |
45 of 64 |
58 of 64 |
| SKUs with MAP violations on effective price |
26 |
4 |
| Hero variants out of stock >7 days |
7 |
1 |
| Flipkart channel revenue, indexed |
100 |
122 |
Figures are representative of the engagement outcome.
The brand recovered the default position on 13 additional hero SKUs, cut unauthorised sellers by roughly 80 percent, and grew Flipkart channel revenue by 22 percent over the quarter — without increasing ad spend and without cutting headline prices.
Why It Worked
Nothing in this engagement was exotic. There was no proprietary model and no clever algorithm. The entire outcome rested on one decision: capture the full seller array instead of a single price.
That one schema change turned an invisible problem into a list of named sellers, specific SKUs, and timestamped price evidence — which is exactly the form a legal team, a supply team, and a pricing team can each act on.
The lesson generalises. On Flipkart, the data you do not capture is usually where the revenue is leaking.
Work With Product Data Scrape
Product Data Scrape delivers Flipkart seller data scraping with the full seller array, F-Assured status, dual-tier pricing, per-variant stock, pincode-level pricing, and MAP-violation alerting — delivered as JSON, CSV, API, or straight into your warehouse.
If you suspect your Flipkart listings are leaking revenue to sellers you cannot see, we will run a diagnostic pass on a sample of your SKUs and show you the seller array behind them.
Product Data Scrape — turning marketplace complexity into decision-ready data.


 Singapore
 EMAIL
EMAIL
 PHONE
PHONE


.webp)
.webp "thumb")
.webp "thumb")
.webp "thumb")













.webp)






