Introduction
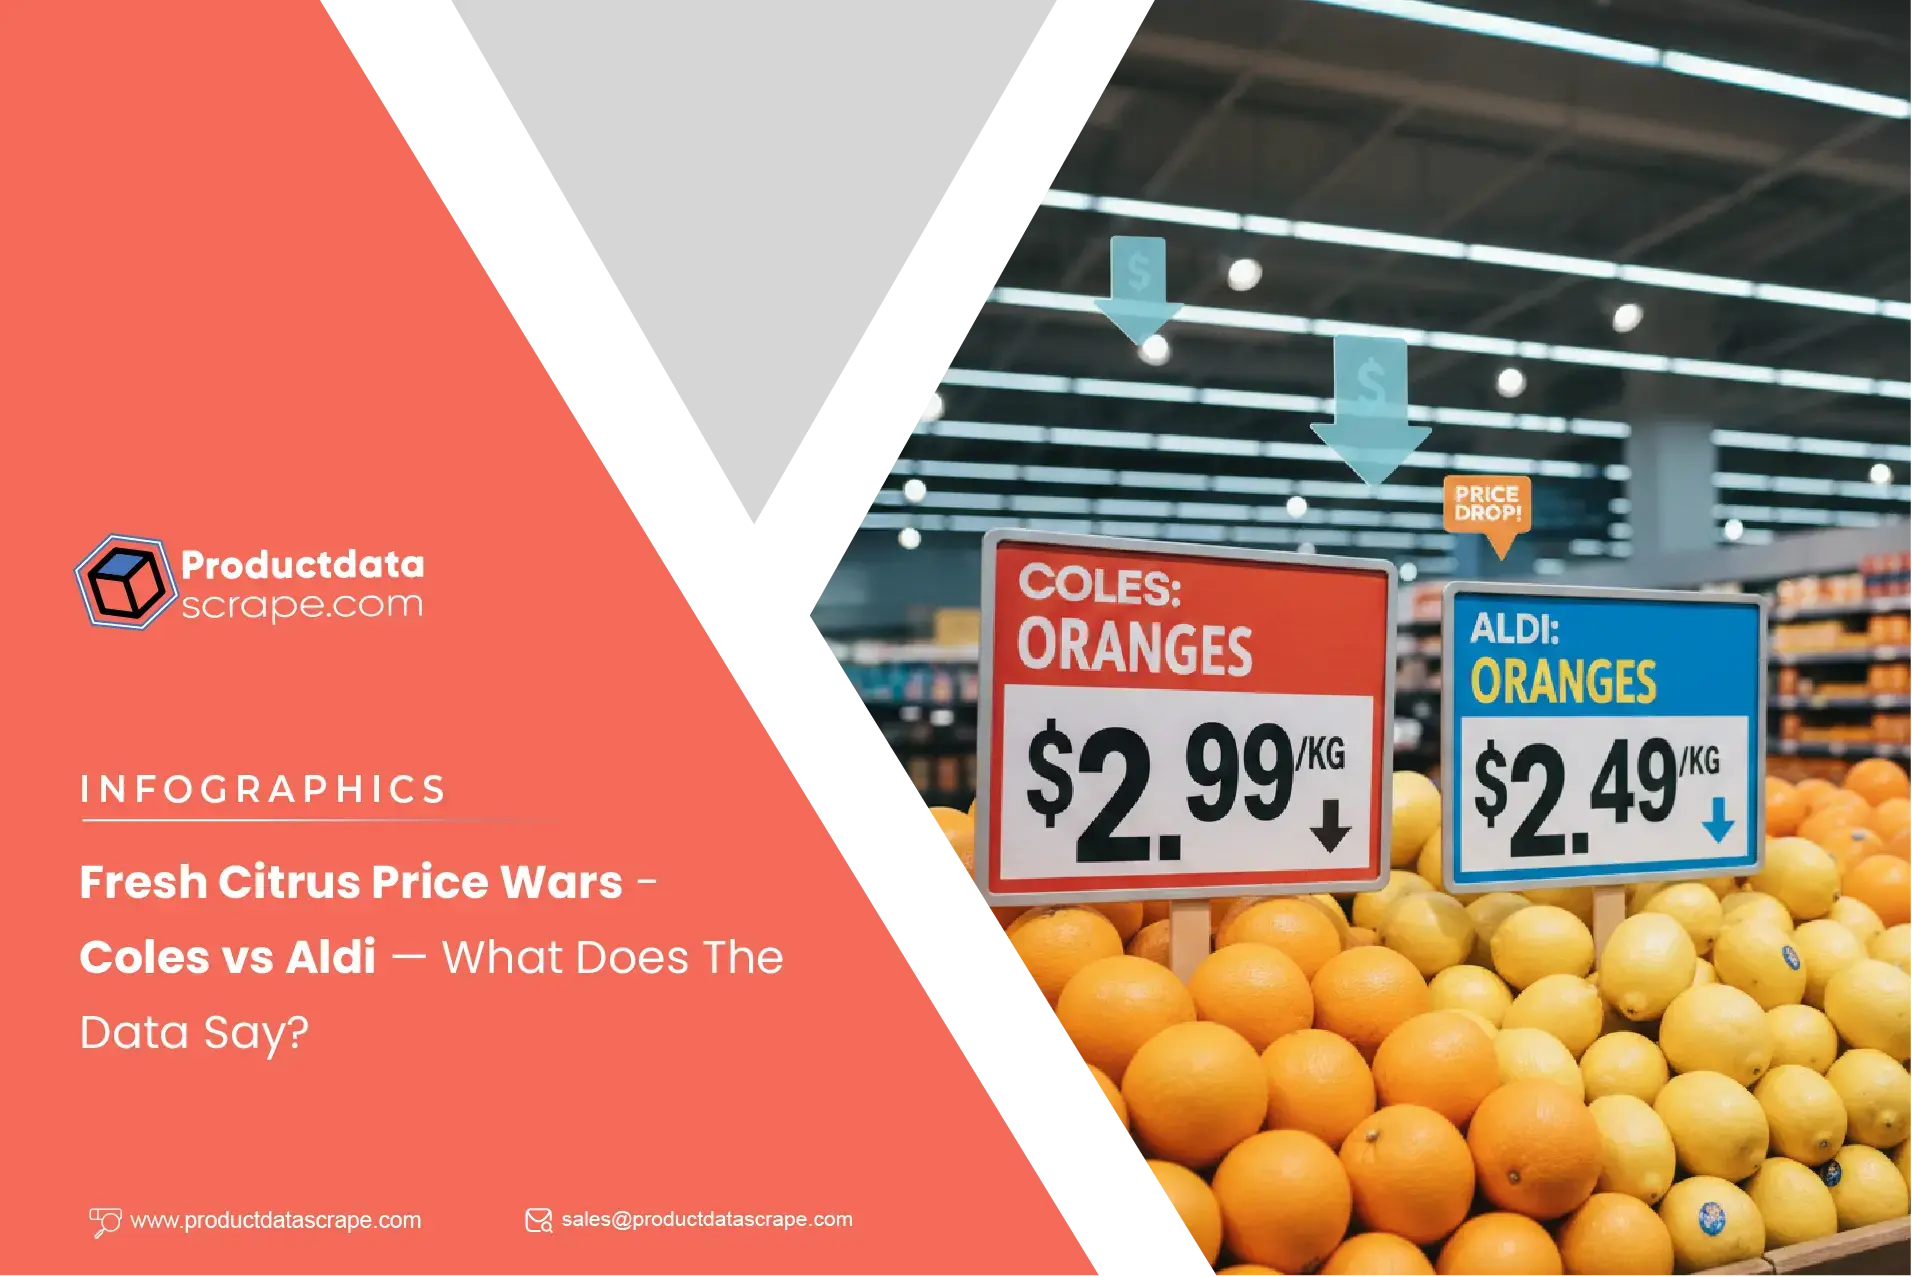
The rapid growth of quick commerce has transformed how consumers shop, making real-time pricing intelligence a necessity rather than a luxury. Businesses operating in this space must constantly adapt to fluctuating product prices, delivery fees, and competitor strategies. Building a Q-Commerce Price Intelligence Dashboard enables organizations to centralize insights, monitor trends, and make faster, data-driven decisions.
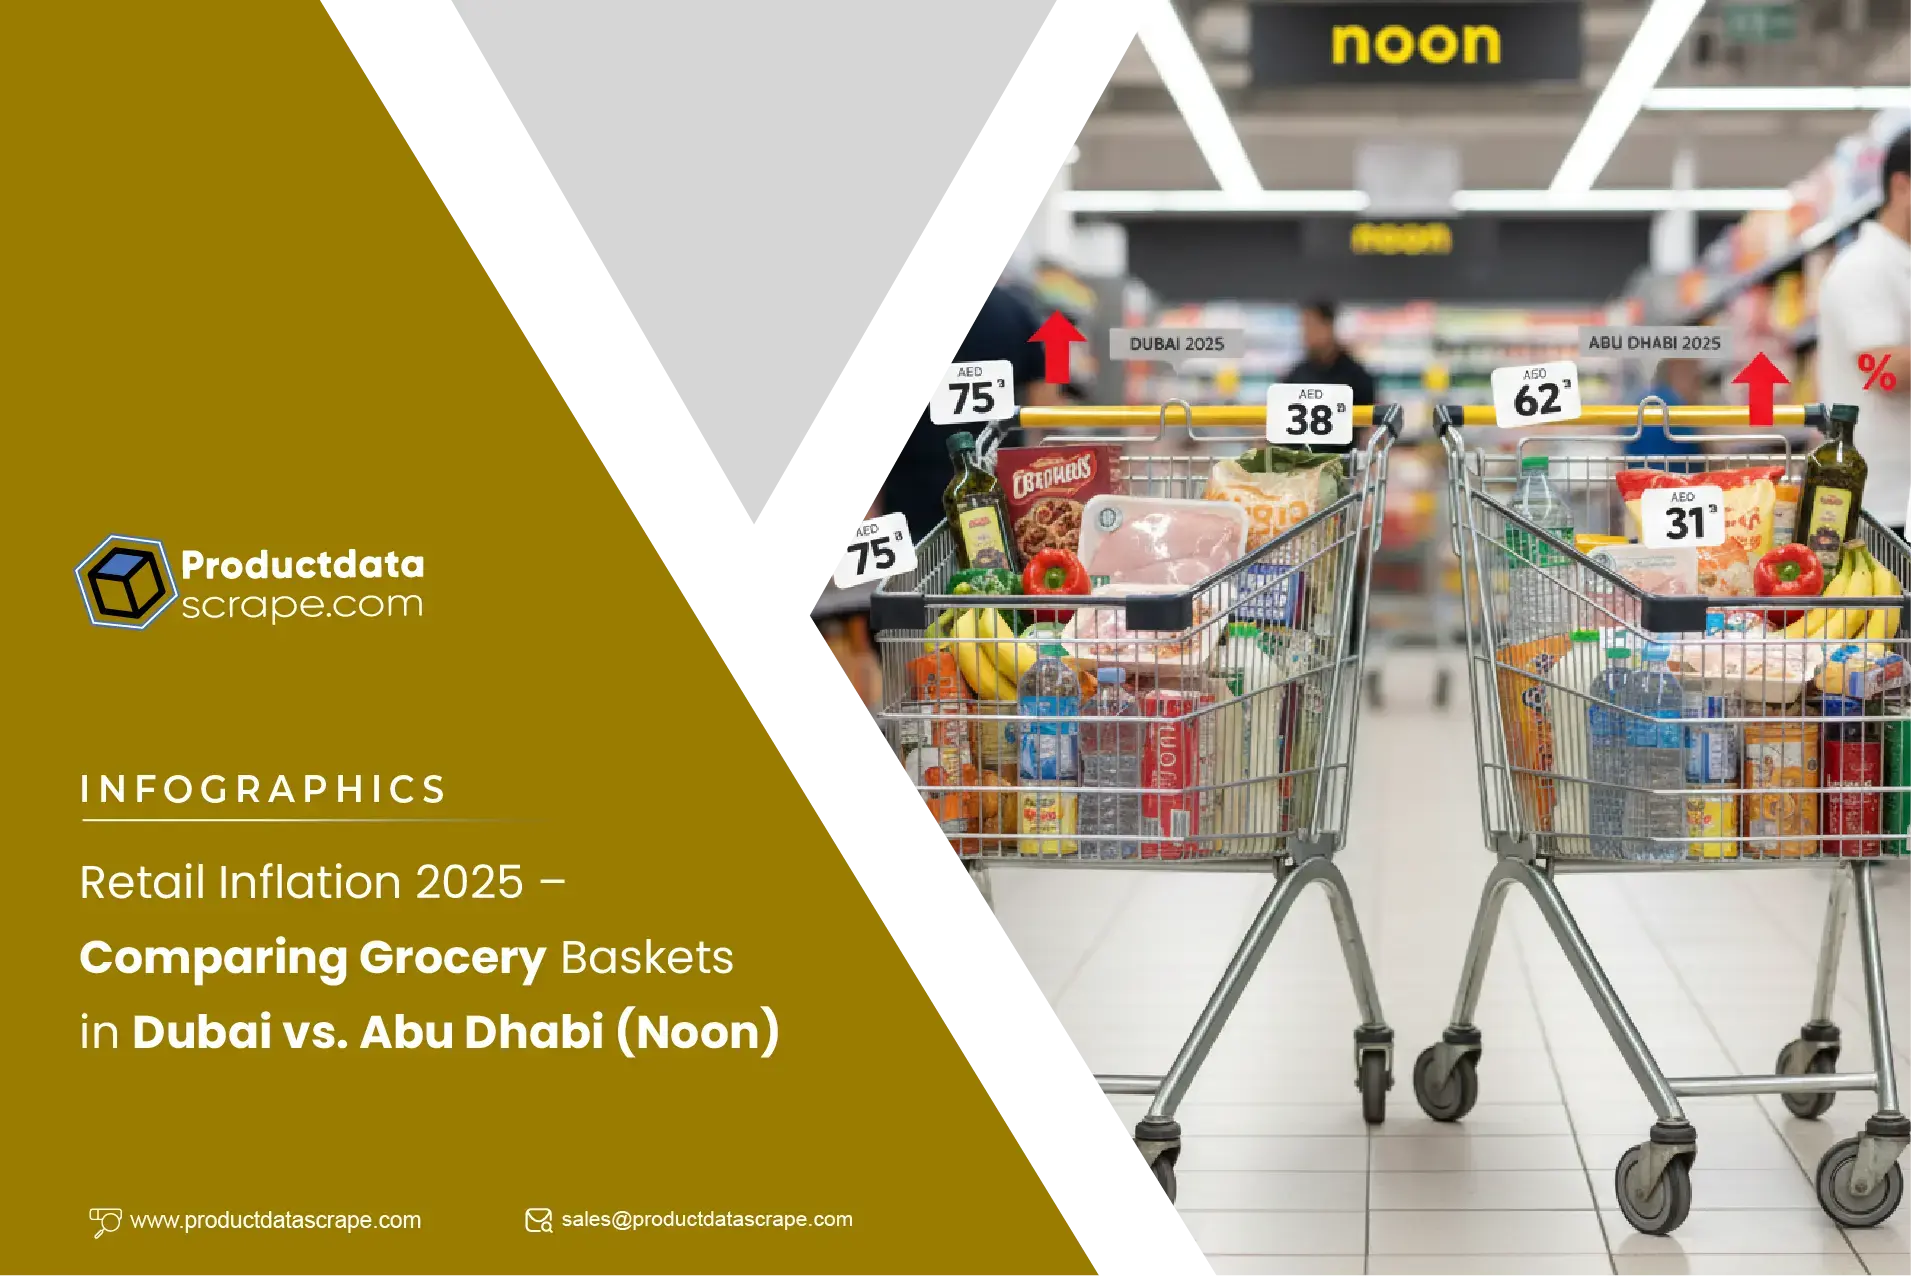
To power such a system, companies need robust mechanisms to Extract Quick Commerce Product Data from multiple platforms. This includes capturing product listings, pricing variations, discounts, and delivery charges across regions and time slots. By integrating structured data pipelines with advanced analytics, businesses can gain a competitive edge while protecting margins. This guide explores the architecture, data sources, and strategic approaches required to build an effective pricing intelligence dashboard. With insights backed by trends and datasets from 2020 to 2026, you’ll understand how to transform raw data into actionable intelligence for sustainable growth.
Evolving dynamics of pricing intelligence
Building a scalable pricing system starts with adopting a Real-time Q-commerce Pricing Dashboard that continuously captures pricing changes. Integrating this with Pricing Intelligence Services allows businesses to detect fluctuations instantly and adjust strategies proactively.
Between 2020 and 2026, quick commerce pricing volatility increased significantly due to demand surges and operational costs.
| Year |
Avg Price Change Frequency |
Discount Variability (%) |
| 2020 |
Low |
10% |
| 2022 |
Moderate |
18% |
| 2024 |
High |
27% |
| 2026 |
Very High |
35% |
These trends show how dynamic pricing has become. Businesses using real-time dashboards can respond faster to competitor price changes, optimize promotions, and improve customer retention. Without such systems, companies risk delayed reactions and lost revenue opportunities.
A modern dashboard consolidates pricing signals from multiple sources, enabling teams to visualize patterns and predict future trends effectively.
Integrating multiple data sources efficiently
A strong foundation for pricing intelligence lies in building a Multi-platform Q-commerce pricing dashboard that aggregates data from various quick commerce platforms. Combined with Price Monitoring, businesses can track pricing variations across regions, categories, and timeframes.
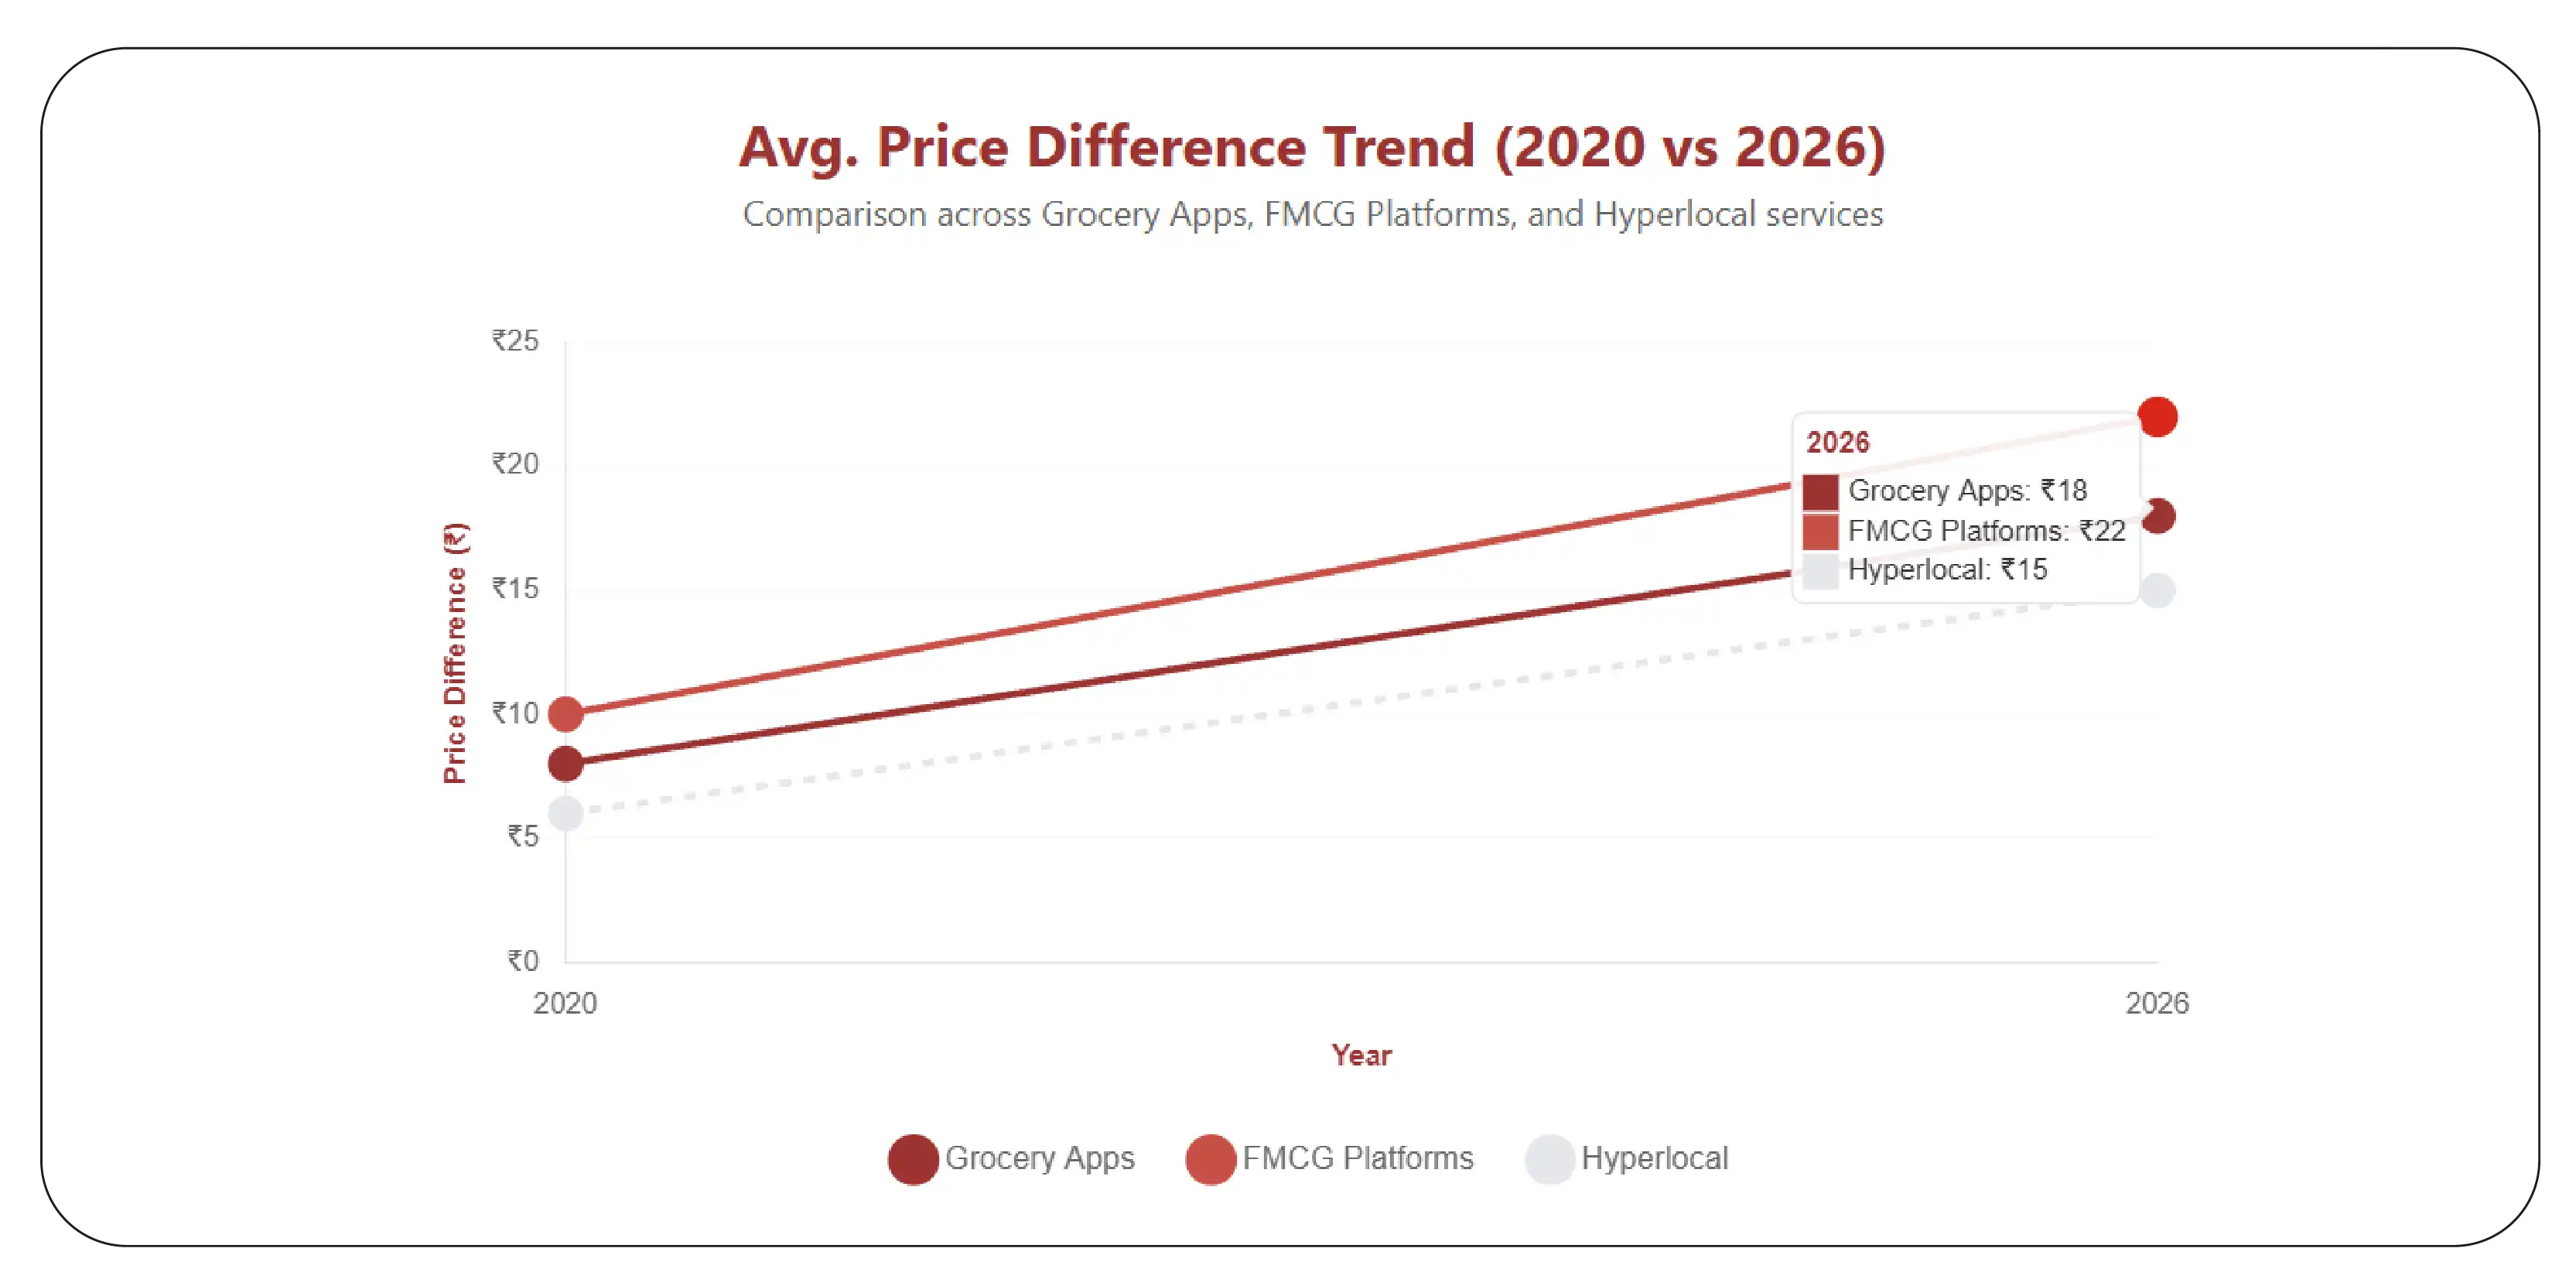
From 2020 to 2026, cross-platform price differences for identical products have widened due to competition and logistics costs.
| Platform Type |
Avg Price Difference (₹) 2020 |
Avg Price Difference (₹) 2026 |
| Grocery Apps |
8 |
18 |
| FMCG Platforms |
10 |
22 |
| Hyperlocal |
6 |
15 |
These variations highlight the importance of integrating multiple data sources into a single dashboard. Businesses can identify pricing gaps, benchmark competitors, and align their strategies accordingly.
A unified system ensures that decision-makers have access to consistent, real-time data, eliminating silos and improving operational efficiency.
Turning raw data into actionable strategies
Data collection alone is not enough—businesses must Scrape Quick commerce pricing data for dashboard and convert it into meaningful insights. By aligning this data with Product Pricing Strategies, companies can optimize pricing models and maximize profitability.
Historical data shows that strategic pricing adjustments can significantly impact revenue growth:
| Strategy Type |
Revenue Impact 2020 |
Revenue Impact 2026 |
| Static Pricing |
+5% |
+3% |
| Dynamic Pricing |
+12% |
+20% |
| AI-based Pricing |
+18% |
+28% |
These insights demonstrate the growing importance of dynamic and AI-driven pricing strategies. By analyzing competitor prices, customer demand, and seasonal trends, businesses can refine their pricing models for better outcomes.
A well-designed dashboard transforms raw data into actionable insights, enabling faster and more accurate decision-making.
Designing a scalable system framework
A robust architecture is essential for building an effective dashboard. Implementing a Q-commerce Price intelligence dashboard Architecture ensures seamless data flow, storage, and processing. Leveraging Web Scraping API Services enables automated, scalable data collection across multiple platforms.
Key architectural components include:
- Data extraction layer (APIs and scraping tools)
- Data storage (cloud databases, data lakes)
- Processing layer (ETL pipelines)
- Visualization layer (dashboard tools)
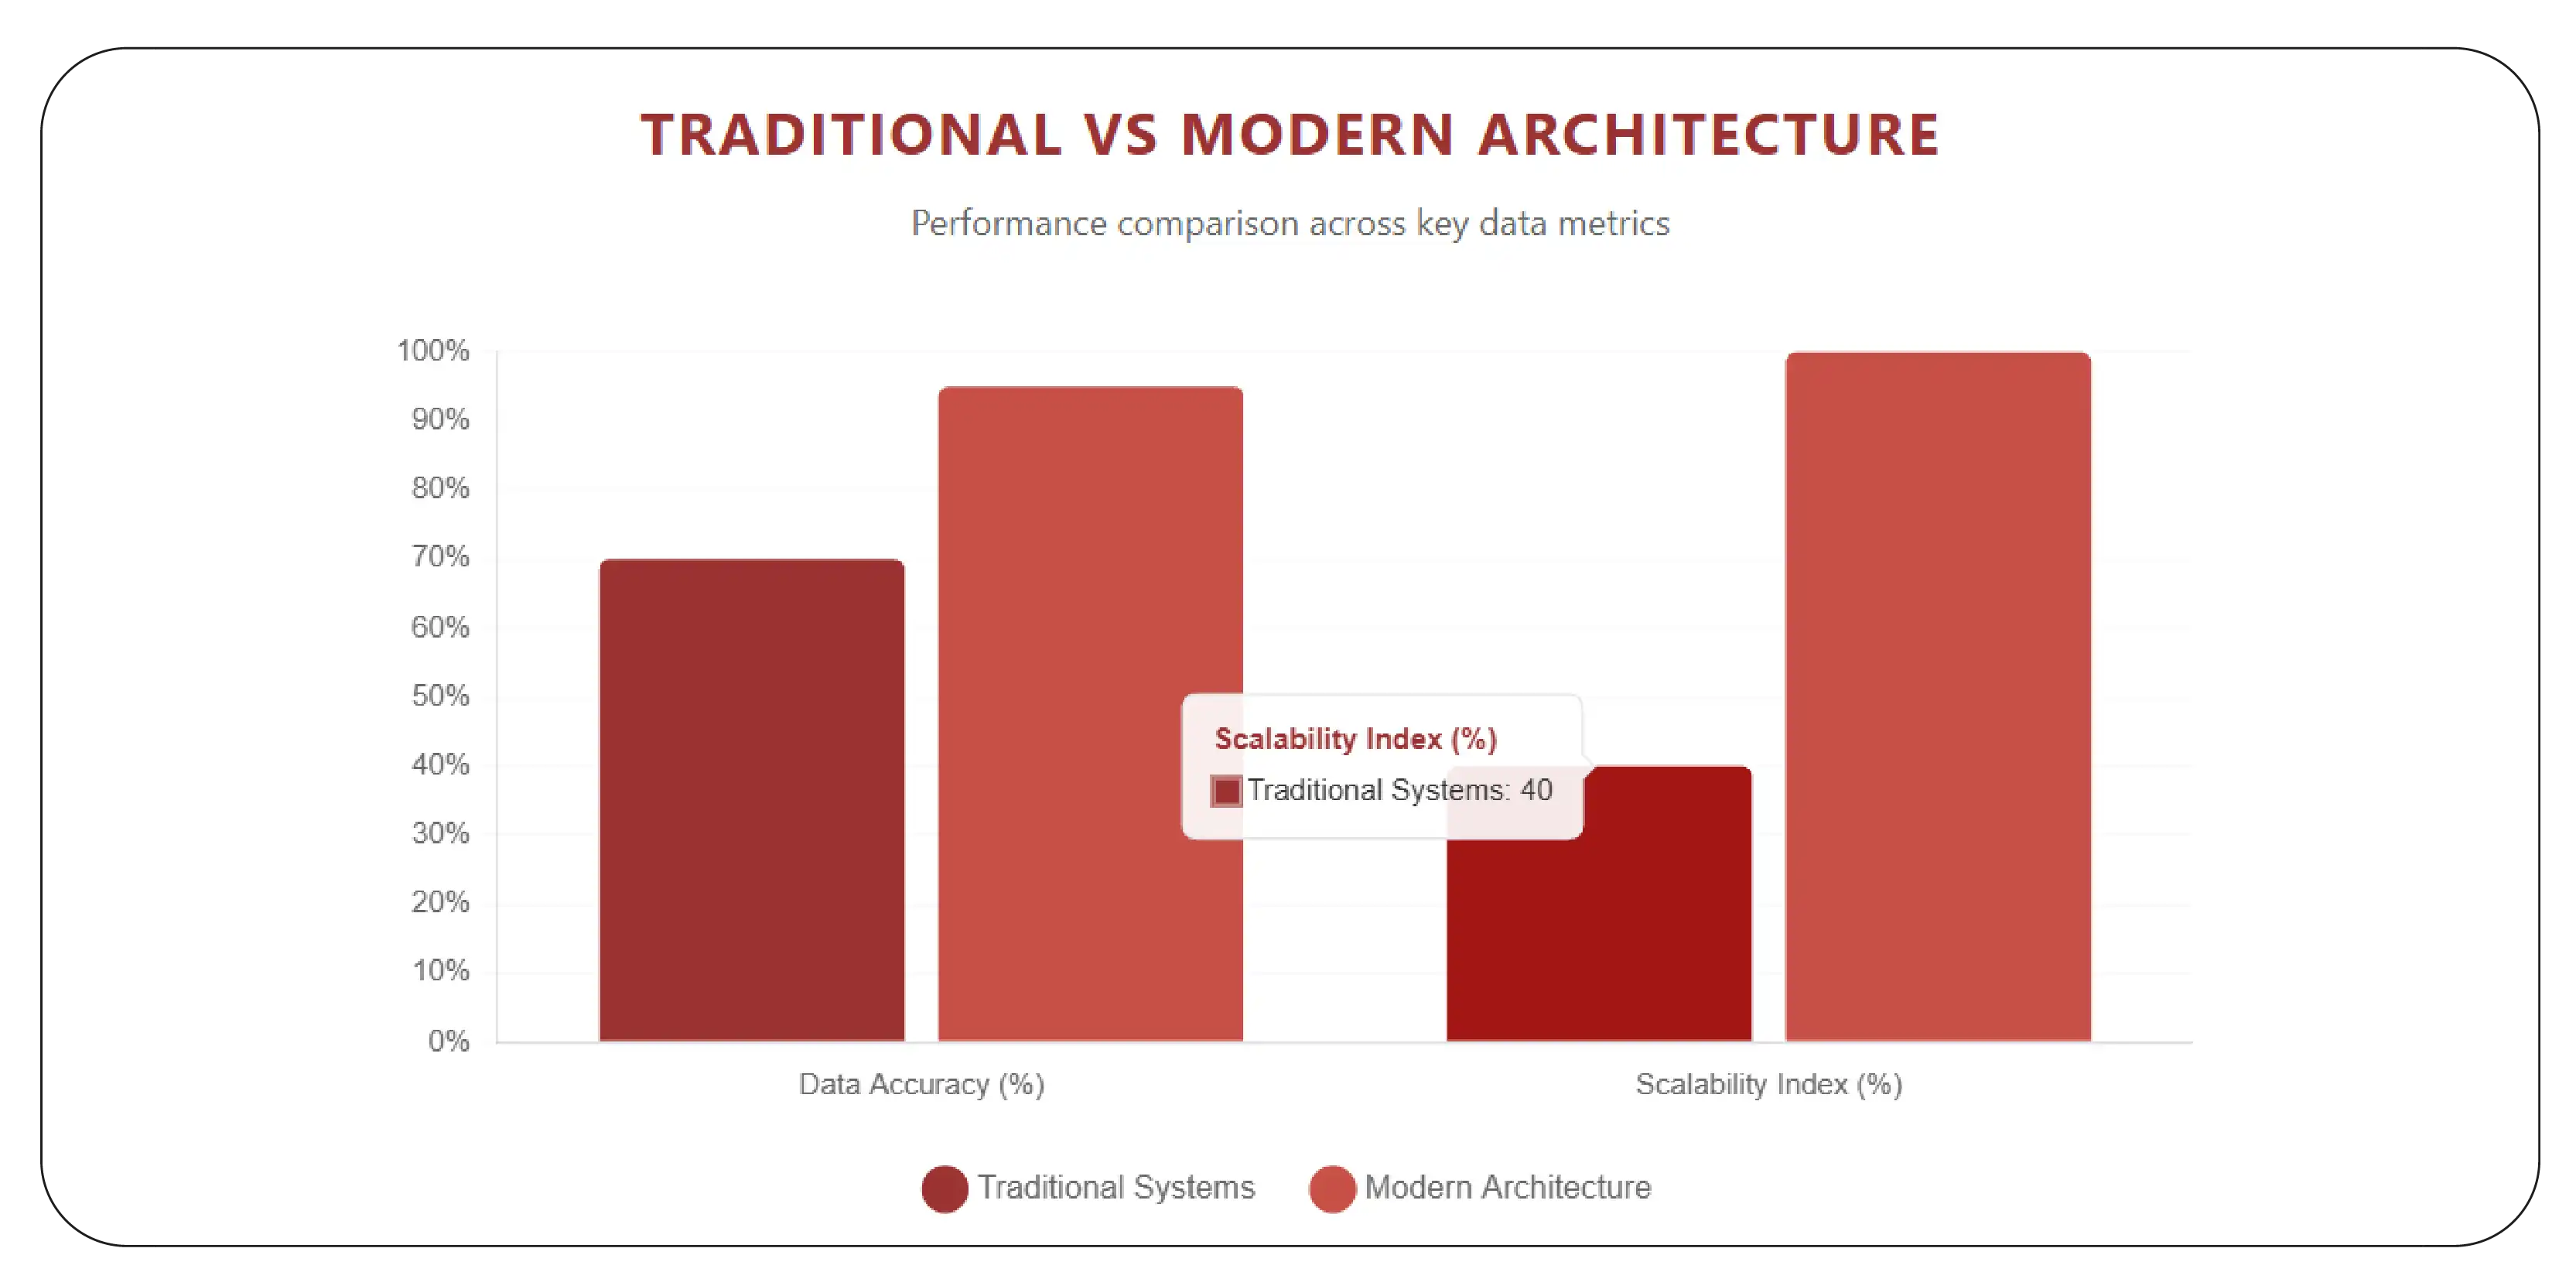
From 2020 to 2026, businesses adopting scalable architectures reported improved data accuracy and faster processing times:
| Metric |
Traditional Systems |
Modern Architecture |
| Data Latency |
24 hrs |
Real-time |
| Data Accuracy |
70% |
95% |
| Scalability |
Limited |
High |
A scalable architecture ensures that the dashboard can handle increasing data volumes while maintaining performance and reliability.
Enhancing competitive benchmarking capabilities
Understanding competitor pricing is critical for success. A Competitor Price tracking dashboard for Quick commerce enables businesses to monitor rival strategies and adjust their own pricing accordingly.
From 2020 to 2026, competitor-driven pricing adjustments increased significantly, with companies relying heavily on benchmarking data:
| Year |
Competitor Influence on Pricing (%) |
| 2020 |
20% |
| 2022 |
32% |
| 2024 |
45% |
| 2026 |
58% |
These figures highlight the growing importance of competitor tracking. Businesses can identify underpriced or overpriced products, optimize promotions, and maintain a competitive edge.
A dedicated dashboard provides real-time insights into competitor behavior, enabling faster responses and better strategic alignment.
Leveraging insights for long-term growth
To sustain growth, businesses must implement a Q-commerce Price Monitoring Dashboard that provides continuous insights into pricing trends. This helps identify patterns, forecast future changes, and optimize long-term strategies.
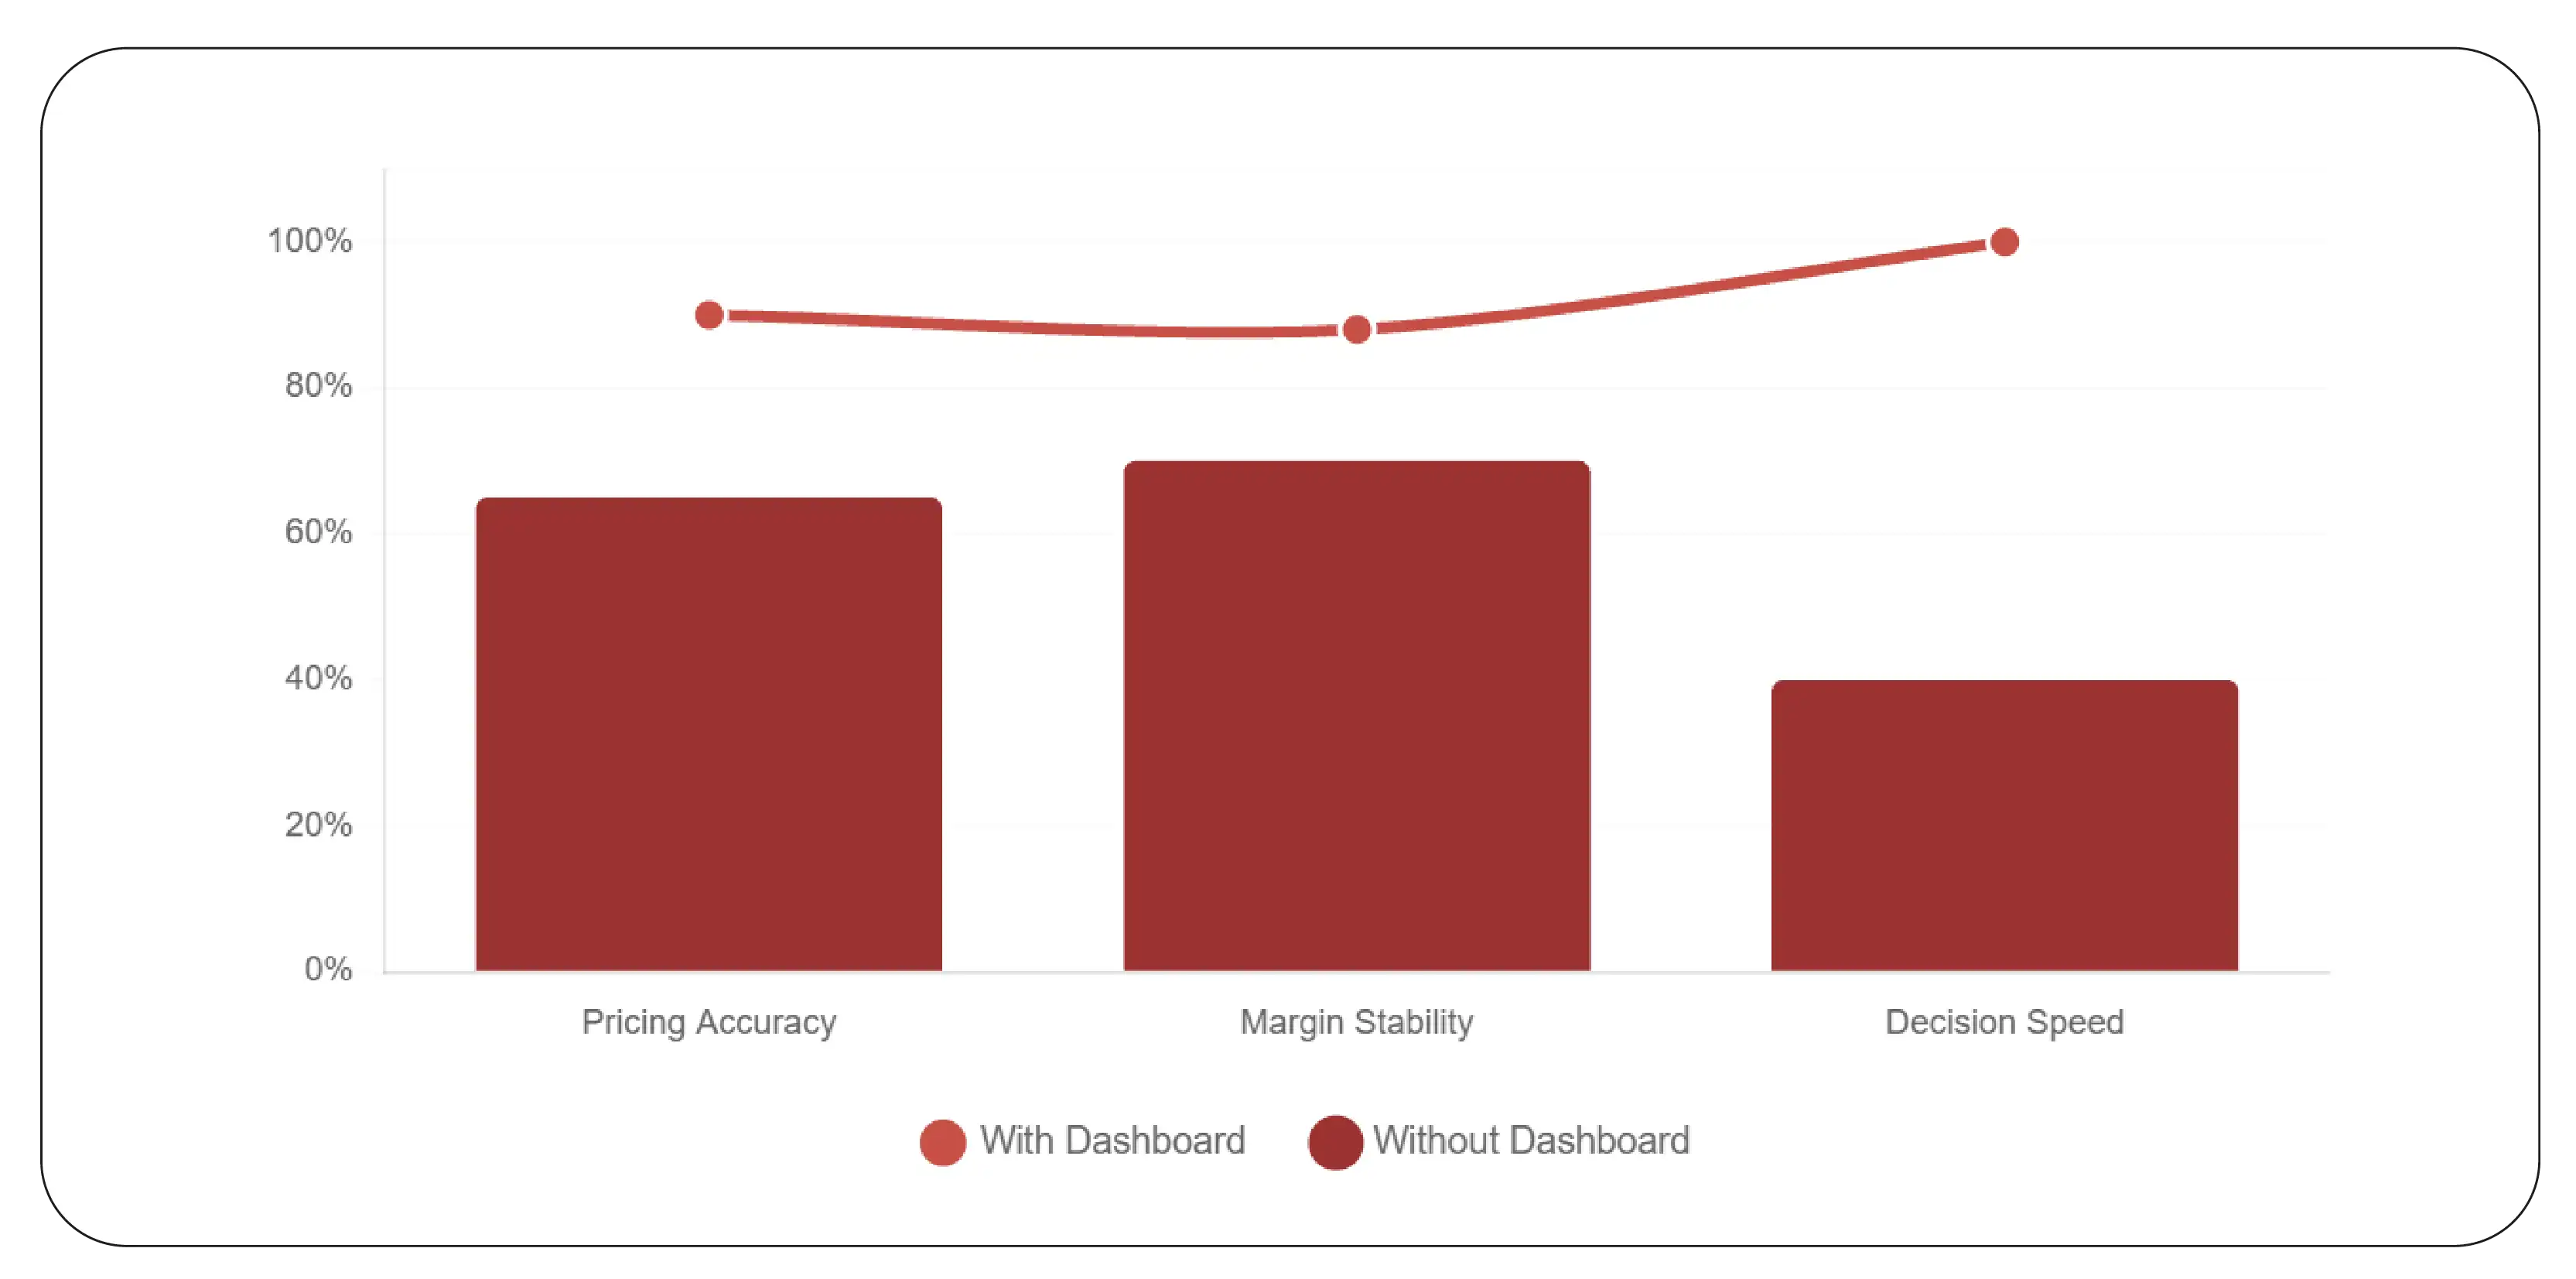
Data from 2020 to 2026 shows that companies using advanced monitoring tools achieved better performance:
| Performance Metric |
Without Dashboard |
With Dashboard |
| Pricing Accuracy |
65% |
90% |
| Margin Stability |
70% |
88% |
| Decision Speed |
Slow |
Fast |
These improvements demonstrate the value of continuous monitoring. By leveraging insights from dashboards, businesses can refine pricing strategies, improve customer satisfaction, and drive sustainable growth.
A long-term approach ensures that companies remain competitive in an ever-changing market landscape.
Why Choose Product Data Scrape?
Product Data Scrape provides advanced solutions for building and maintaining pricing intelligence systems. With a powerful Q-Commerce Price Intelligence Dashboard API, businesses can seamlessly collect, process, and analyze data from multiple sources.
By leveraging the Q-Commerce Price Intelligence Dashboard, organizations gain access to real-time insights, automated data pipelines, and scalable infrastructure. This enables accurate pricing analysis, improved decision-making, and enhanced competitiveness. With high data accuracy, reliable support, and customizable solutions, Product Data Scrape empowers businesses to unlock the full potential of quick commerce data and achieve sustainable growth.
Conclusion
Building a pricing intelligence system is essential for navigating the complexities of quick commerce. By leveraging a Grocery store dataset alongside advanced analytics, businesses can gain deeper insights into pricing trends and customer behavior.
A well-designed Q-Commerce Price Intelligence Dashboard enables organizations to monitor real-time changes, optimize pricing strategies, and stay ahead of competitors. The ability to transform raw data into actionable insights ensures better decision-making and long-term success.
Now is the time to invest in data-driven pricing intelligence. Start building your dashboard today and turn real-time insights into a powerful competitive advantage!
FAQs
1. What is a Q-commerce price intelligence dashboard?
A Q-commerce price intelligence dashboard is a system that collects, analyzes, and visualizes pricing data from quick commerce platforms to help businesses make informed pricing decisions and stay competitive.
2. Why is real-time pricing data important?
Real-time pricing data helps businesses respond quickly to market changes, optimize pricing strategies, and maintain competitiveness in a fast-moving quick commerce environment.
3. How is pricing data collected for dashboards?
Pricing data is collected using web scraping, APIs, and automated tools that extract product prices, discounts, and delivery charges from multiple platforms.
4. What are the benefits of using a pricing dashboard?
Pricing dashboards improve decision-making, enhance pricing accuracy, enable competitor benchmarking, and help businesses maintain profitability through data-driven insights.
5. How can businesses implement such solutions?
Businesses can use Product Data Scrape to build scalable dashboards with automated data collection, real-time analytics, and actionable insights for effective pricing strategies.


.webp)