The Client
A mattress and sleep brand selling across the three marketplaces where Indian mattress demand concentrates — Amazon, Flipkart, and Pepperfry — plus its own D2C site. A recognised name, a competitive product, and a marketing budget it believed was working.
Client details are anonymised. Figures are representative of the engagement.
The Problem: Spending on Search and Still Losing the Category
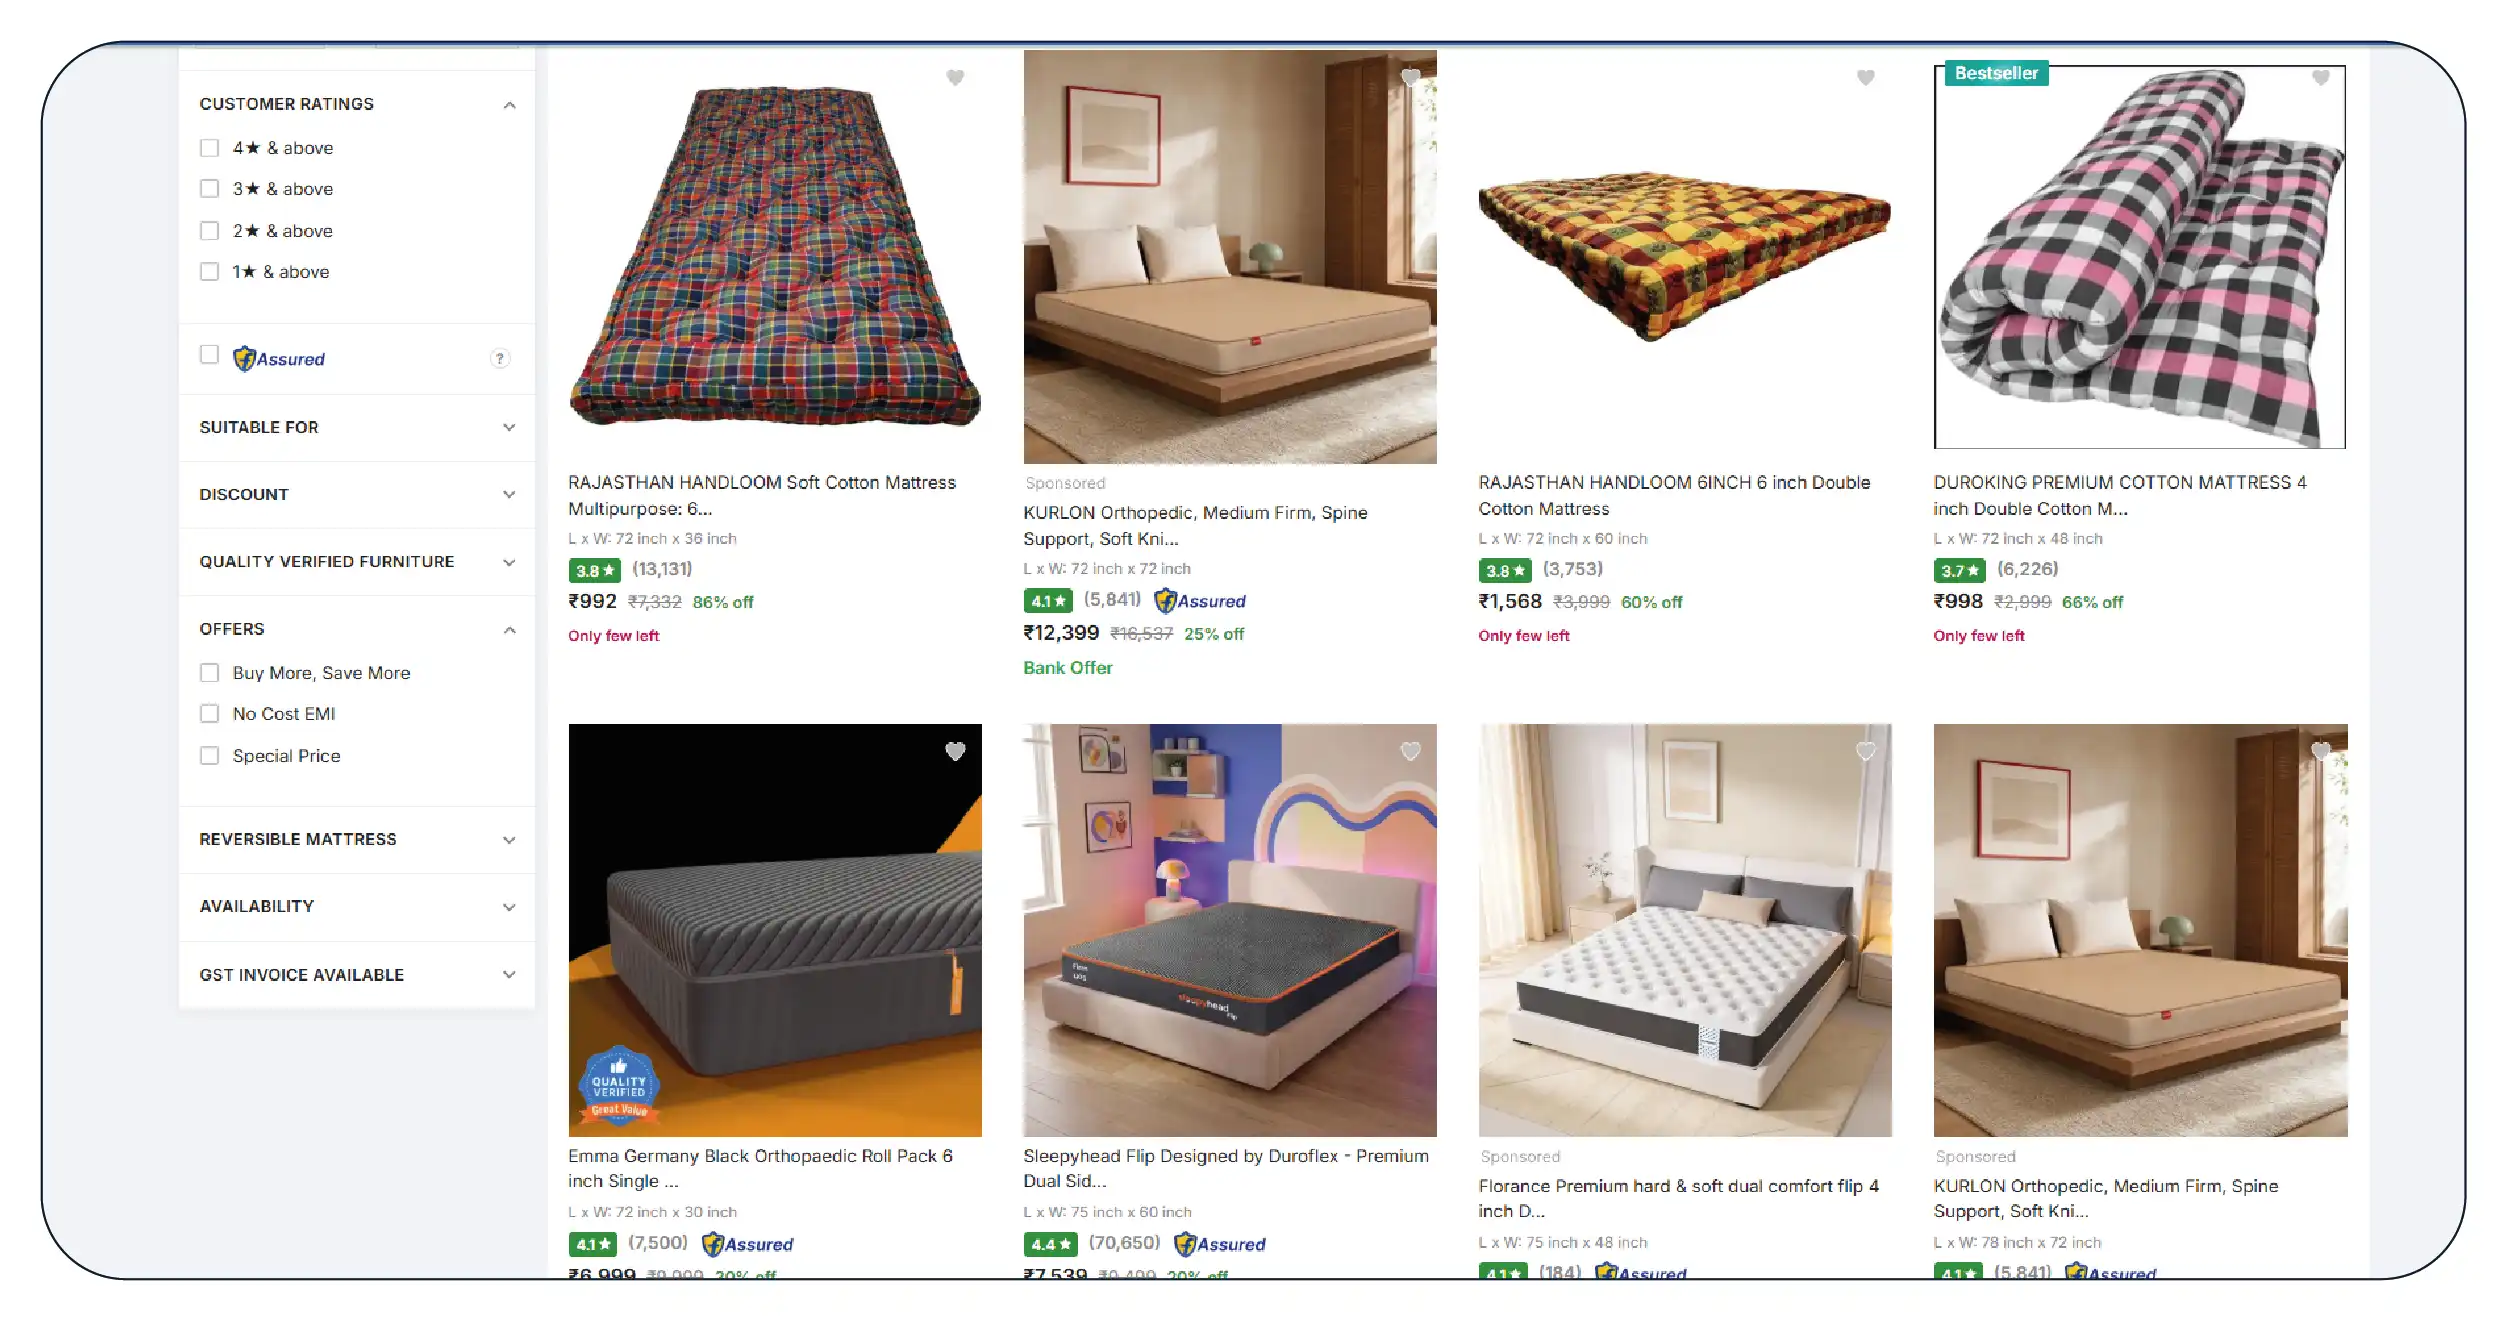
The brand was investing steadily in marketplace advertising and had strong reviews on its hero products. Yet its category share was slipping, and the marketing team could not explain why the spend was not translating into position.
The gap was in what they measured. The team tracked its own SKUs — rank, rating, price, sales. It had no view of the category page as a whole: when a shopper searched "memory foam mattress" or "orthopedic mattress queen size," how much of the first screen belonged to the brand, and how much to competitors?
That is share of shelf, and the brand had never measured it. It knew its own products ranked "reasonably well." It did not know that on the highest-traffic search terms, a single competitor occupied several of the top positions while the brand appeared once, below the fold, on the second screen.
The marketing lead's summary: we've been optimising our listings one at a time and never once looked at the shelf they sit on.
Why Single-SKU Tracking Missed It
Rank tracking on your own SKUs answers "where does my product appear?" Share of shelf answers "who owns the search result?" — and they are very different questions.
A SKU can rank "well" and still lose the shelf. Ranking eighth is fine in isolation and invisible in practice if positions one through seven belong to two competitors. The shopper decides from the first screen, and a brand with one eighth-place listing has effectively no presence on that term.
Position concentration matters more than any single rank. A competitor holding four of the top ten positions on a high-traffic term dominates that term regardless of where the brand's single listing sits. Single-SKU tracking cannot see concentration, because it only looks at one SKU.
It varies by marketplace and by term. The brand's shelf position on Pepperfry was not its position on Amazon, and its position on "memory foam mattress" was not its position on "orthopedic mattress." A single blended "we rank okay" hid enormous variation across the grid that actually mattered.
The Solution: Multi-Marketplace Share of Shelf Tracking
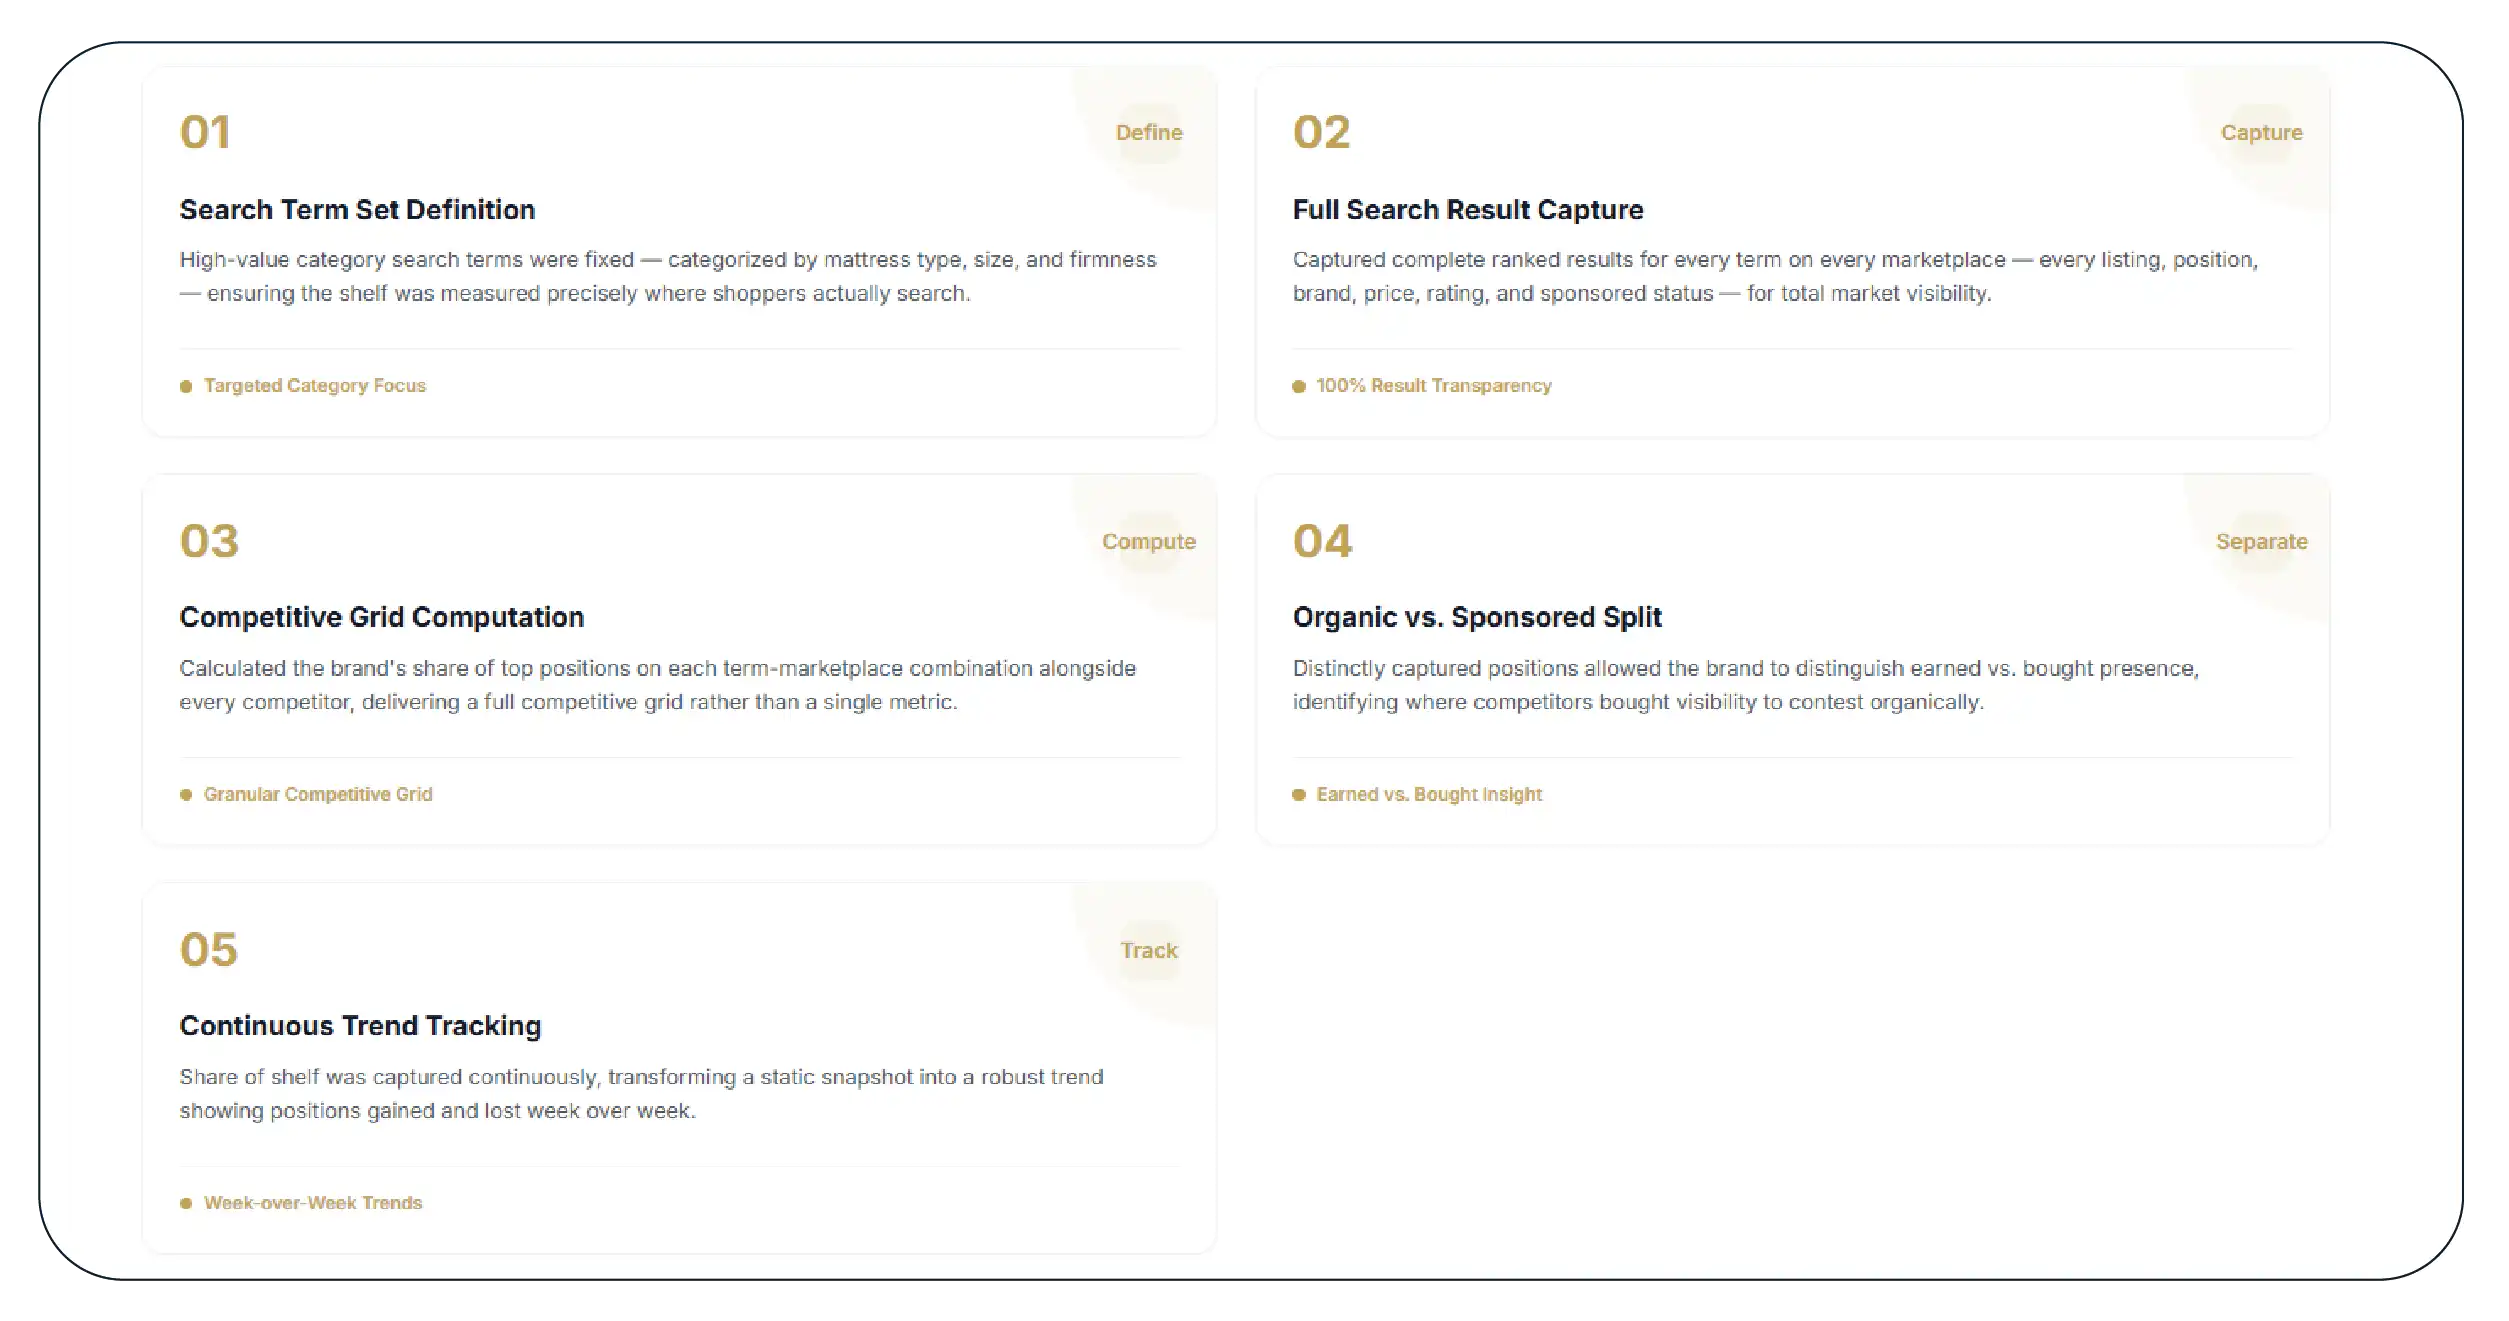
Product Data Scrape built mattress share of shelf tracking across all three marketplaces on the search terms that drive category demand.
- Defined the search term set. The high-value category search terms were fixed — by mattress type, size, and firmness — so the shelf was measured where shoppers actually searched.
- Captured the full search result, not just the brand. For every term on every marketplace, the complete ranked result was captured — every listing, its position, brand, price, rating, and sponsored-versus-organic status — so share of shelf could be computed for the brand and every competitor.
- Computed share of shelf per term, per marketplace. The brand's share of the top positions was calculated on each term-marketplace combination, alongside every competitor's, producing a full competitive grid rather than a single number.
- Separated organic from sponsored. Because sponsored and organic positions were captured distinctly, the brand could see whether its presence was earned or bought — and where a competitor was buying position the brand could contest organically.
- Tracked it over time. Share of shelf was captured continuously, turning a one-time snapshot into a trend that showed position gained and lost week over week.
Sample Data: The Share-of-Shelf Grid
An illustrative top-10 share of shelf across the three marketplaces for one high-traffic term.
| Search Term: "memory foam mattress queen" |
Amazon |
Flipkart |
Pepperfry |
| Our brand — share of top 10 |
10% (1 listing, pos 8) |
20% (2 listings) |
10% (1 listing, pos 9) |
| Competitor A — share of top 10 |
40% (4 listings) |
30% |
20% |
| Competitor B — share of top 10 |
20% |
20% |
40% |
| All others |
30% |
30% |
30% |
| Our best organic position |
8 |
5 |
9 |
| Our sponsored positions |
1 |
0 |
0 |
Illustrative figures.
The structured record:
{
  "search_term": "memory foam mattress queen",
  "captured_at": "2026-07-14T10:15:00+05:30",
  "marketplace": "amazon_in",
  "top_10_results": [
    {"position": 1, "brand": "Competitor A", "sponsored": true,  "rating": 4.3, "price": 18999},
    {"position": 2, "brand": "Competitor A", "sponsored": false, "rating": 4.4, "price": 19499},
    {"position": 3, "brand": "Competitor B", "sponsored": false, "rating": 4.2, "price": 17999},
    {"position": 4, "brand": "Competitor A", "sponsored": false, "rating": 4.5, "price": 21999},
    {"position": 8, "brand": "Our Brand",    "sponsored": true,  "rating": 4.6, "price": 20499}
  ],
  "share_of_shelf": {
    "our_brand_pct": 10,
    "competitor_a_pct": 40,
    "competitor_b_pct": 20,
    "our_best_organic_position": null,
    "our_presence_is_paid_only": true
  }
}
The line that stopped the room: on this term, on Amazon, the brand's only top-10 presence was a sponsored placement — it had no organic position in the top ten at all, while Competitor A held four, three of them organic. The brand was renting a single spot on a shelf a competitor owned outright.
What the Brand Did
Reallocated spend to contested terms. Share of shelf showed which terms the brand could realistically contest and which a competitor had locked up. Ad budget moved off the locked-up terms — where it was buying a token position at high cost — and onto terms where a modest push could win real share.
Attacked the organic gap. On terms where its presence was sponsored-only, the brand worked the underlying listings — content, attributes, reviews — to earn organic positions rather than perpetually renting one.
Prioritised by marketplace. Because the grid was per-marketplace, the brand invested differently on each — defending where it led, challenging where a single competitor was beatable, and not over-spending where the shelf was already lost.
Tracked the movement. Weekly share-of-shelf trend replaced the old blended rank report, so the team could see position won and lost and tie it to what they had changed.
The Results (One Quarter)
| Metric |
Before |
After One Quarter |
| Share of top 10 on priority terms (blended) |
~12% |
~24% |
| Terms with an organic top-10 position |
Few |
Majority of priority terms |
| Sponsored-only presence on priority terms |
Common |
Sharply reduced |
| Ad spend on locked-up (unwinnable) terms |
High |
Redirected |
| Category revenue, indexed |
100 |
129 |
| Return on ad spend, priority terms |
100 |
141 |
Figures are representative of the engagement outcome.
The marketing lead's follow-up: we were optimising listings and losing the shelf. Once we could see the shelf, the budget finally had somewhere sensible to go.
The Lesson
A high rank on your own SKU feels like success and can coexist with owning almost none of the search result. The shopper does not evaluate your listing in isolation; they scan a screen and choose from it. If competitors hold most of that screen, your well-optimised listing is a strong entry in a race you have mostly ceded.
Share of shelf reframes marketplace performance from "how is my product doing?" to "who owns the category?" — and only the second question explains why a brand can spend steadily on search, rank respectably, and still watch its share slide. You cannot win a shelf you have never measured.
Work With Product Data Scrape
Product Data Scrape delivers mattress share of shelf tracking across Amazon, Flipkart, Pepperfry, and any marketplace that matters: full search-result capture, per-term and per-marketplace share of shelf, organic-versus-sponsored separation, and competitor position grids tracked over time — as JSON, CSV, API, or dashboard-ready feeds.
Ask us for a share-of-shelf snapshot on your priority terms — we will show you which shelves you own, which you rent, and which a competitor has quietly locked up.
Product Data Scrape — turning marketplace complexity into decision-ready data.


 Singapore
 EMAIL
EMAIL
 PHONE
PHONE


.webp)
.webp "thumb")
.webp "thumb")
.webp "thumb")













.webp)






