
Executive Summary
A loyalty currency is a discount that the issuer hopes you will not spend.
That sentence sounds cynical, and it is not meant to be — it is simply the economics. A loyalty currency is cheaper to issue than an equivalent price cut for three structural reasons, all of which are entirely legitimate and all of which are why loyalty currencies exist at all: the benefit is deferred, it is capped, and a portion of it is never redeemed.
This study examines Flipkart SuperCoin economics across a monitored panel. It asks three questions that pricing teams rarely ask about a mechanic they rarely track:
How much do earn rates actually vary, and along what lines?
What is a SuperCoin realistically worth once deferral, caps, and breakage are accounted for?
What does the pattern of earn rates reveal that is not visible anywhere else?
The short version of the answer: earn rates vary far more than most teams assume, the variation is systematic rather than random, and it constitutes a public, free, and almost entirely unwatched signal about where promotional effort is being deployed.
This report is published by Product Data Scrape. Figures are representative of observed patterns across our Flipkart monitoring panel and are illustrative rather than a market census.
1. Methodology
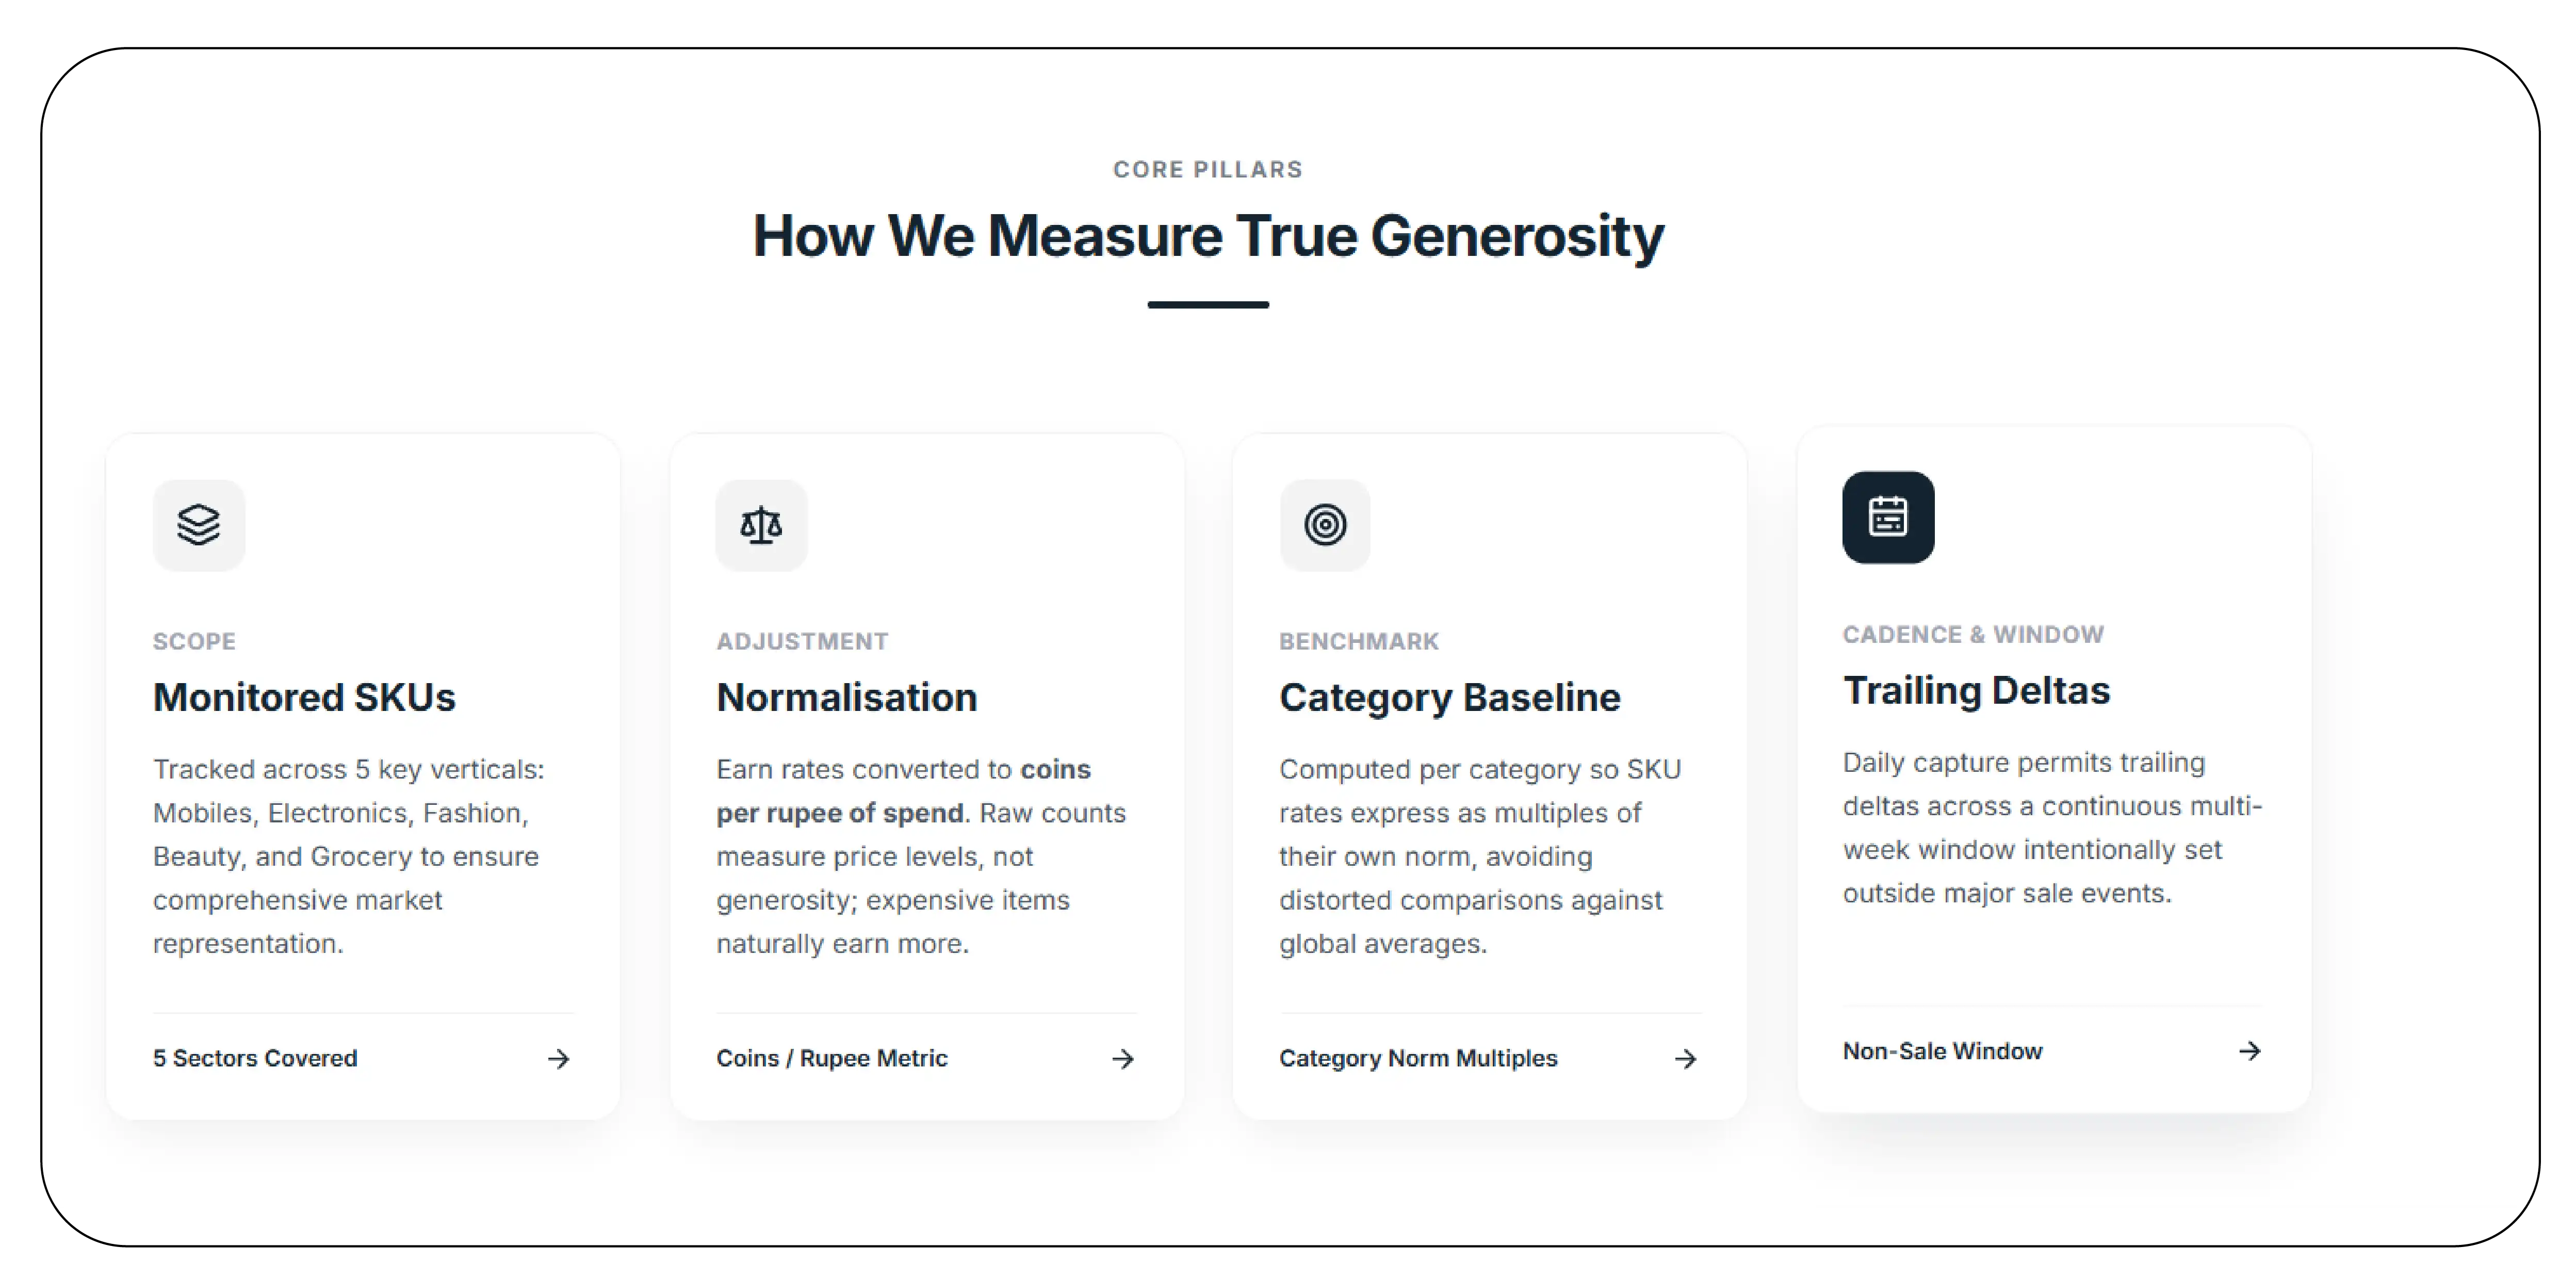
- Panel: Monitored SKUs across Mobiles, Electronics, Fashion, Beauty, and Grocery.
- Normalisation: All earn rates converted to coins per rupee of spend. Raw coin counts are not comparable across price points — an expensive item earning more coins is an arithmetic fact, not a finding — and any study built on raw counts is measuring price levels rather than generosity.
- Baseline: A category baseline earn rate computed per category, so that individual SKU rates can be expressed as a multiple of their own category norm rather than against a meaningless global average.
- Frequency: Daily capture, permitting trailing deltas.
- Window: A continuous multi-week window outside a major sale event.
2. Finding One: Earn Rates Vary Systematically by Category
| Category |
Median Earn Rate (coins per ₹) |
Share of SKUs Above Category Baseline |
Widest Observed Multiple vs Baseline |
| Grocery & Essentials |
Highest of the panel |
~34% |
~4.8× |
| Beauty & Personal Care |
High |
~29% |
~4.1× |
| Fashion |
Moderate |
~22% |
~3.4× |
| Electronics |
Lower |
~17% |
~3.0× |
| Mobiles |
Lowest of the panel |
~14% |
~3.1× |
Illustrative figures.
The gradient runs consistently in one direction: earn rates are most generous, per rupee, in high-frequency, low-ticket categories, and least generous in low-frequency, high-ticket ones.
This is coherent and it is deliberate. A loyalty currency is a retention instrument, and retention is a meaningful lever only where repeat purchase is frequent. Grocery is bought weekly. A smartphone is bought every few years. A coin issued on grocery has a realistic chance of bringing the customer back next week; a coin issued on a phone has to survive three years before it does anything.
The commercial reading is straightforward: on grocery and essentials, SuperCoins are a habit instrument. On mobiles and electronics, they are a rounding error — and any brand in those categories treating them as a meaningful competitive lever is mispricing the mechanic.
3. Finding Two: Elevated Earn Rates Cluster With Other Promotional Signals
We flagged every SKU whose earn rate sat materially above its category baseline, then examined what else was true of those SKUs.
| Attribute |
Base Rate Across Panel |
Among Elevated-Earn SKUs |
| Carries an active bank offer |
~64% |
~87% |
| Carries a deal or promotional flag |
~21% |
~58% |
| Is a recent listing (new launch) |
~9% |
~31% |
| Sits in a category with intense cross-platform competition |
~35% |
~62% |
Illustrative figures.
Elevated earn rates do not occur randomly. They occur where promotional effort is already concentrated — and the strongest single association is with new launches.
This is the pattern worth naming, because it resolves something that otherwise looks strange to a competitor watching from outside.
A brand launching a product faces a real dilemma. Discount at launch and you have anchored a low reference price that will have to be walked back — publicly, painfully, and usually at the cost of the launch narrative. Do not discount, and trial is slow.
An elevated SuperCoin earn rate resolves the dilemma. The customer receives real value. The listed price remains intact. There is no reference price to unwind later, because the price never moved.
To any competitor benchmarking on listed price, the launch appears un-discounted. It is not. The discount has simply been routed through a layer the competitor is not reading.
4. Finding Three: The Realised Value Is Well Below Face
The most common error is treating the earn rate as a straightforward discount. It is not, and the gap is large.
Four factors compound, and all four pull the same way:
| Factor |
Effect on realised value |
| Redemption value per coin |
The coin redeems at a defined rate that must be applied, not assumed |
| Redemption cap |
Only a portion of any purchase can be settled in coins, so balances accumulate faster than they can be deployed |
| Redemption rate (breakage) |
A share of coins earned are never spent — expiry, dormancy, abandonment |
| Time discount |
Value received on a future purchase is worth less than value received today |
An illustrative reconciliation on a single record:
| Step |
Value |
| Coins earned |
750 |
| × redemption value per coin |
750 |
| × redemption cap utilisation |
~600 |
| × redemption rate (breakage applied) |
~390 |
| × time discount |
~315 |
| Realised value |
~315, against a face value of 750 |
Illustrative; every multiplier after the first is an assumption that must come from your own transaction data.
Roughly 42 percent of face value in this illustration. The exact figure will differ for every operator and every customer base. The direction will not.
Implication, and it is the central practical message of this report: a pricing team that subtracts face value from the effective price will overstate the discount — and will overstate it most for the competitor who uses the lever most aggressively. Which means the error does not merely add noise. It systematically flatters the competitor you should be watching most closely, and it does so in proportion to how much you should be watching them.
An implicit weight of 1.0 is still a weight. It is just an indefensible one.
5. Finding Four: Earn Rates Are a Read on Platform Priorities
Aggregating earn rates by category, over time produces a signal that has nothing to do with any individual SKU.
Categories where the platform-level baseline earn rate rises are categories in which promotional effort is being concentrated — because someone is funding it, and nobody funds a loyalty rate for no reason.
Across the observation window, we saw baseline earn rates shift at the category level in ways that tracked competitive pressure: categories under the most intense cross-platform competition showed both the highest baselines and the most movement.
Implication: this is a free, public read on where promotional budget is going. For a brand planning trade spend, it is a useful input for an unglamorous reason — the cheapest promotional window to enter is one where someone else is already spending into it. Riding a period of elevated platform-level promotional intensity costs less than creating one.
6. Finding Five: The Signal Is in the Delta
The absolute earn rate is context. The change is the event.
A competitor who holds their listed price, holds their bank offer, and triples their coin rate has cut price — quietly, reversibly, and in a place your dashboard does not look. Reversibly is the important word: a public price cut is hard to undo, and a coin rate can be reset next week with nobody noticing.
That is exactly why the lever gets used, and exactly why the delta is worth alerting on.
Implication: alert on earn_rate_delta, not on the level. A frozen listed price accompanied by a rising coin rate is not a stable competitor. It is a moving one.
7. What Brands Should Change
Normalise to coins per rupee. Raw counts compare price levels, not generosity.
Benchmark against a category baseline. An earn rate without its baseline is an uninterpretable number.
Apply realisation weights. Rough weights beat an implicit 1.0 by a wide margin.
Calibrate effort to category. SuperCoins are a genuine lever in grocery and beauty. In mobiles and large electronics, they are close to noise. Spend attention accordingly.
Watch new launches specifically. This is where the lever is used to substitute for a discount, and where a listed-price benchmark is most likely to mislead you.
Alert on the delta. The level is context. The change is the move.
8. Limitations
Findings reflect a monitored panel rather than a platform census. Redemption value, cap utilisation, breakage, and time discount are not publicly observable and must be sourced from an operator's own transaction data — every realised-value figure in this report rests on illustrative assumptions and should be recomputed with real weights before being relied upon. Earn rates change with promotional cycles and sale calendars. Category composition affects every figure. All figures are illustrative of observed patterns rather than audited statistics.
9. About the Data
This report was produced using SuperCoin earn-rate data collected by Product Data Scrape. Our Flipkart datasets capture SuperCoin earn rates on every record — normalised to coins per rupee, benchmarked against a captured category baseline, with elevated-earn and promotional flags and trailing deltas — alongside structured bank offers, no-cost EMI terms, exchange valuations, Plus pricing, per-variant stock, and the full multi-seller array.
Delivered as JSON, CSV, via REST API, or pushed directly to cloud storage and data warehouses.
Want the earn-rate benchmark run on your category? Product Data Scrape will capture the rates across your SKUs and your competitors', apply your own realisation weights, and show you the discount layer you are not currently pricing.
Product Data Scrape — turning marketplace complexity into decision-ready data.


 Singapore
 EMAIL
EMAIL
 PHONE
PHONE


.webp)
.webp "thumb")
.webp "thumb")
.webp "thumb")













.webp)






