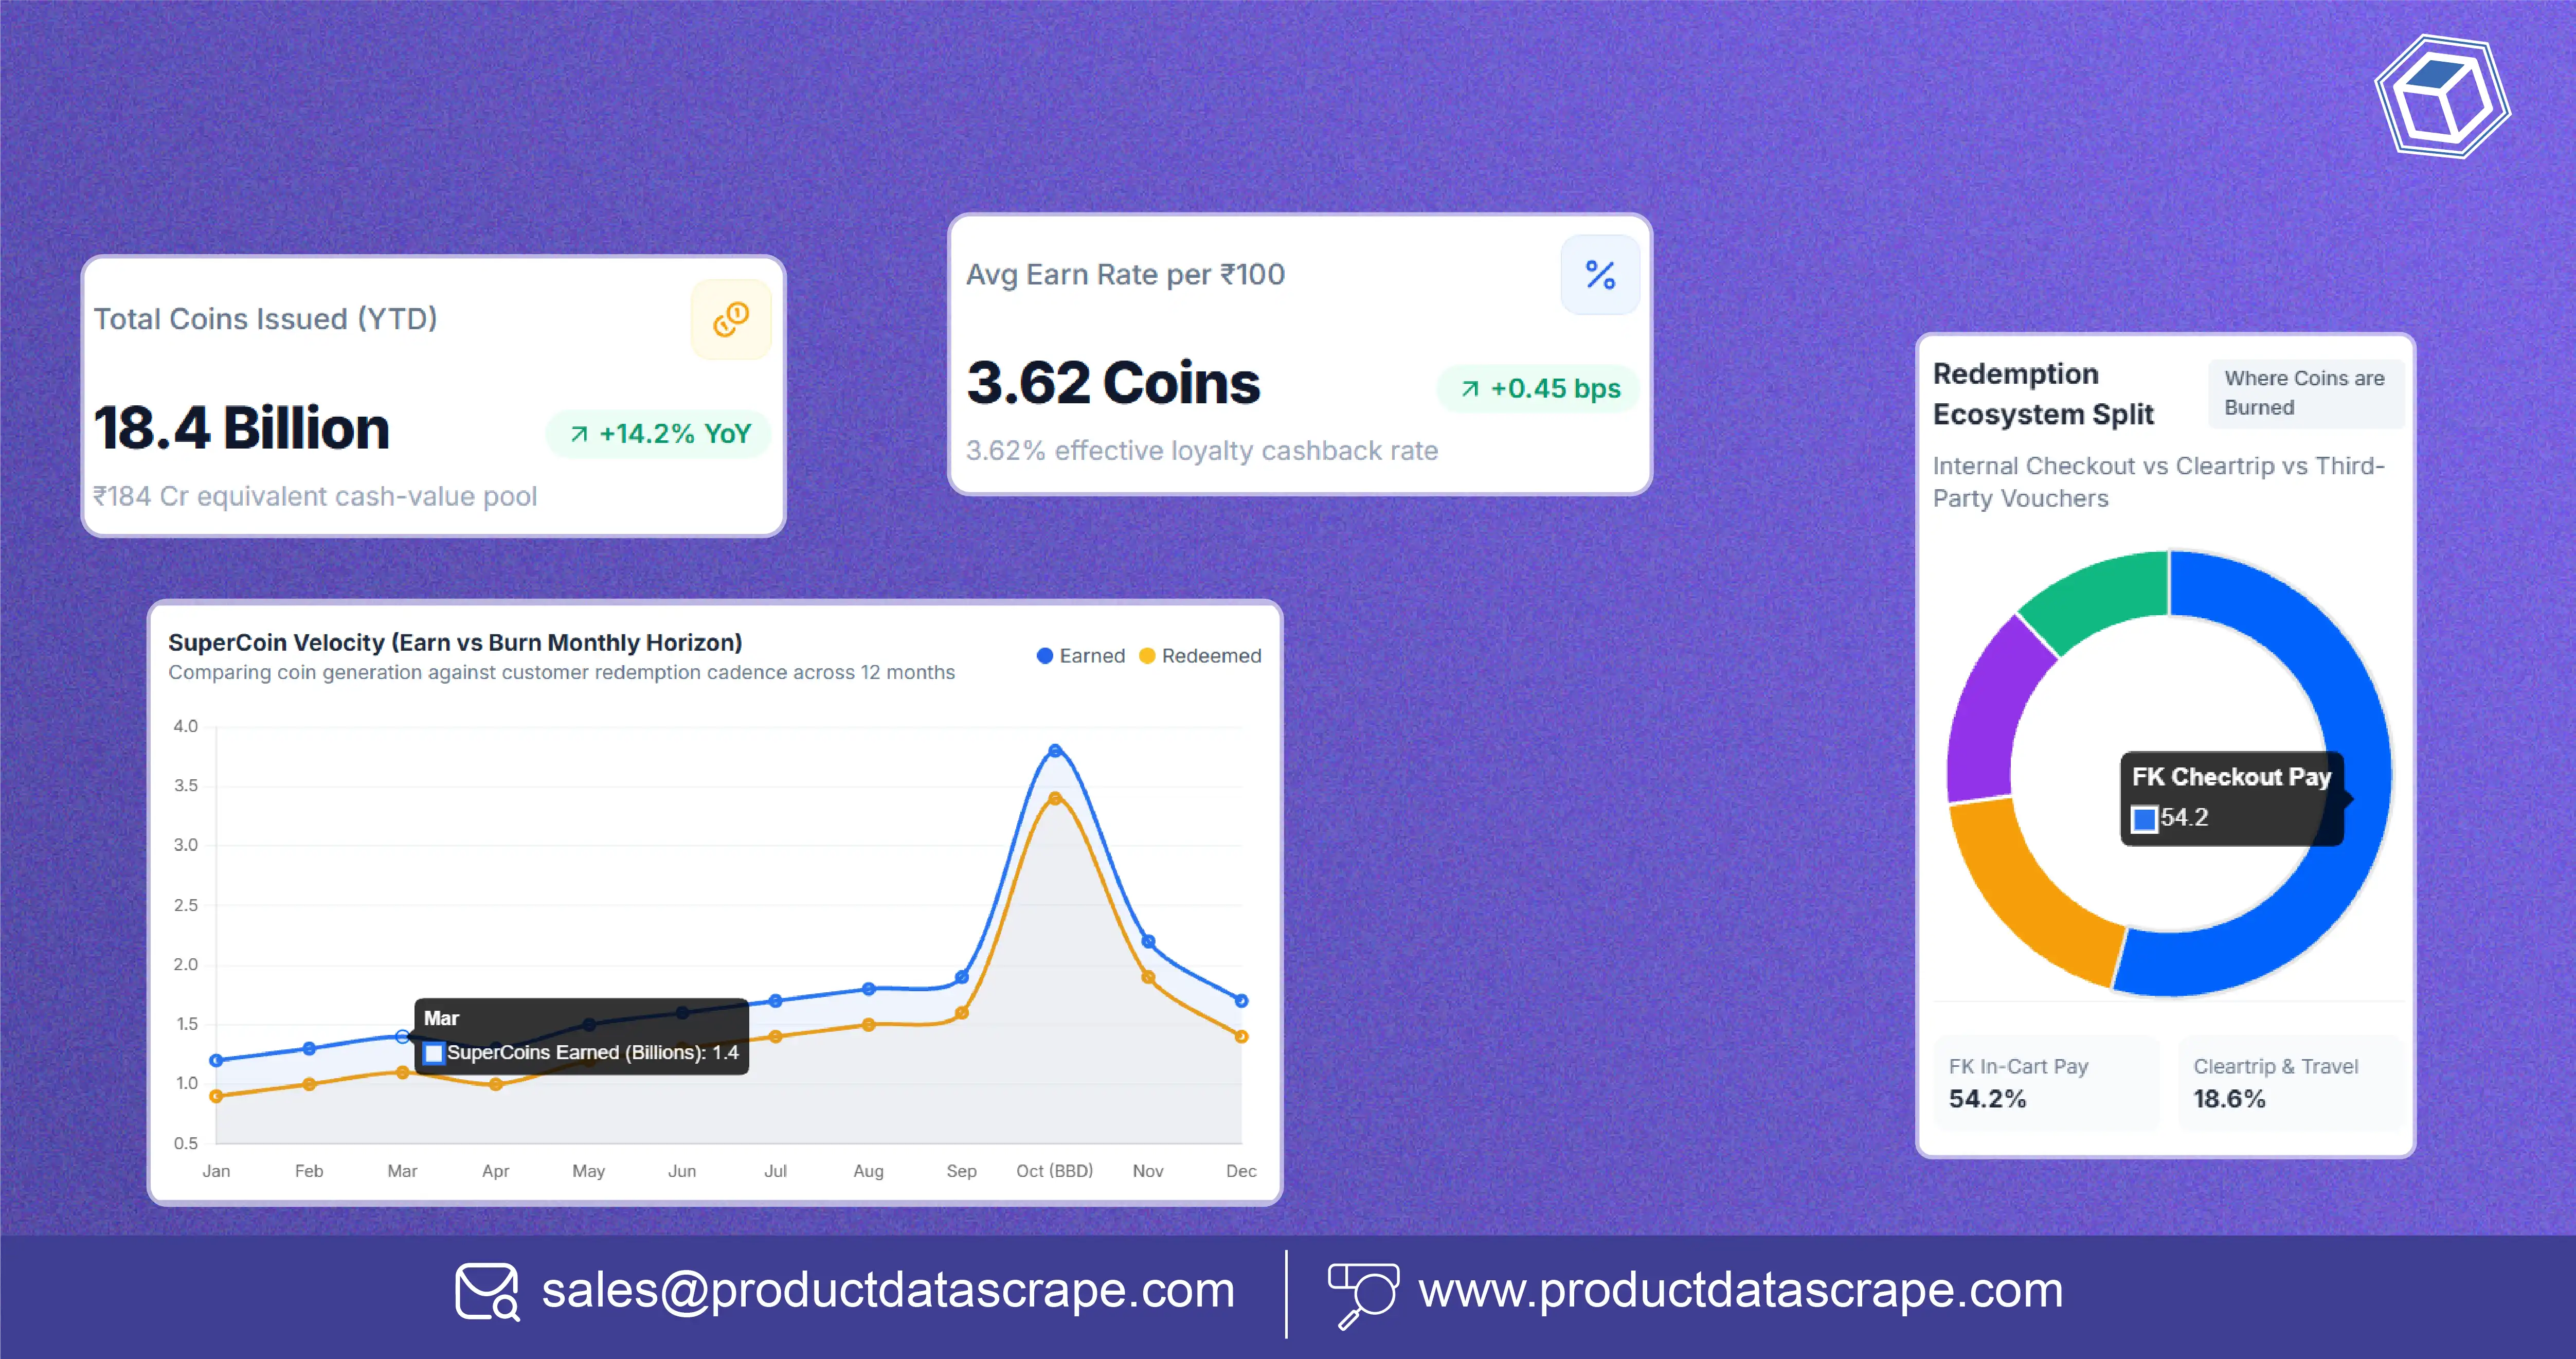
Introduction
Most pricing teams treat SuperCoins as marketing furniture. A loyalty gimmick. Points. Something the CRM team worries about, filed somewhere between the newsletter and the app push notification.
This is a mistake, and it is a mistake with a number attached to it.
SuperCoins are a discount instrument. They reduce the effective price a customer pays. Their earn rate varies by SKU and by category, it changes over time, and it changes deliberately — which means that reading it tells you something about what the platform is pushing and what a competitor is funding.
They are also, conveniently, one of the few competitive signals that is entirely public, entirely free to read, and almost universally ignored.
This guide covers Flipkart SuperCoin data: how the mechanic actually works, why the face value is not the real value, how to compute a defensible number, and what the earn-rate pattern reveals that nothing else does.
The Mechanic, Briefly
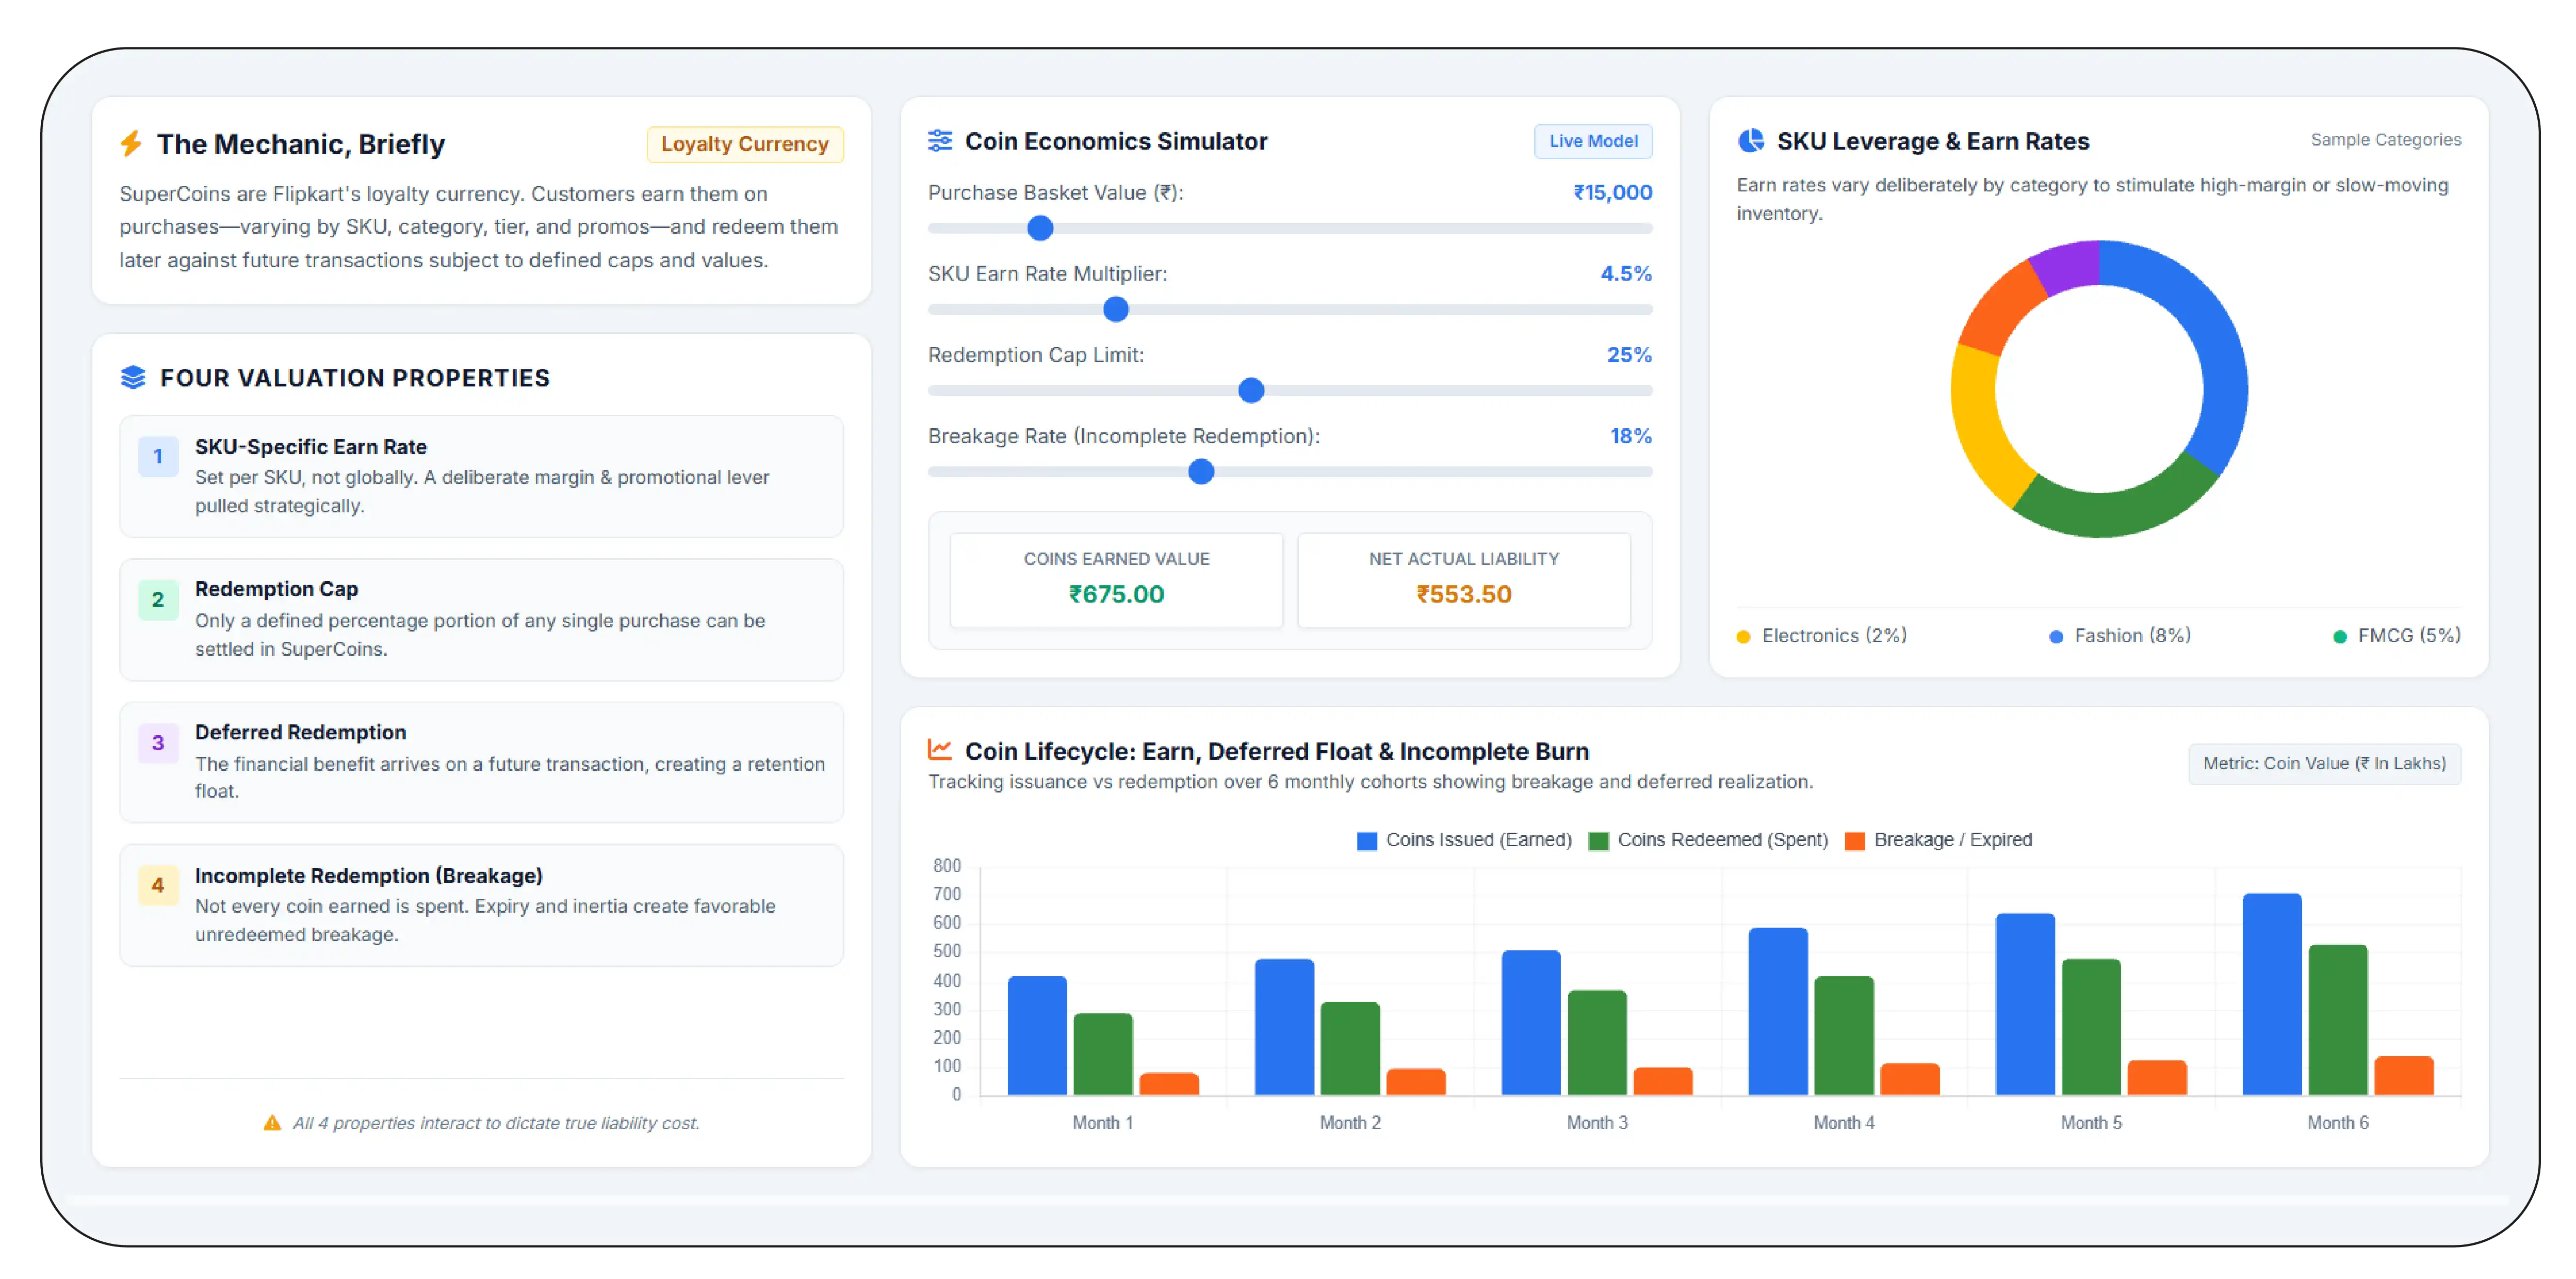
SuperCoins are Flipkart's loyalty currency. A customer earns them on purchase — the earn rate varies by SKU, category, membership tier, and promotional period — and redeems them against future transactions, typically at a defined value per coin and subject to a cap on how much of any single purchase can be paid for in coins.
Four properties follow, and each one matters for anyone trying to value them:
- The earn rate is set per SKU, not globally. It is a lever, and it is pulled deliberately.
- Redemption is capped — only a portion of a given purchase can be settled in coins.
- Redemption is deferred — the benefit arrives on a future transaction, not this one.
- Redemption is incomplete — not every coin earned is a coin spent.
Any calculation that ignores properties 2, 3, and 4 will produce a number that is too large. Most calculations we see ignore all three.
Why SuperCoins Belong in Your Pricing Model
Consider two competing SKUs at identical listed prices, identical bank offers, identical everything — except that one earns 200 SuperCoins and the other earns 600.
On every dashboard that captures listed price, these two SKUs are at parity.
They are not at parity. One of them is cheaper, and the gap is real, and the customer — particularly the engaged, repeat-purchase customer who is the most valuable customer either brand has — can see it plainly in the app.
The gap is not enormous on any single transaction. But it is systematic, it compounds across a category, and it is invisible to anyone benchmarking on listed price. Which is precisely what makes it useful: it is a competitive lever that works partly because your competitor is not watching it.
The Valuation Problem: What Is a SuperCoin Actually Worth?
Here is where most attempts go wrong. The temptation is to take the earn rate, multiply by a face value, and subtract the result from the price.
That figure is the ceiling, and almost nobody reaches it. The realised value is meaningfully lower, for four separate and compounding reasons.
Redemption value ≠ face value. Coins redeem at a defined rate against a purchase, and the rate is not always what an intuitive reading of the mechanic suggests.
The redemption cap binds. If only a portion of a transaction can be settled in coins, a customer holding a large balance cannot deploy it on the purchase where they most want to. Coins accumulate faster than they can be spent, which means a portion of any balance is functionally dormant.
Deferral discounts the value. A rupee of benefit available today and a rupee of benefit available on a future purchase in three months are not the same rupee. The correct treatment applies a discount for time — modest, but real.
Redemption is incomplete. Some coins expire. Some customers never return. Some balances sit permanently below the threshold at which they are worth deploying. Breakage — the industry's word for loyalty currency that is earned and never spent — is a well-established phenomenon across every loyalty programme ever run, and it is not small.
An honest structure:
realised_supercoin_value =
    supercoins_earnable
  × redemption_value_per_coin
  × redemption_cap_utilisation
  × redemption_rate
  × time_discount_factor
Every term after the first pulls the number down. A naive calculation that uses only the first two terms will overstate the discount, and it will overstate it more for competitors than for you — because you know your own redemption behaviour and you are guessing at theirs.
What scraped data provides is the first term, captured accurately and consistently across your SKUs and your competitors' SKUs. The remaining terms are yours to set, from your own transaction data. That division is the honest one, and it is worth being explicit about: Product Data Scrape can tell you exactly what a competitor is offering. It cannot tell you what their customers do with it.
Why Earn Rates Vary — and What the Variation Tells You
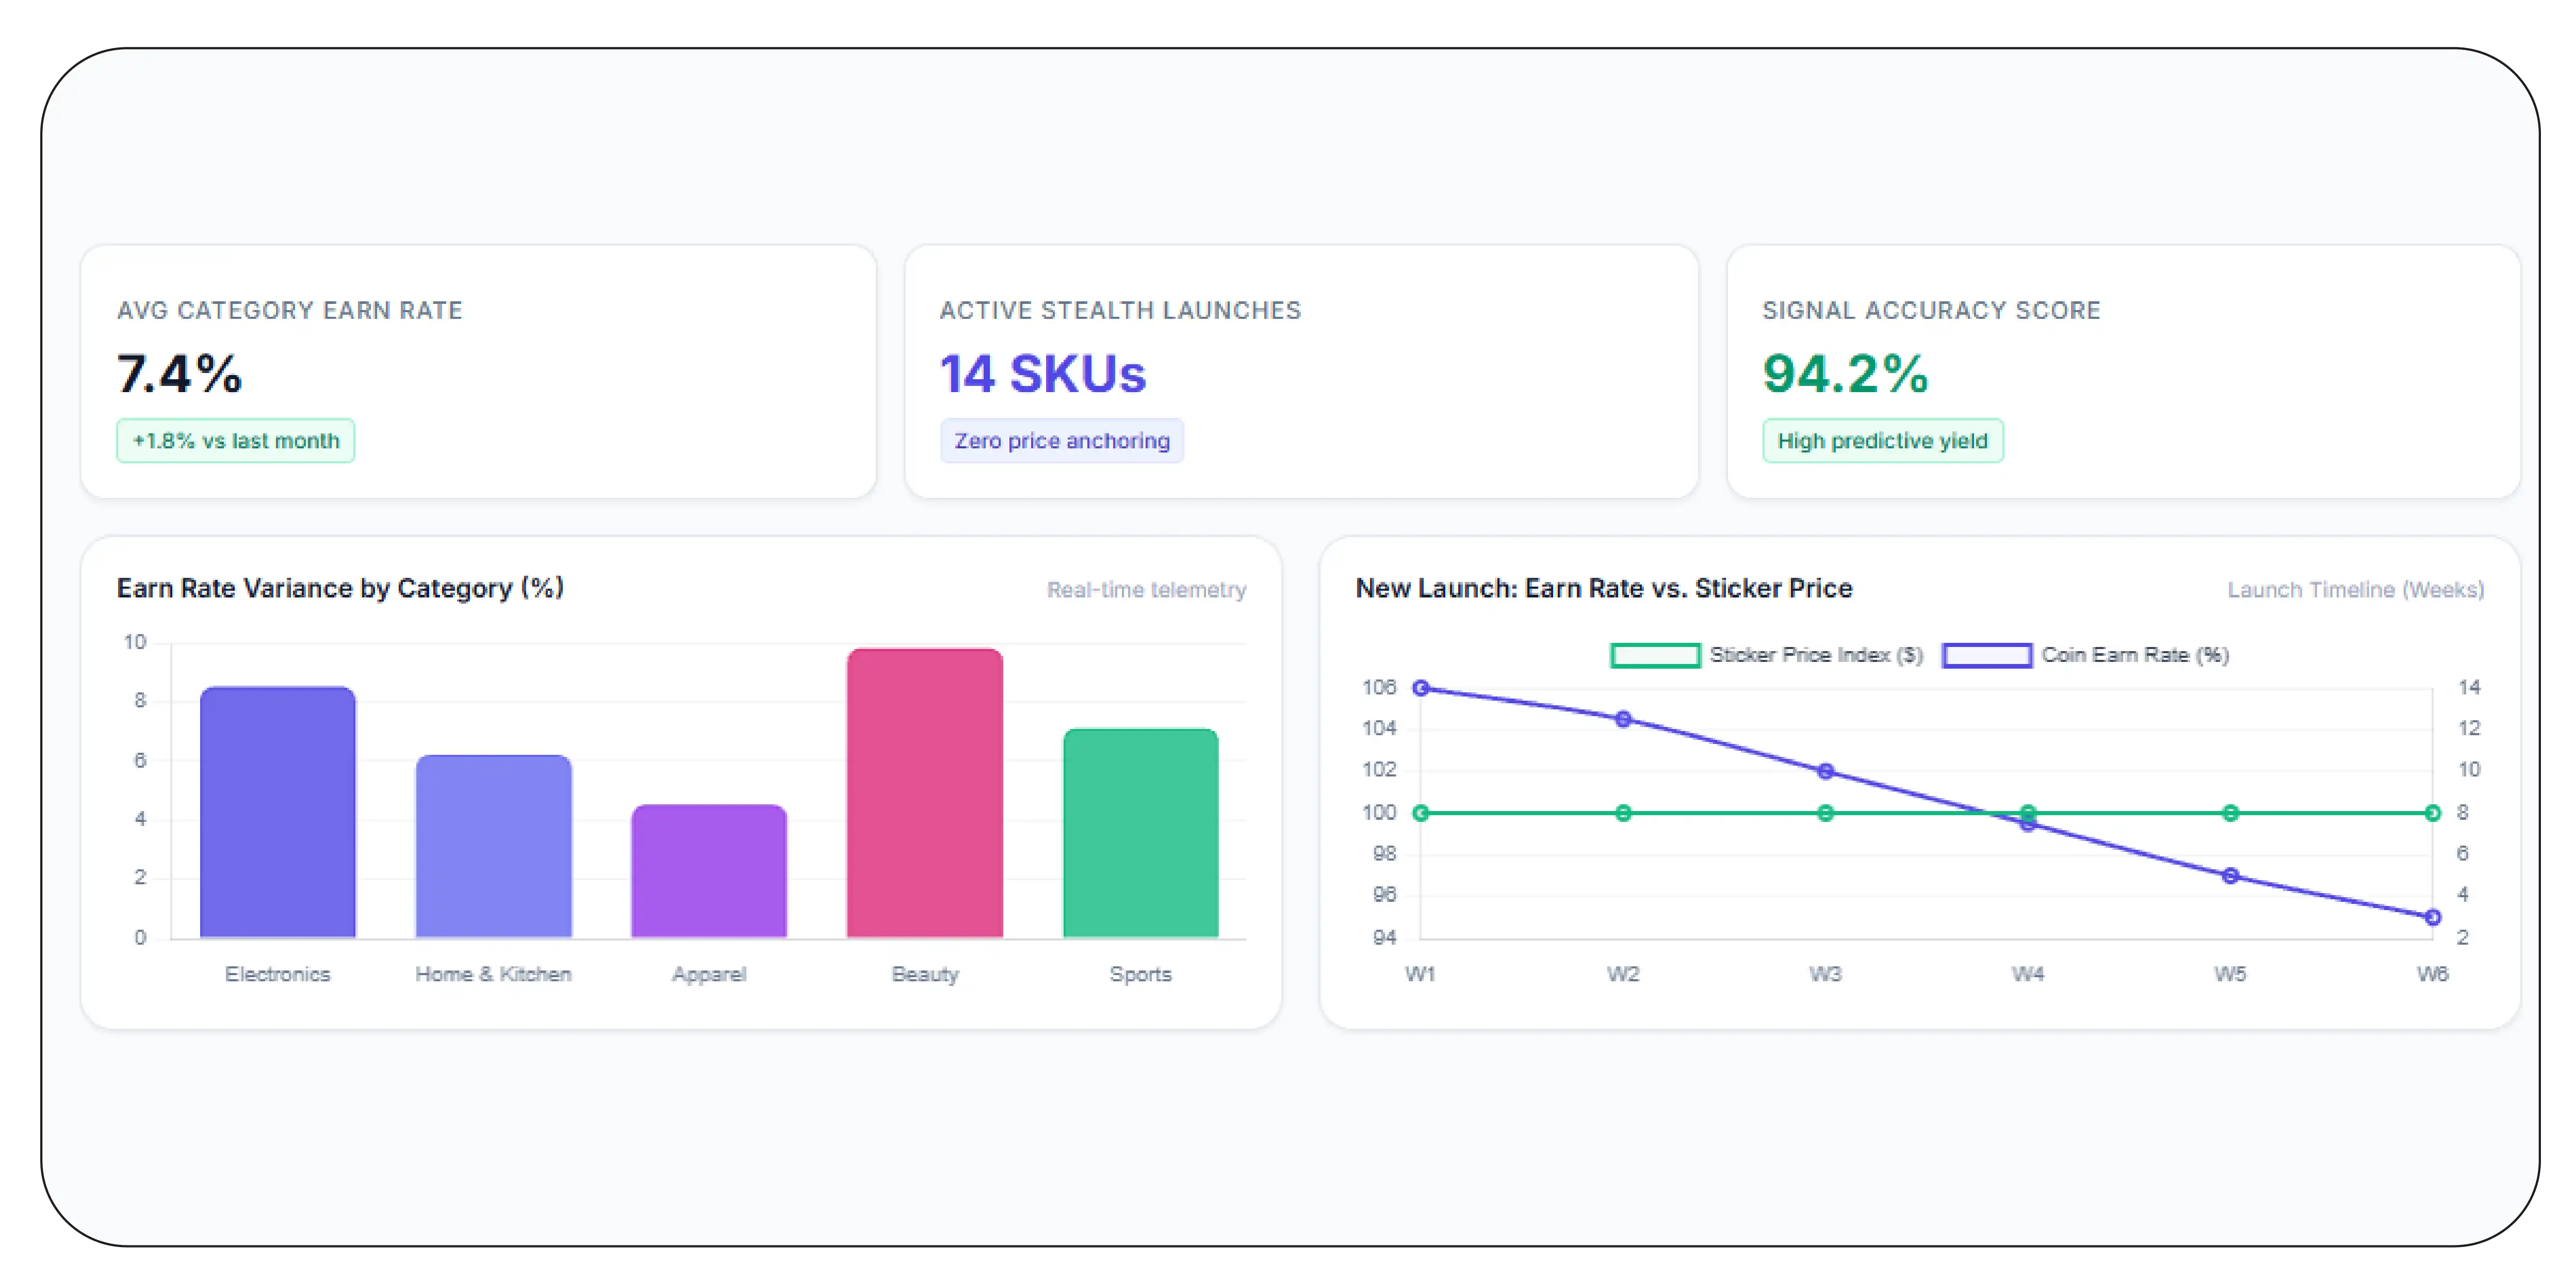
This is the part that most people miss, and it is the most interesting part.
Earn rates are not uniform. They vary by category, by SKU, and over time. And because they are a lever that costs someone money to pull, variation is signal.
An elevated earn rate on a SKU means one of a small number of things:
- The platform is pushing that category — running a promotional period, defending share against a competing platform, or driving trial in a segment it wants to grow.
- The seller or brand is funding an elevated rate as a promotional instrument, in the same way they would fund a bank offer.
- A new launch is being seeded, where the coin rate is doing the work a price cut would otherwise do — without setting a low reference price that has to be walked back later.
That last one is worth dwelling on. A brand launching a product faces a genuine dilemma: discount to drive trial, and you have anchored the price low, permanently. Do not discount, and trial is slow.
An elevated SuperCoin earn rate resolves it. The customer gets value. The listed price stays intact. There is no reference price to walk back.
If you are not reading SuperCoin data, you cannot see that move. You will look at a competitor's new launch, observe that they did not discount it, conclude they are pricing with confidence — and be entirely wrong.
The Fields
| Field |
Description |
| supercoins_earnable |
Coins earned on purchase of this SKU |
| supercoin_earn_rate |
Coins per rupee, normalised — the comparable metric |
| is_elevated_earn |
Whether this SKU's rate is above its category baseline |
| category_baseline_earn_rate |
The denominator — without it, the rate is uninterpretable |
| plus_earn_multiplier |
Whether Plus members earn at a different rate |
| promotional_earn_active |
Whether an elevated rate is flagged as promotional |
| earn_rate_delta_7d |
Change against the trailing week — where the signal lives |
| captured_at |
Timestamp |
Two of these do the real work.
supercoin_earn_rate (coins per rupee) is the normalised metric. Raw coin counts are not comparable across SKUs — a 40,000-rupee television earning 400 coins and a 400-rupee snack earning 40 coins are not comparable on the raw number, and any analysis built on raw counts is comparing price levels rather than earn generosity.
earn_rate_delta_7d is where the competitive signal lives. The absolute rate tells you the state of the world. The change tells you what someone just decided.
Sample Data
{
  "product_id": "MOBH8G7ZQJ4XYZAB",
  "title": "Smartphone Model X Pro (128 GB)",
  "category": "Mobiles > Smartphones",
  "captured_at": "2026-07-14T10:05:19+05:30",

  "listed_price": 24999,
  "plus_exclusive_price": 23749,

  "supercoins_earnable": 750,
  "supercoin_earn_rate": 0.0300,
  "category_baseline_earn_rate": 0.0096,
  "is_elevated_earn": true,
  "earn_multiple_vs_category": 3.13,
  "plus_earn_multiplier": 1.0,
  "promotional_earn_active": true,
  "earn_rate_delta_7d": 0.0204,

  "estimated_face_value": 750,
  "estimated_realised_value": 315,
  "realised_value_pct_of_price": 1.26
}
And the comparison a pricing analyst would actually build:
| SKU |
Listed Price |
Bank Offer |
SuperCoins |
Earn Rate |
vs Category |
Realised Coin Value |
Effective Price |
| Our SKU |
24,999 |
−1,500 |
240 |
0.0096 |
1.0× (baseline) |
−101 |
23,398 |
| Competitor A |
24,999 |
−1,500 |
750 |
0.0300 |
3.1× |
−315 |
23,184 |
| Competitor B |
25,499 |
−2,000 |
255 |
0.0100 |
1.0× |
−107 |
23,392 |
Illustrative figures.
Read the row for Competitor A carefully. Identical listed price. Identical bank offer. On every conventional dashboard, at parity with us.
They are cheaper — by a little on realised coin value, and by considerably more in the perception of an engaged Flipkart Plus user who watches their coin balance. And the earn_rate_delta_7d of +0.0204 says this is not a standing arrangement. They changed it this week.
That is a competitor move. It happened in public. And a pricing team benchmarking on listed price will never know it occurred.
Four Things to Do With This Data
1. Get the effective price right
SuperCoins are a term in the effective-price equation. Omitting them biases every competitive comparison in the same direction — and biases it most against competitors who use the lever most aggressively, which is exactly the wrong direction to be wrong in.
2. Read the platform's promotional priorities
Aggregate earn rates by category and watch them over time. Categories where the platform-level earn rate rises are categories the platform is pushing. That is a free read on where Flipkart is deploying its own promotional budget, and it is a useful input to your own trade planning: the cheapest promotional period to run is the one where the platform is already spending.
3. Catch competitor moves that are invisible on price
The earn_rate_delta_7d alert. A competitor who freezes listed price, holds their bank offer, and triples their coin rate has cut price — quietly, reversibly, and in a place your dashboard does not look. Alert on it.
4. Benchmark your own loyalty economics
If your competitors are funding elevated earn rates and you are not, you are conceding a lever. If you are funding one and it is not moving anything, you are burning promotional budget in a place nobody is looking. Either finding is worth having, and neither is available without the data.
Three Mistakes to Avoid
Using face value. It overstates the benefit, and it overstates it inconsistently across SKUs. Apply realisation weights, even rough ones. A rough weight is dramatically better than an implicit weight of 1.0.
Comparing raw coin counts. Normalise to coins per rupee. Otherwise you are comparing price levels, not generosity, and your "insight" is that expensive things earn more coins.
Reading the level instead of the change. The absolute earn rate is context. The delta is the signal. Build the alert on the delta.
Scale and Compliance
SuperCoin earn rates change with promotional cycles, sale events, and category pushes — frequently enough that a monthly capture is close to useless. Daily capture is the sensible baseline, with higher frequency during sale periods when earn rates are actively used as a competitive instrument.
Product Data Scrape captures SuperCoin earn rates on every record, normalised to coins per rupee and benchmarked against a captured category baseline, alongside the full offer stack, Plus pricing, seller array, and per-variant data. We collect publicly available product information only.
Frequently Asked Questions
Do you capture SuperCoin earn rates on every SKU?
Yes, on every record, alongside the category baseline that makes the rate interpretable.
Can you tell us when a competitor changes their earn rate?
Yes — the trailing delta is computed and can be alerted on.
Can you tell us what a SuperCoin is worth?
We capture the earn rate accurately. The realised value depends on your own redemption and breakage assumptions, which we take as inputs rather than invent.
Is this really worth tracking?
On a single transaction, the value is small. As a competitive signal, it is one of the clearest and least-watched instruments on the platform — which is exactly why it is worth watching.
Read the Layer Nobody Is Reading
Your competitor's last price move may not have been a price move. It may have been a coin move — public, visible, and completely absent from your dashboard.
Product Data Scrape captures Flipkart SuperCoin data on every record: earn rate, normalised coins-per-rupee, category baseline, elevated-earn flags, promotional flags, and trailing deltas — alongside structured bank offers, no-cost EMI, exchange valuations, Plus pricing, per-variant stock, and the full seller array.
Ask us for a SuperCoin earn-rate benchmark across your category. It is a small dataset, and it tends to produce a disproportionately large reaction in the room.
Product Data Scrape — turning marketplace complexity into decision-ready data.


 Singapore
 EMAIL
EMAIL
 PHONE
PHONE


.webp)
.webp "thumb")
.webp "thumb")
.webp "thumb")













.webp)






